
Abstract
Capitalizing on liver tropism of adeno-associated viral (AAV) vectors, intravenous vector administration is commonly used to genetically modify hepatocytes, a strategy currently in clinical trials for a number of liver-based hereditary disorders. Although hepatocytes are known to exhibit extensive phenotypic heterogeneity influenced by liver zonation and dietary cycle, there is little data available for the tropism capacity, as well as the potential transcriptional dysregulation, of AAV vectors for specific liver cell types. To assess these issues, we employed single-cell RNA sequencing of the mouse liver after intravenous administration of the liver tropic AAVrh.10 vector to characterize cell-specific AAV-mediated transgene expression and transcriptome dysregulation. Wild-type 8-week-old male C57Bl/6 mice under normal feed cycle were randomly divided into three groups and intravenously administered phosphate-buffered saline (PBS), AAVrh.10Null (no transgene), or AAVrh.10mCherry (marker gene). Overall, a total of 46,500 liver cells were sequenced. The single-cell transcriptomic profiles were grouped into three separate clusters of hepatocytes (Ttr-enriched “Hep1,” Tat-enriched “Hep2,” and Alb-enriched “Hep3”) and multiple other cell types. The hepatocyte diversity was driven by glucose and lipid homeostasis signaling. Assessment of the transgene expression demonstrated that AAVrh.10 is primarily Hep1-tropic, with a 10-gene signature positively correlated with AAVrh.10-mediated transgene expression. The transgene expression was less in Hep2 and Hep3 cells with a high receptor tyrosine kinase phenotype. Importantly, AAVrh.10 vector interactions with the liver markedly altered the transcriptional patterns of all cell types, with modified genes enriched in pathways of complement and coagulation cascade, cytochrome P450, peroxisome, antigen processing and presentation, and endoplasmic reticulum protein processing. These observations provide insights into the liver cell-specific consequences of AAV-mediated liver gene transfer, far beyond the well-known organ-specific expression of the vector-delivered transgene.
Introduction
Owing to its highly efficient ability to genetically modify liver hepatocytes, intravenous administration of adeno-associated viral (AAV) vectors are widely used to genetically modify the liver to treat liver-based hereditary disorders. 1 –5 Despite the knowledge that hepatocytes exhibit extensive phenotypic heterogeneity influenced by liver zonation and dietary cycle, and ∼50% of hepatocyte transcripts are expressed in a zonated pattern, 6 –12 the phenotypic tropism of AAV-mediated gene transfer in the liver at the single-cell level is unknown. Furthermore, there is limited understanding of possible AAV-mediated transcriptome dysregulation of the specific cell populations in the liver.
In this study, we leveraged the power of single-cell transcriptome analysis to characterize the cell-type–specific transgene expression and cell-specific vector-mediated transcriptome dysregulation in the mouse liver after intravenous administration of AAVrh.10, a nonhuman Clade E liver tropic AAV vector. 13 –15 Sequencing of 46,500 liver cells under normal fed cycle led to the observation that AAV vector interaction with the liver results in transduction of multiple cell types, including three subtypes of hepatocytes (Ttr-enriched “Hep1,” Tat-enriched “Hep2,” and Alb-enriched “Hep3”). Moreover, AAV vector interactions with the liver altered the transcriptional patterns of multiple cell types, evoking significant cell-type–specific transcriptional dysregulation. Our data provide cautionary insights into AAV phenotypic tropism, as well as possible off-target effects of AAV-mediated gene transfer in various hepatocyte subtypes, far beyond the well-known organ-level expression of the vector-delivered transgene and immune responses to the AAV capsid and/or transgene.
Methods
Mice
Experiments were conducted in accordance with the ethical guidelines of the National Institutes of Health and with the approval of the Institutional Animal Care and Use Committee. Wild-type 8-week-old male C57BL/6J mice were used. Mice were group housed in cages of three in a 12-h light–dark cycle with food and water provided ad libitum. The mice were randomly divided into three groups (n = 3 per group), and intravenously administered AAVrh.10Null, AAVrh.10mCherry (1011 genome copies), or saline as a control. The AAVrh.10Null (transgene replaced by an intronic sequence) and AAVrh.10-mCherry (marker gene driven by a cytomegalovirus [CMV] early enhancer/chicken beta actin promoter, exon, and intron/rabbit beta-globin splice acceptor [CAG] promoter) vectors were prepared as previously described. 16,17 Two weeks after vector administration, the mice were sacrificed for analysis.
Liver single-cell isolation
Liver cells were isolated from mice by a two-step collagenase perfusion technique as described by Li et al. 1 8 with modifications. In brief, after the inferior vena cava was cannulated and portal vein cut, the liver was perfused at 10 mL/min through the inferior vena cava with liver perfusion medium (PBS supplemented with 0.2 mM ethylenediaminetetraacetic acid, 10 mM HEPES, and 5 mM glucose) at 37°C for 10 min, followed by perfusion with collagenase type IV (Worthington, Lakewood, NJ) at 37°C for an additional 10 min. The liver was dissociated in a Petri dish and passed through a 70 μm mesh filter. The dissociated liver cells were then pelleted from supernatant by centrifugation, washed, passed through a 70 μm mesh filter twice, and resuspended in PBS supplemented with 0.1% bovine serum albumin. The single-cell suspension was diluted to a density of 100 cells/μL.
Drop-seq library preparation and sequencing
Drop-seq single-cell RNA sequencing was as previously described 19 at the Weill Cornell Genomics Core Facility. In brief, the single-cell suspension, barcoded beads, and droplet generation oil were running through a microfluidics device (FlowJEM, Toronto, Canada) to form the droplets. In the droplets containing both a single cell and a barcoded bead, the cell was immediately lysed, and the released mRNA hybridized to the primers on the surface of the beads. Droplet breakage, cDNA synthesis, and library preparation were carried out and the samples were sequenced on an Illumina HiSeq 2500 (Illumina, San Diego, CA).
Data preprocessing
Raw digital expression matrices that contain integer counts of number of transcripts for each gene in each cell were generated separately for each sequence using the McCarrol laboratory protocol. 19 Drop-seq libraries produced paired end reads that contain cell barcodes and unique molecular identifier (UMI) and the second read was aligned to the reference genome. The raw gene expression matrices for the nine samples were converted to Seurat objects using the Seurat v3 R package. 20
The raw data were filtered in two steps. First, all the genes expressed in at least 10 cells and all the cells with at least 200 detected genes were identified. Second, all the cells with the unique gene count >10,000 or the percentage of mitochondrial genes >0.5 was filtered out. The filtered gene expression matrices were then normalized by the total number of UMIs per cells, multiplying by a scale factor (10,000) and then log transformed. Cell–cell variations were regressed out in gene expression driven by number of UMIs as well as the percentage of mitochondrial gene content.
Data set alignment and unsupervised cell clustering
The data sets for the nine samples were combined following the alignment procedure of Seurat v3. 20 In brief, highly variable genes were identified across all the data sets by calculating the mean expression and dispersion (variance/mean) for each gene. With these genes, multiset canonical correlation analysis was performed using the FindIntegrationAnchors and IntegrateData functions to define a shared correlation space for the nine data sets, and generate an integrated gene expression matrix of 17,251 genes across the 46,500 cells.
For unsupervised cell clustering, RunPCA function was performed to run principal component (PC) analysis, then the RunTSNE function was used to perform t-distributed stochastic neighbor embedding (t-SNE) dimensionality reduction with the top 18 PCs, in which cells with similar expression signature genes and similar PCs loading localize near each other. The FindClusters function was then used with a resolution at one to distinguish the cell clusters. The clustering algorithm, K-nearest neighbor graph based on the Euclidean distance in principal component analysis (PCA) space, was constructed to iteratively group cells together.
Identification of cell cluster markers and differentially expressed genes
The FindAllMarkers function of Seurat v3 was used to identify marker genes in each cell cluster, and the FindMarkers function was used to identify differentially expressed genes between two groups of cells. Only genes that were detected in a minimum of 10% cells in either group and had an average difference of at least 0.25 (log scale) between the two groups were tested. Statistical significance was calculated using the Wilcoxon rank sum test. p-value adjustment was performed using Bonferroni correction based on total number of genes in the data set. An adjusted p-value <0.05 was considered significant.
Results
Cell-type identification
Overall, a total of 46,500 male mouse liver cells were sequenced. For data analysis, the single-cell transcriptomic data sets derived from nine animals were combined. Batch effects were minimized using the data set alignment pipeline of Seurat v3 (Supplementary Fig. S1). Nine cell clusters were identified using unsupervised clustering with the PCA/t-SNE method (Fig. 1A). Based on known cell-type markers, 9,10,21 hepatocytes, endothelial cells, Kupffer cells, B cells, T cells, hepatic stellate cells, and cholangiocytes were identified (Fig. 1B, Supplementary Table S1).
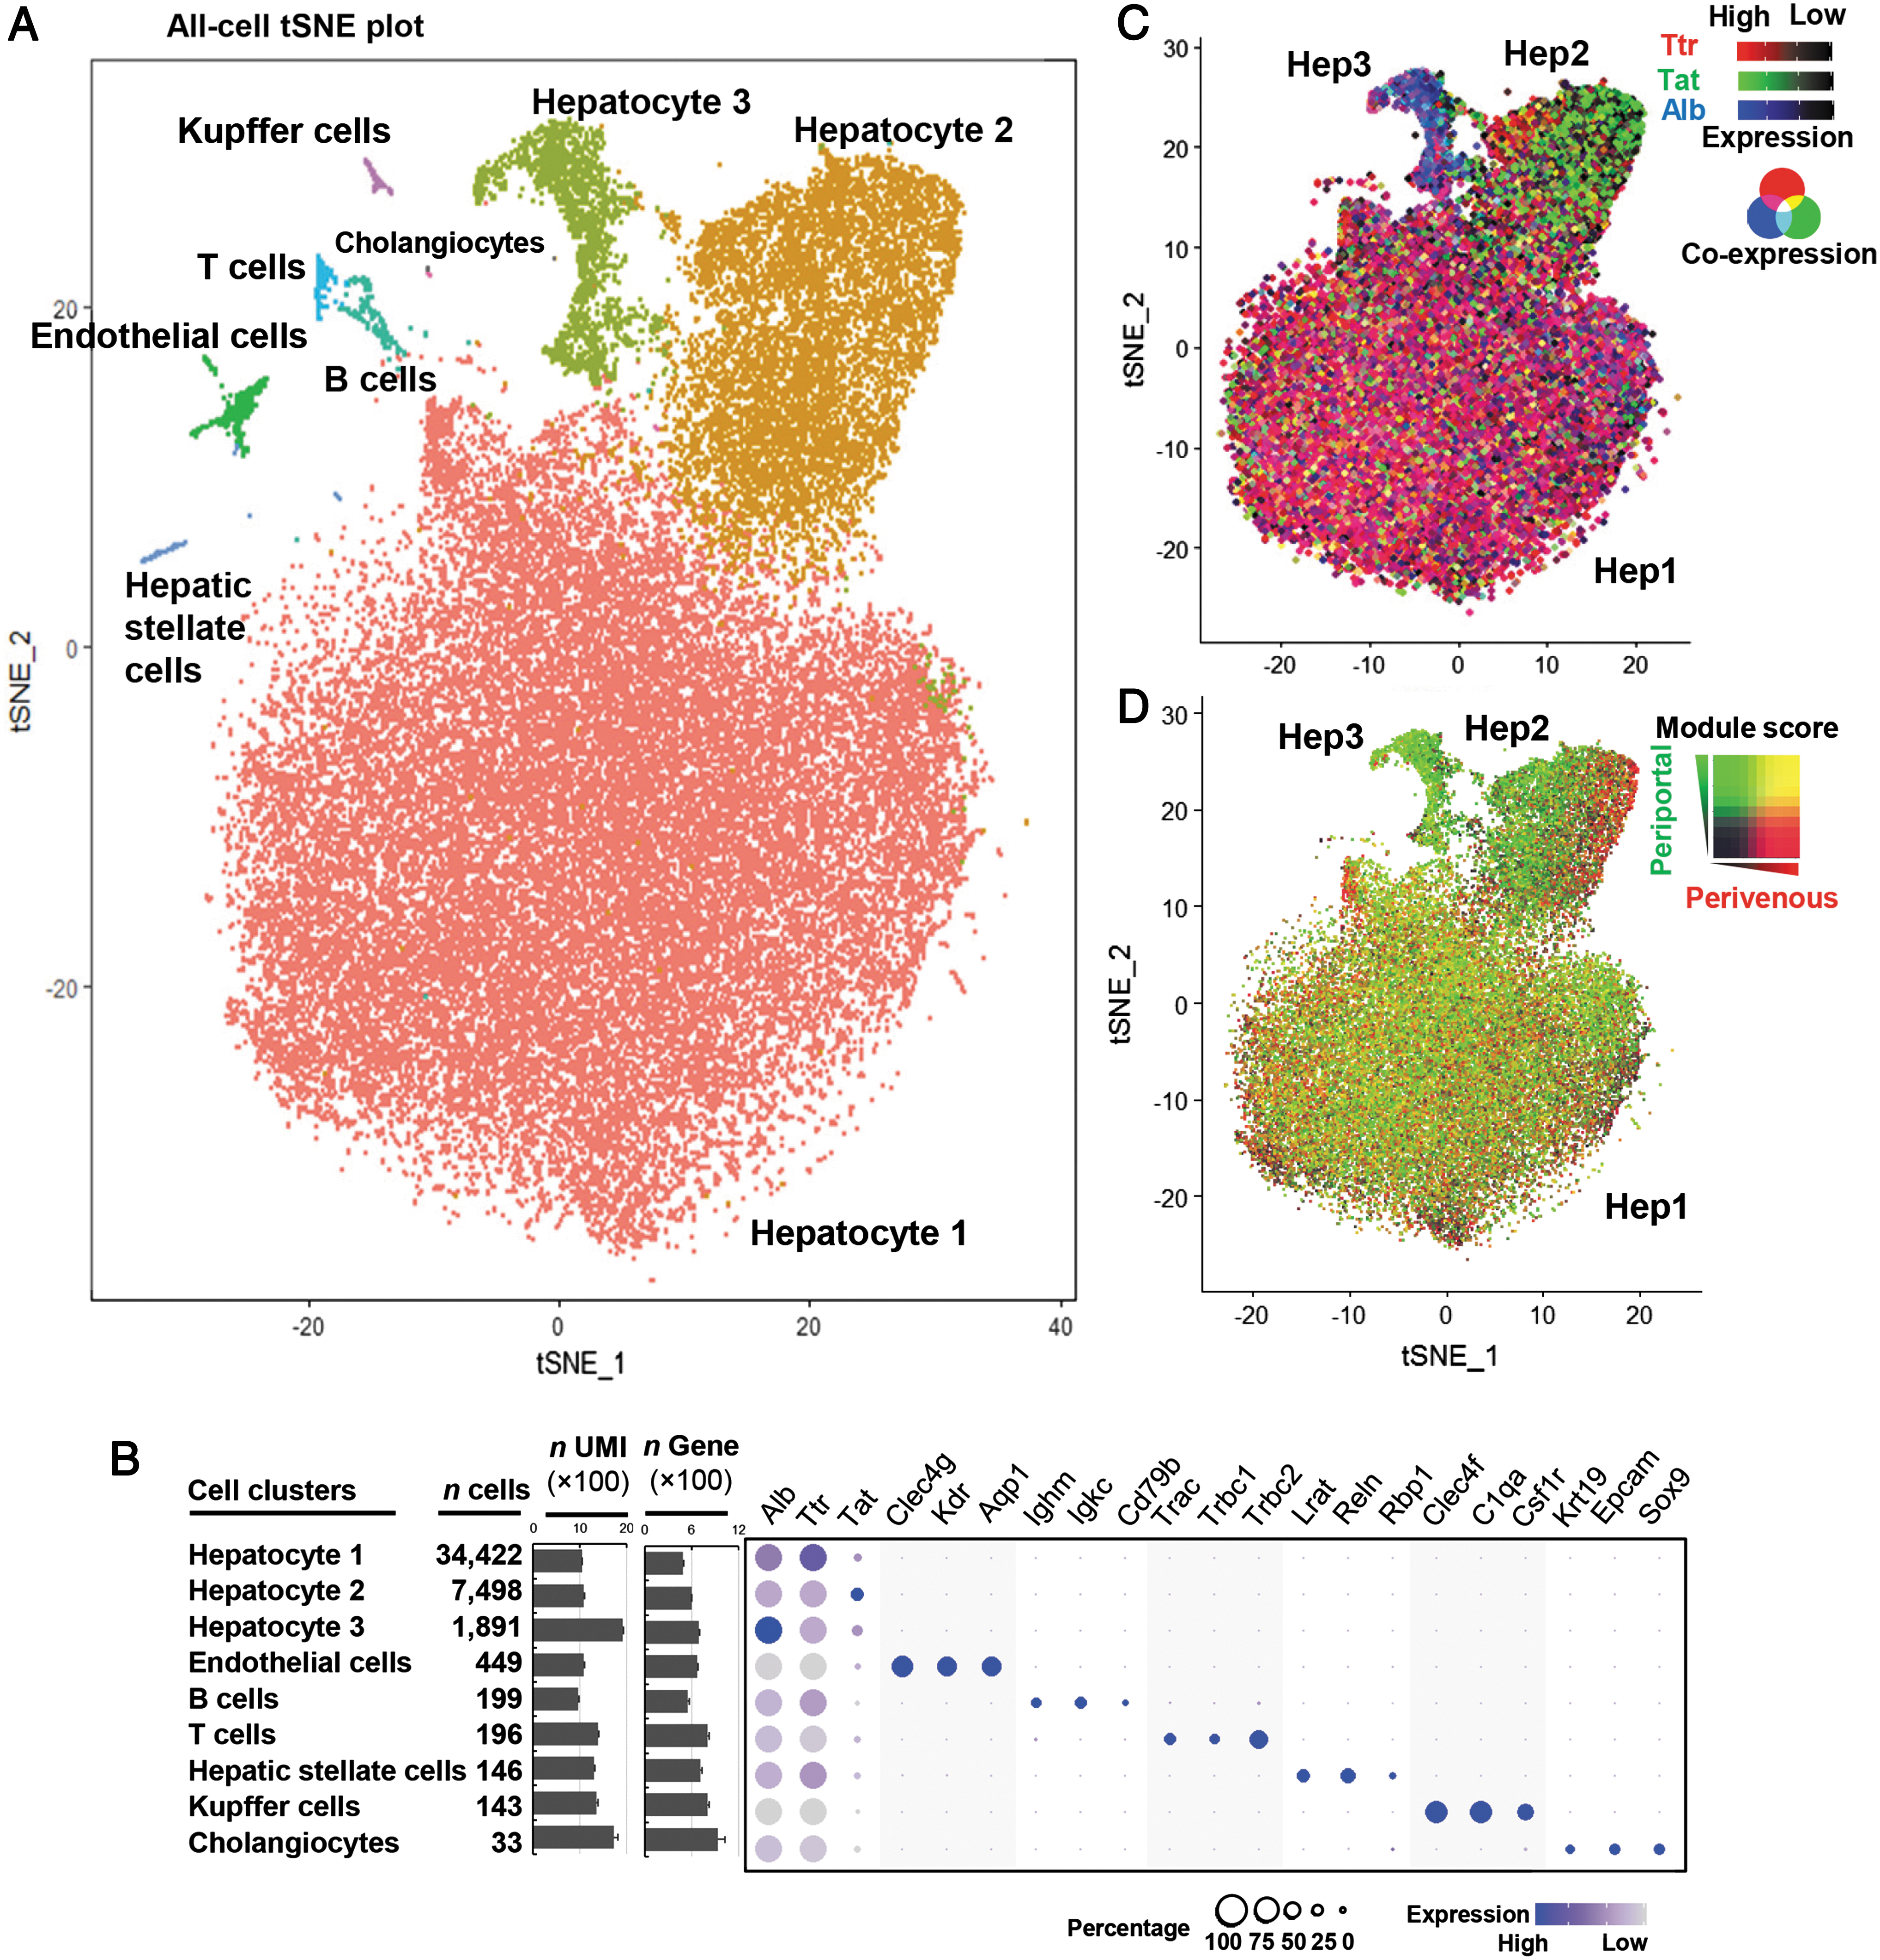
Single-cell transcriptome identification of liver cell populations.
There were three separate hepatocyte clusters, identified with known hepatocyte markers expressed heterogeneously between the clusters (Fig. 1B, C). Following the order of the cluster size, the largest cluster enriched of Ttr (encoding transthyretin) was termed “Hep1,” the second largest enriched with Tat (encoding tyrosine aminotransferase) “Hep2,” and the smallest cluster enriched in Alb (encoding albumin) “Hep3.”
Since porto-central liver zonation is a known parameter influencing hepatocyte phenotypes, 22 we examined the expression in the hepatocyte subtypes of the perivenous and periportal signature genes derived from the studies of Braeuning et al. 23 and Halpern et al. 9 The result showed that the clustering of the three subtypes was partially due to the porto-central zonation. The Hep3 cells were mostly periportal cells (Fig. 1D). The Hep2 cluster consisted of both periportal and perivenous cells, and the porto-central pattern was quite distinctive (Fig. 1D). In contrast, in the largest Hep1 cluster, cells of periportal, middle, and perivenous zones were randomly mixed (Fig. 1D).
This observation is not too surprising as the mice were randomly fed, and Wnt expression ligand levels are reported to be lower in the liver under fed state, leading to less distinctive porto-central zonation. 24 There are likely other signaling pathways that impact the hepatocyte phenotypes more strongly than Wnt signaling under the fed state.
Characterization of hepatocyte subtypes
To characterize the molecular signatures of these three hepatocyte subtypes, marker genes of each subtype were identified by comparing each subtype with other nonhepatocyte clusters, respectively (Fig. 2A). The Hep1 top marker genes were associated with α1-antitrypsin, retinol metabolism, and glutathione metabolism (Fig. 2B, D). Hep2 and Hep3 shared more marker genes (Fig. 2A), of which the most highly expressed was Mlxipl (Fig. 2C, E), encoding carbohydrate-responsive element-binding protein (CHREBP), a major blood glucose sensor that regulates pathways to convert excessive glucose into lipid in the liver in postprandial state. 25 Besides Mlxipl, the Hep2 and Hep3 cells were also enriched in expression of Insr (encoding the insulin receptor), Gcgr (encoding glucagon receptor), and Egfr (encoding epidermal growth factor receptor; Fig. 2C, E), important regulators of glucose and lipid homeostasis in the liver under dietary cycle. 26 –28
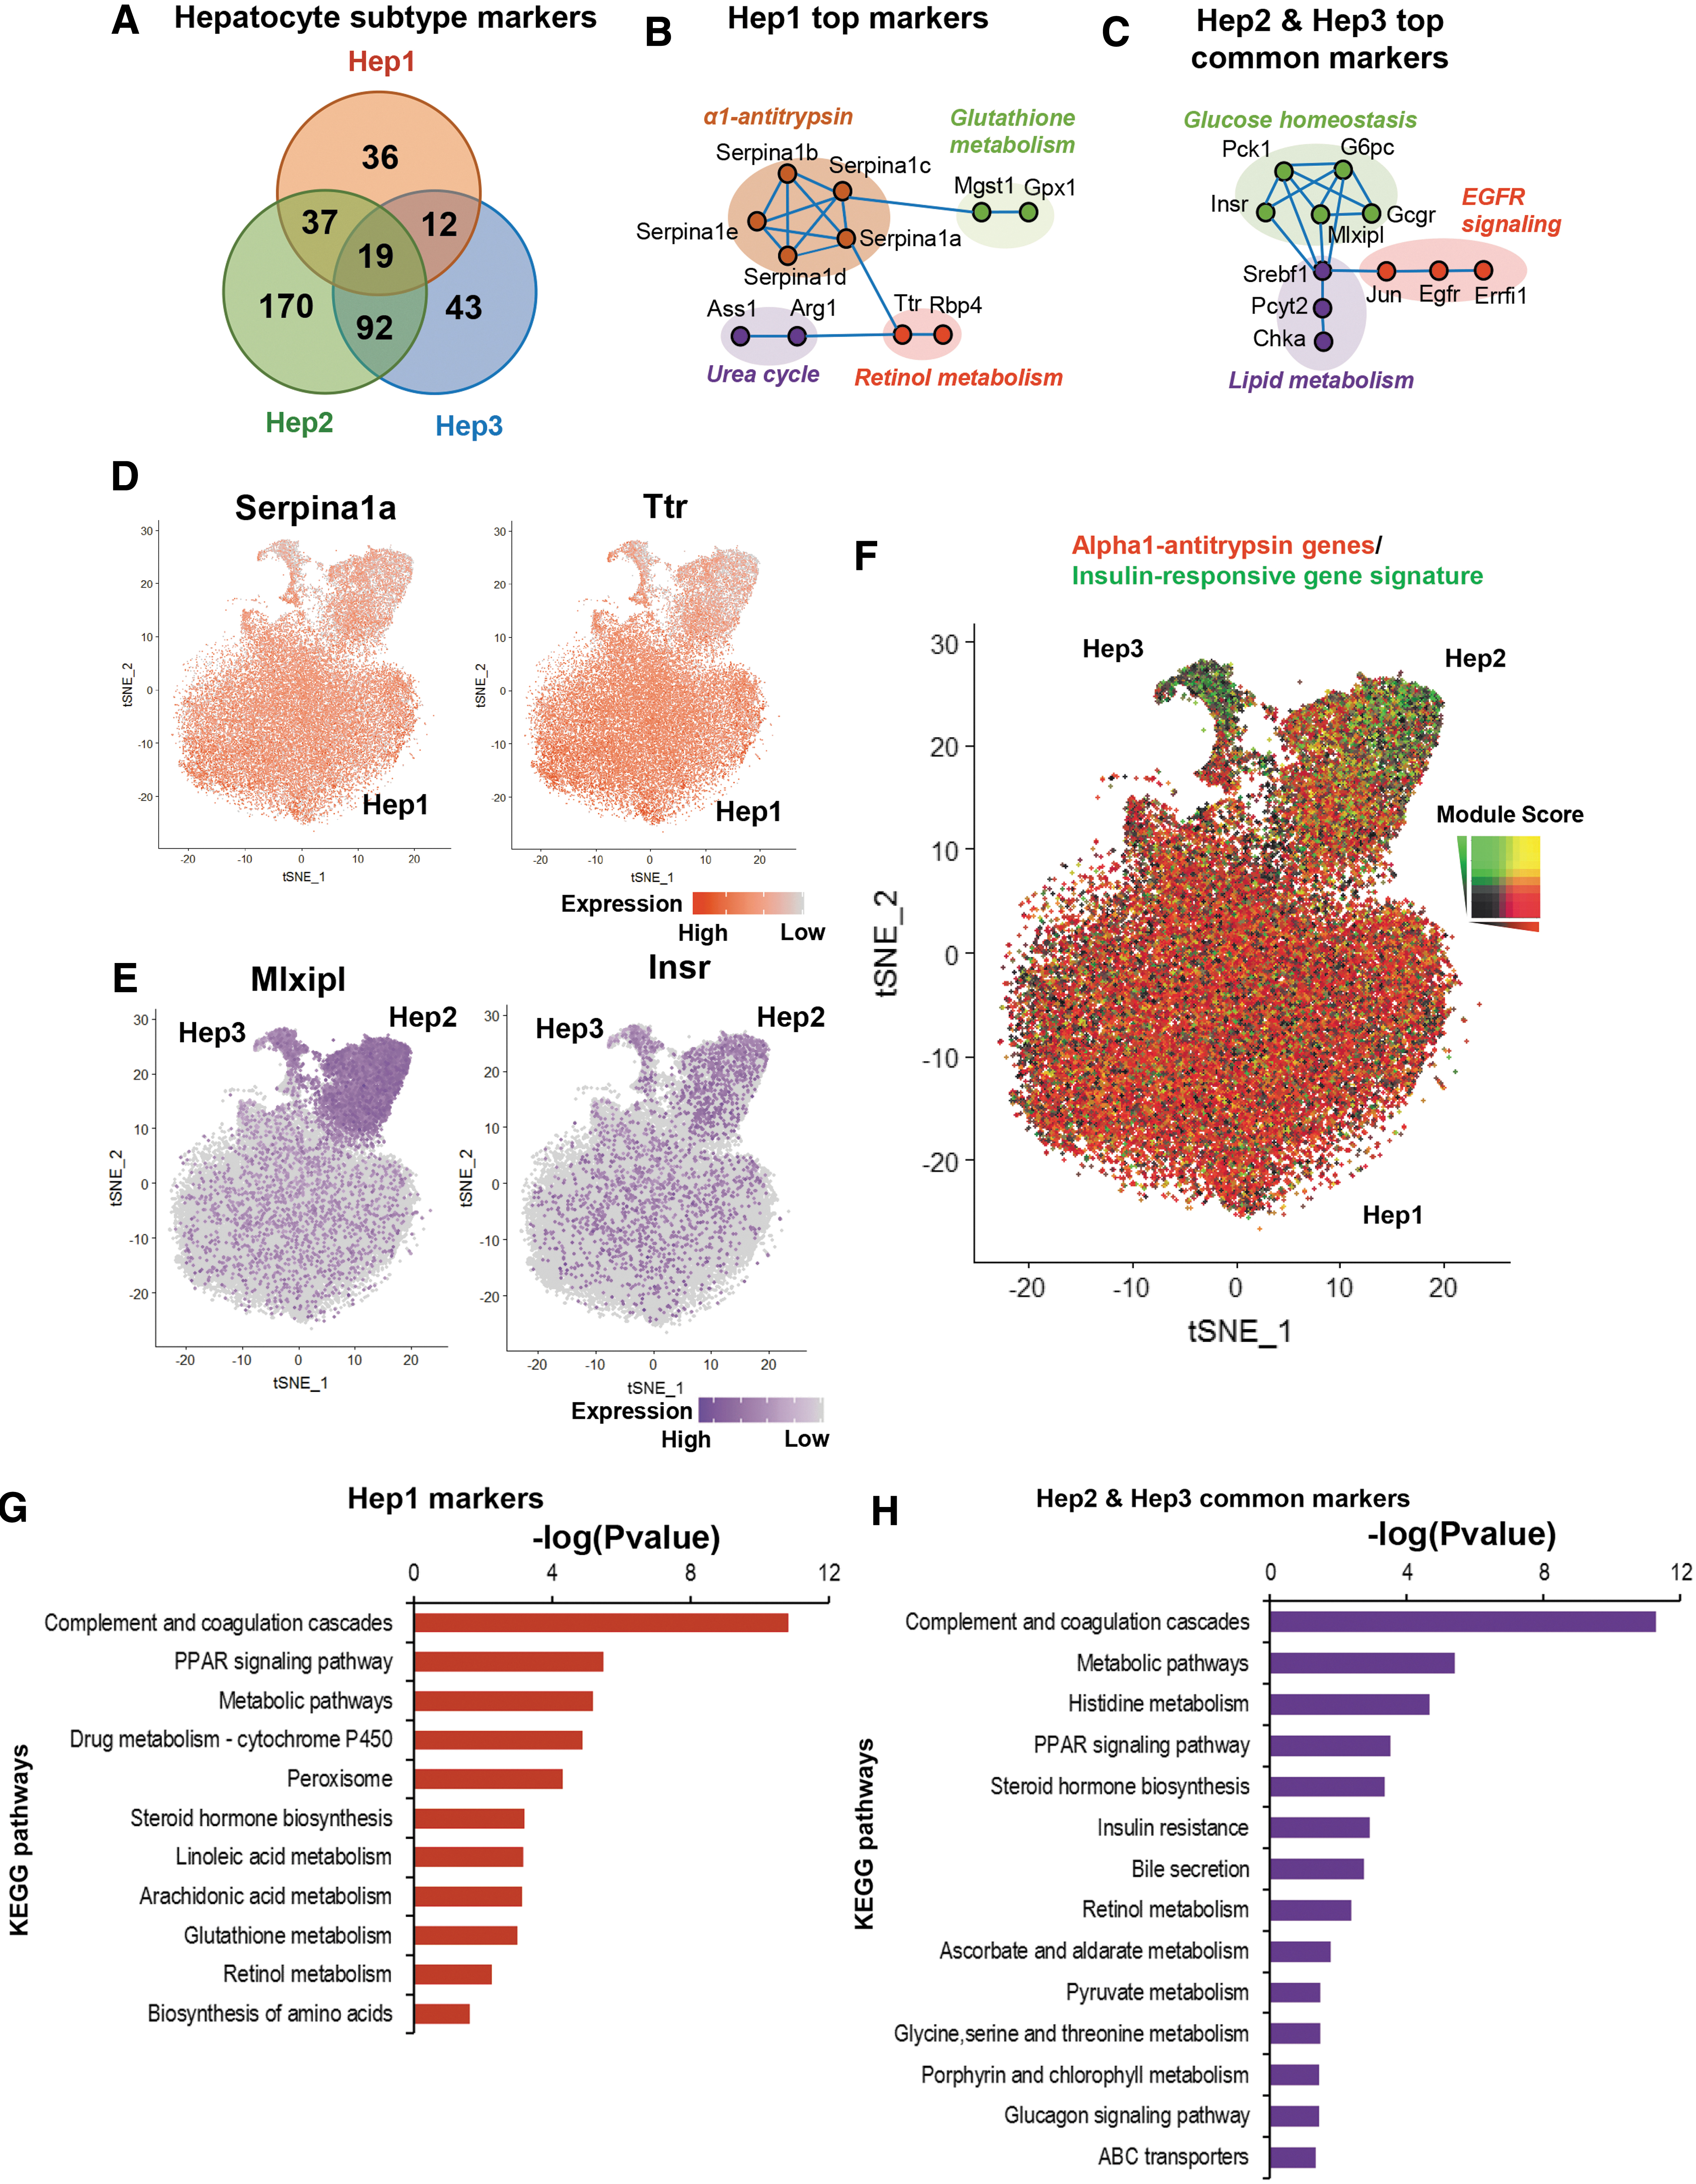
Characterization of the three hepatocyte subtypes in the PBS control mouse liver.
Interestingly, α1-antitrypsin enhances pancreatic insulin secretion by protection of β-cells. 29 The single-cell analysis demonstrated that the α1-antitrypsin genes are expressed lower in hepatocytes that are influenced by the insulin signaling (Fig. 2F), suggesting a negative feedback loop of the α1-antitrypsin expression through the insulin signaling. Kyoto Encyclopedia of Genes and Genomes (KEGG) pathway enrichment analysis showed that, compared with Hep1, the Hep2 and Hep3 common markers were specifically enriched in pathways of insulin resistance, bile secretion, pyruvate metabolism, glucagon signaling, and ABC transporters (Fig. 2G, H), important pathways to regulate glucose and lipid homeostasis in postprandial and postabsorptive states. 30
Despite the highly similar molecular signatures, Hep2 and Hep3 cells were characterized by distinct specific marker genes. For example, Hep2 cells express higher Tat, Gckr, Onecut2, and Angptl8 (Supplementary Fig. S2A), whereas Hep3 cells express higher Alb, Pigr, Cps1, and Cp (Supplementary Fig. S2B). KEGG pathway enrichment analysis showed although the marker genes of different hepatocyte subtypes were enriched in some common pathways, such as complement and coagulation cascade, PPAR signaling pathway, and metabolic pathways, each subtype also had some subtype-specific enriched metabolic pathways, suggesting division of labor (Supplementary Fig. S2C, D).
To examine whether Hep2 and Hep3 subpopulations were present in other mouse liver single-cell data sets, we reanalyzed the hepatocyte single-cell data of 1,500 hepatocytes from the fasted mouse liver study of Halpern et al. 9 Data were processed using Seurat v3 pipeline and grouped into four separate clusters by unsupervised PCA/t-SNE clustering (Supplementary Fig. S3A). As expected, the porto-central zonation gradient was very distinctive (Supplementary Fig. S3B). Among the four hepatocyte clusters, the smallest cluster expressed higher Mlxipl, Insr, and Egfr (Supplementary Fig. S3C). This cluster also shared the most common marker genes with the Hep3 cells from our data (Supplementary Figs. S3D and S4A, B), that is, there were “Hep3-like” cells. The second smallest cluster was also a Tat-enriched cluster and shared the most common marker genes with the Hep2 cells from our data (Supplementary Figs. S3E, S4C, D; “Hep2-like” cells). Taken together, it is likely that the Hep2-like and Hep3-like cells are hepatocyte subpopulations in fasted state relevant to Hep2 and Hep3 cells in normal fed state.
In summary, the results indicate that in the fed state, hepatocytes can be grouped into Ttr-enriched Hep1, Tat-enriched Hep2, and Alb-enriched Hep3 based on the transcriptional pattern. Different from the fasting state, the glucose and lipid homeostasis signaling/regulators are likely stronger factors influencing the hepatocyte phenotype diversity in normal fed state.
AAVrh.10 vector mediates expression in all hepatic cell types but at heterogeneous levels
Assessment of mCherry expression after AAVrh.10mCherry administration demonstrated that mCherry expression was not restricted to hepatocytes, but also expressed in all cell types, although at heterogeneous levels (Fig. 3A, Supplementary Table S2). Among the three hepatocyte subtypes, Hep1 had the highest expression (Fig. 3B). The density plot indicates that Hep1 cells had higher percentage of cells expressing the transgene at higher levels; the average expression level (UMI per cell) was ∼0.5 and 1-fold higher than those of Hep2 and Hep3, respectively (Supplementary Table S2). The lower transgene expression in Hep2 and Hep3 may be due to the higher expression of Egfr in these cells (Fig. 3C), as it is reported that epidermal growth factor (EGF) receptor exerts tyrosine kinase activity to reduce AAV-mediated transgene expression at multiple levels. 31 –33 Among the other nonhepatocyte cell types, hepatic stellate cells had the highest expression, but all detected liver cell types, including endothelial cells, cholangiocytes, Kupffer cells, B cells, and T cells, expressed the marker gene (Fig. 3D, E).

Cell-type–specific mCherry transgene expression.
Taken together, the data indicate that although AAV vector-mediated transgene expression in the liver is dominated by hepatocyte expression, AAV vectors mediate transgene expression in multiple cell types in the liver other than hepatocytes, with the expression levels highly heterogeneous in the different cell types.
AAVrh.10 vector-mediated transgene transfer is Hep1-tropic
To identify genes that may favor AAVrh.10-mediated transgene expression, Pearson's correlation coefficient analysis was performed on expression levels between mCherry and other endogenous genes in Hep1, Hep2, and Hep3, respectively, to identify endogenous genes that are positively correlated with the transgene expression (Fig. 4A). Interestingly, there were 10 common genes with moderate positive relationship (r > 0.4) to mCherry expression identified in all the three subpopulations, including Ttr, Mup20, Gpx1, Fabp1, Mgst1, Apoa2, Serpina1c, Serpina1b, B2m, and Serpina3k (Fig. 4B).

Correlation analysis of the mCherry transgene and endogenous gene expression.
Among these 10 genes, only Gpx1, Mgst1, and Fabp1 encode intracellular proteins, whereas the others are encoded secreted proteins. Protein–protein interaction analysis using the STRING database indicated that most of these genes have coexpression relationships in mice (Fig. 4B). Hence, the secreted proteins might not be directly relevant to the AAV-mediated transgene expression but be identified merely due to coexpression.
The intracellular proteins GPX1, MGST1, and FABP1 play a major role in reactive oxygen species (ROS) clearance. 34 –36 Moreover, GPX1 is reported to be a negative regulator of the insulin and EGF receptor signaling, which are sensitive to oxidative stress, in the liver. 37,38 In our data, the hepatocytes expressing the mCherry-correlated gene signature, including Gpx1, Mgst1, and Fabp1, barely overlapped with the hepatocytes expressing the insulin-responsive gene signature (Fig. 4C). It is likely that the antioxidant gene Gpx1 suppresses the receptor tyrosine kinase activities (i.e., insulin and EGF receptors) and reduces the resistance of AAV transduction by these receptors, thus indirectly leading to higher AAVrh.10-mediated transgene expression in these cells (Fig. 4D).
Regarding the subpopulation markers, 72.7% of the Hep1-specific markers were positively correlated with mCherry expression (r > 0.2, Fig. 4E). Only 4.9% Hep2- and Hep3-specific marker genes were positively correlated with the mCherry expression (Fig. 4F). These data suggest that the AAVrh.10 vector is mainly Hep1-tropic, and it could be considered as a preferred choice when choosing a gene delivery vehicle for a therapeutic target that is Hep1 dominant.
AAVrh.10 vector dysregulation of liver homeostasis
To investigate the potential dysregulation of mouse liver homeostasis by AAVrh.10 vector per se independent of the transgene, the transcripts of differentially expressed genes were identified between the PBS and AAVrh.10Null group. Surprisingly, 2 weeks after vector administration, 629 dysregulated genes were identified in different cell types after intravenous administration of the AAVrh.10Null vectors (Fig. 5A, Supplementary Tables S3–S11).
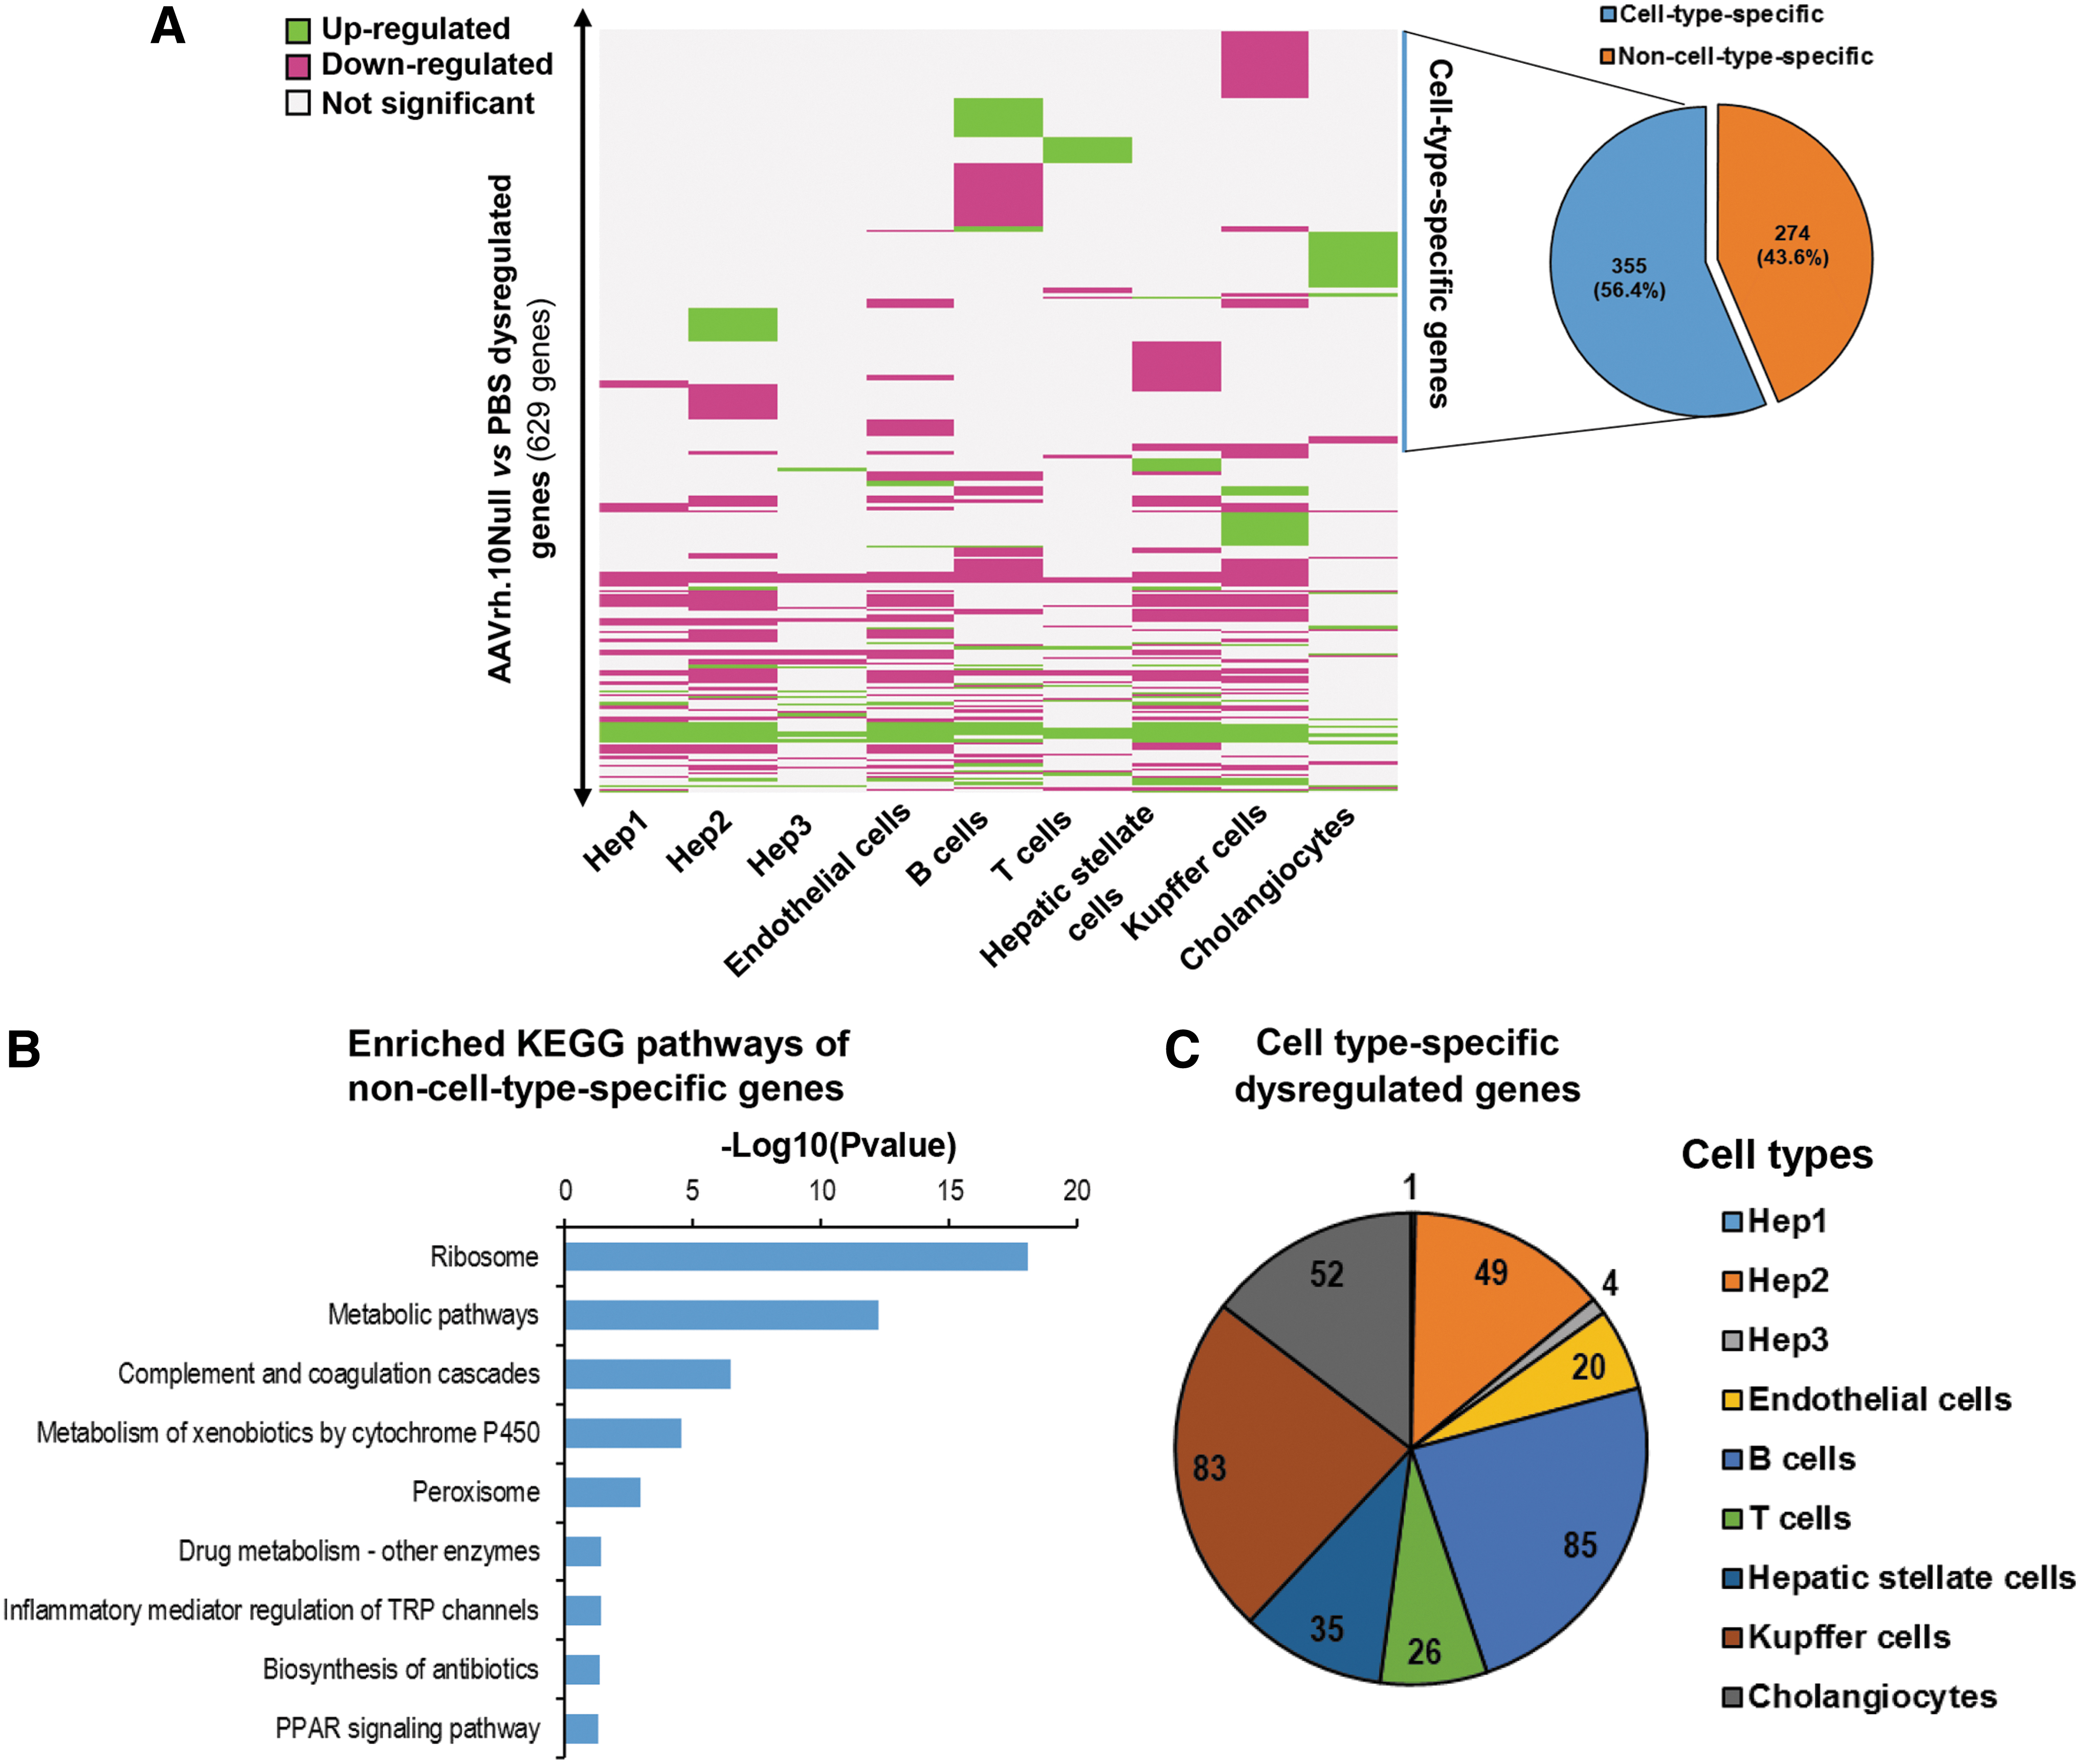
Liver cell-specific transcriptome dysregulation evoked by intravenous administration of AAV vectors.
Many of the dysregulated genes were commonly dysregulated by AAVrh.10Null transduction in multiple cell types. KEGG pathway analysis of the genes showed that they were enriched in pathways such as complement and coagulation cascade and metabolism of xenobiotics by cytochrome P450 and peroxisome, all of which were relevant to viral infection (Fig. 5B).
In contrast, many of the dysregulated genes were cell-type–specific (Fig. 5C). The B cells and Kupffer cells had the most cell-type–specific dysregulated genes (85 and 83 genes, respectively), followed by cholangiocytes (52 genes), Hep2 cells (49 genes), hepatic stellate cells (35 genes), T cells (26 genes), and endothelial cells (20 genes). Meanwhile, Hep1 and Hep3 had minimal cell-type–specific dysregulated genes. The single-cell transcriptomic analysis enables identification of cell-type–specific dysregulated genes, which is masked due to averaging effects by whole-organ sequencing.
AAVrh.10Null vectors alter transcriptional patterns in a cell-type–specific manner
In Hep2 cells, gene ontology (GO) term enrichment analysis showed that the AAVrh.10Null-induced genes enriched in complement activation, RNA splicing, lipid metabolism, and transcriptional regulation (Fig. 6A). Of interest, we noticed that hepatocyte proliferation regulators Egfr and Btg2 were altered by the AAVrh.10Null vectors (Fig. 6B). Egfr is a promoter for hepatocyte proliferation and liver regeneration, 39 whereas Btg2 inhibits hepatocyte proliferation. 40 In the PBS group, the Btg2 expression level was higher, which was consistent with the knowledge that hepatocytes are usually not proliferative. 41 However, in the AAVrh.10Null group, Btg2 was downregulated and Egfr was upregulated, implicating possible derepression of hepatocyte proliferation.
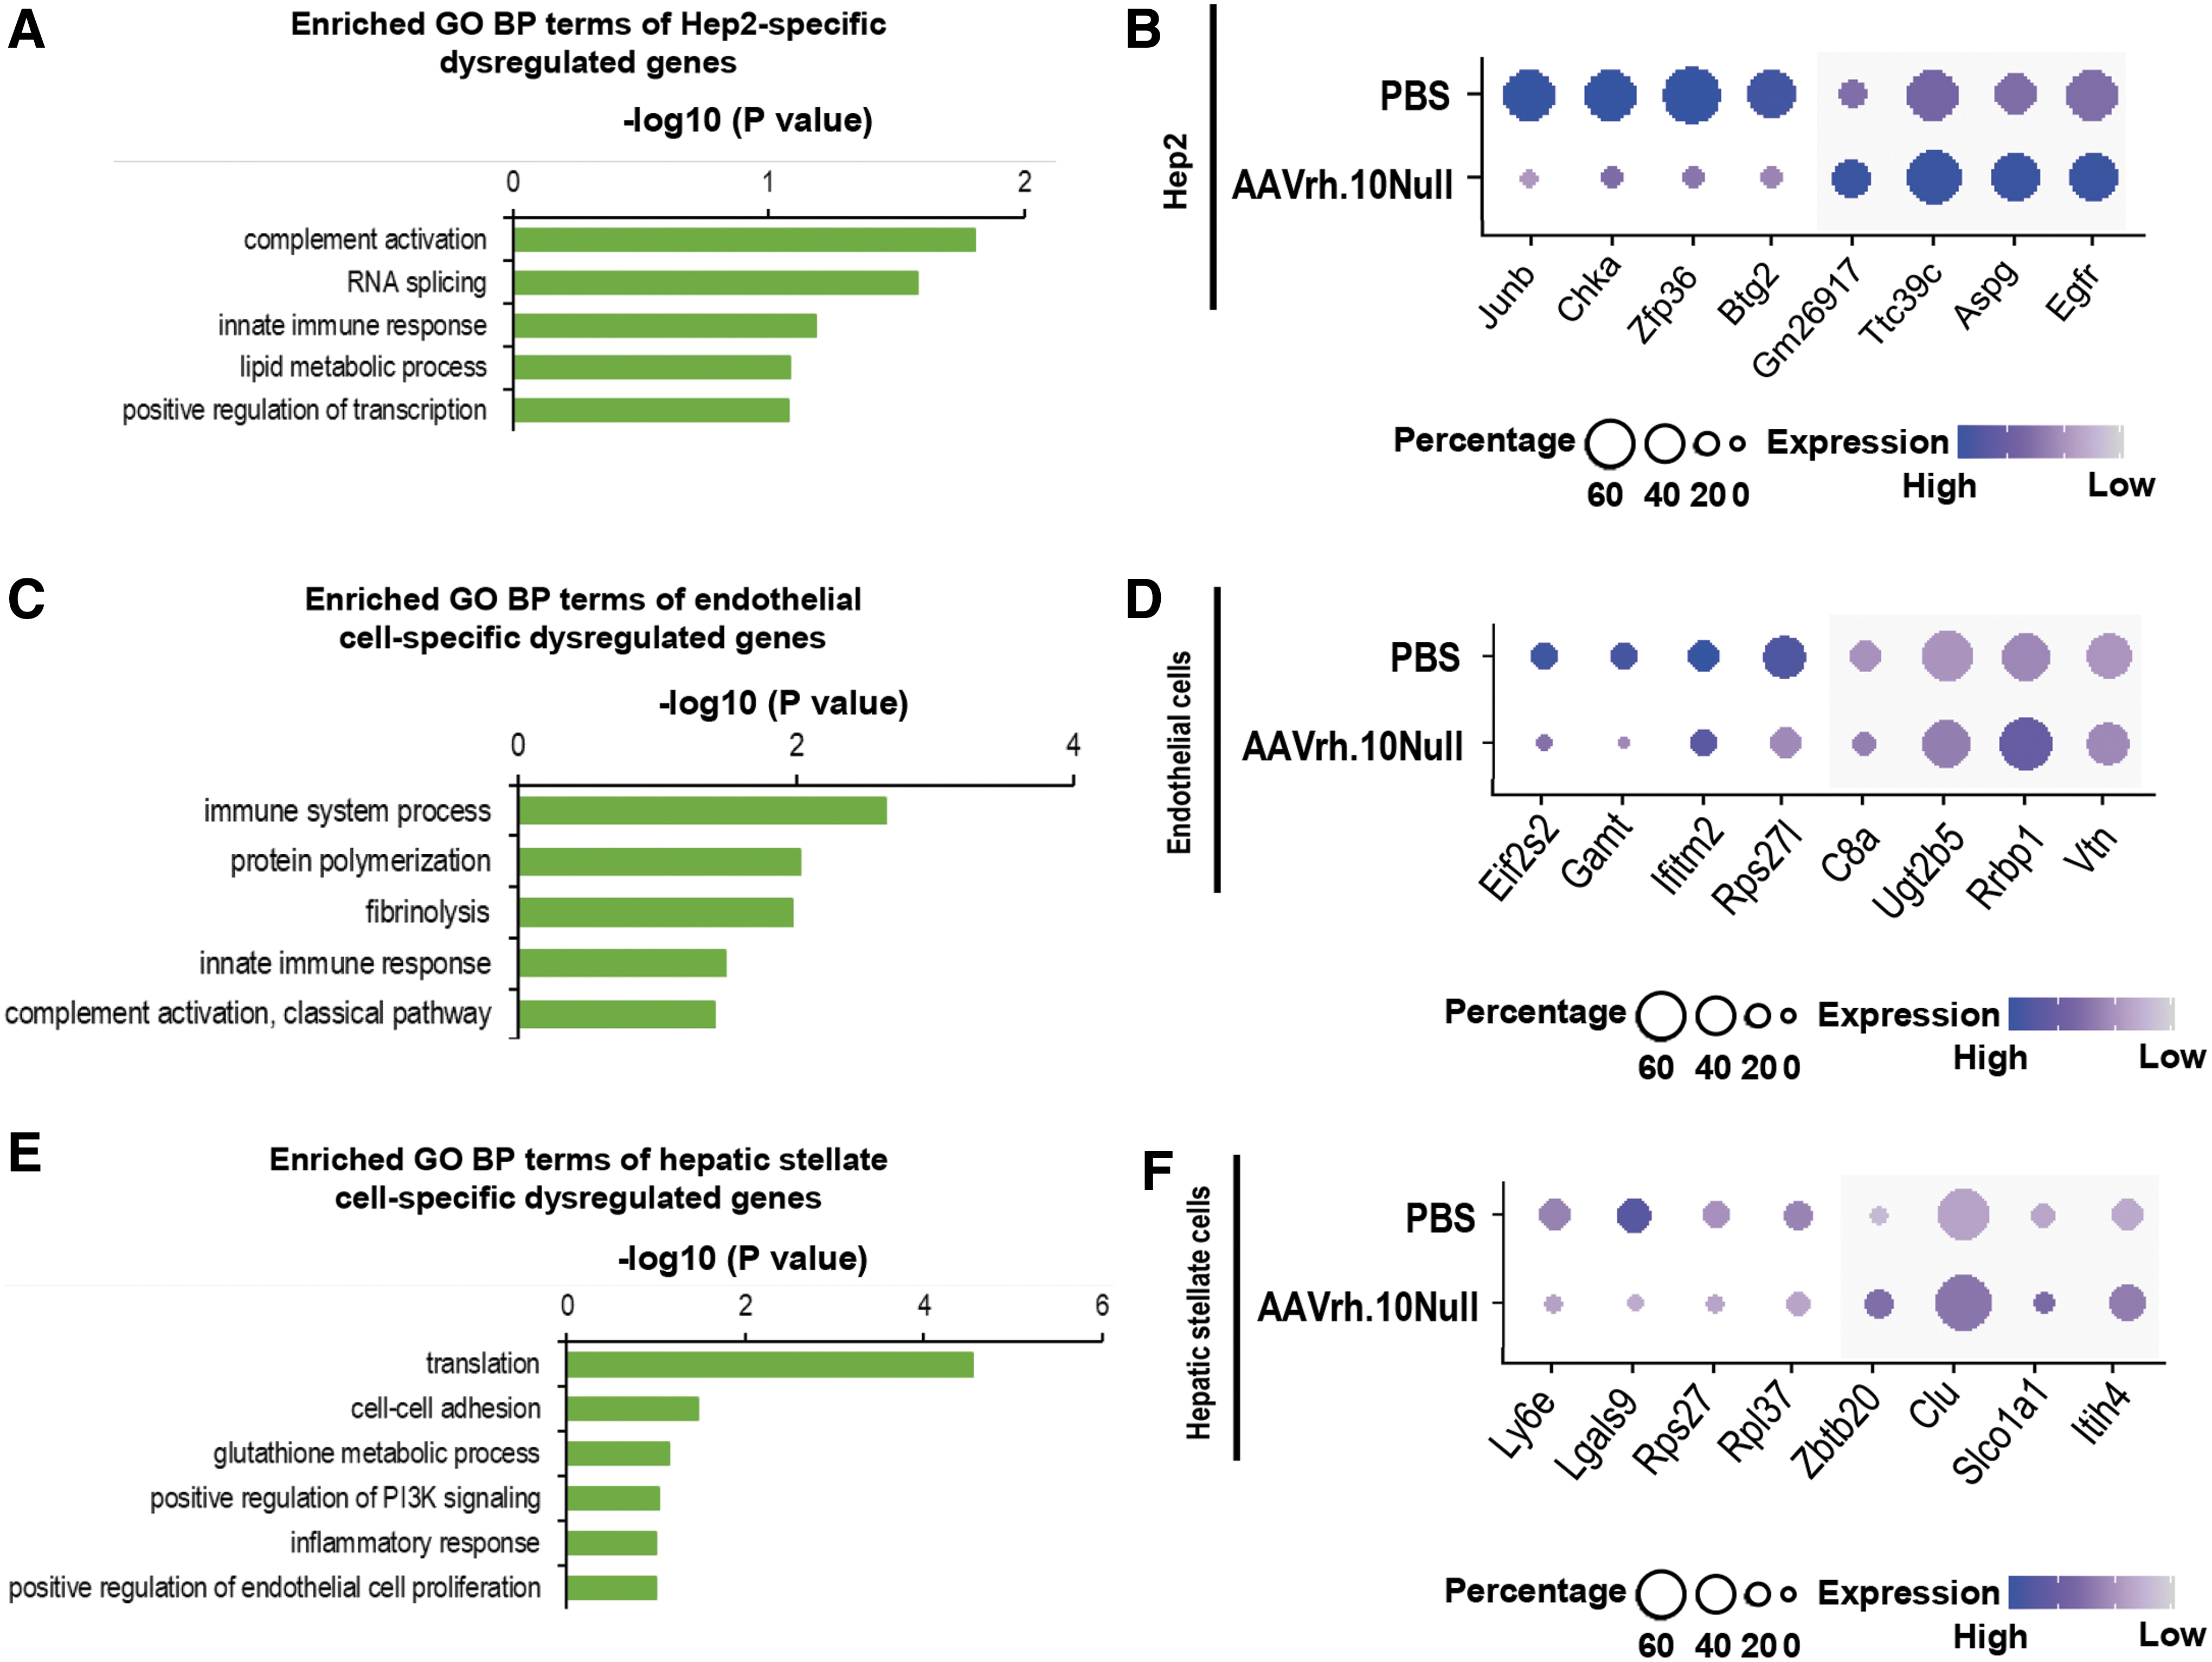
Cell-type–specific transcriptional dysregulation mediated by AAV vectors in the Hep2 cells, endothelial cells, and hepatic stellate cells.
In endothelial cells, AAVrh.10Null vectors induced genes enriched in innate immune response, protein polymerization, and fibrinolysis (Fig. 6C). The top upregulated genes included the complement components C8a and Vtn, which encode for a secreted protein vitronectin that inhibits the membrane-damaging effect of the terminal cytolytic complement pathway 42 (Fig. 6D).
In hepatic stellate cells, AAVrh.10Null vectors altered genes relevant to translation, cell–cell adhesion, glutathione metabolism, PI3K signaling, inflammatory response, and positive regulation of endothelial cell proliferation (Fig. 6E). The top stimulated genes included Clu, which encodes for a secreted protein clusterin that participates in suppression of complement-mediated cell lysis like vitronectin 42 (Fig. 6F).
Taken together, despite observation that the AAVrh.10Null vector stimulated innate immune responses in the mouse liver, the vector might also activate protective mechanism, such as derepression of hepatocyte proliferation for liver regeneration and release of proteins that counteract with the terminal complement complexes. Future studies will be necessary with additional time points and comparison with multiple immune parameters to determine the consequences of these finding to immune regulation of vector expression.
AAVrh.10Null vectors alter transcriptional patterns in multiple immune cell types
AAVrh.10Null vectors significantly altered the transcriptional patterns of the immune cells. In Kupffer cells, GO term enrichment analysis showed that the AAVrh.10Null-induced genes enriched in innate immune response, inflammatory response, neutrophil chemotaxis, hydrogen peroxide process, chemokine secretion, and angiogenesis (Fig. 7A). The top upregulated genes included receptor Csf1r and transcriptional factor Maf that promote cytokine production, 43,44 as well as Ccl6, which encodes a chemokine that stimulates inflammatory response 45 (Fig. 7B). Mif, the macrophage migration inhibitory factor, was downregulated (Fig. 7B).

Cell-type–specific transcriptional dysregulation mediated by AAV vectors in the Kupffer cells, B cells, and T cells.
In B cells, AAVrh.10Null induced genes enriched in translation, oxidation–reduction process, and B cell receptor signaling pathway (Fig. 7C). The top upregulated genes included Ifi27, which plays a role in defense response to viral infection, 46,47 Ms4a1, which plays a role in the development and differentiation of B cells into plasma cells, 48 and Cd79b, which is the B cell receptor component (Fig. 7D).
In T cells, AAVrh.10Null altered genes relevant to natural killer cell activation, oxidation–reduction process, and translation (Fig. 7E). The top activated genes included Tagln2, which regulates T cell activation by stabilizing the actin cytoskeleton at the immunological synapse 49 (Fig. 7F).
In summary, the AAVrh.10Null vector evoked significant transcriptional alteration in multiple immune cell types. These alterations likely contribute to promoting the immune cell activation and inflammatory response.
Discussion
The understanding of the biological consequences of AAV-mediated liver gene transfer is limited by an incomplete molecular characterization of the cell types transduced. In this study, by leveraging the power of single-cell sequencing, we have characterized the cell-type–specific transgene expression in the mouse liver after intravenous administration of an mCherry (marker gene) AAVrh.10 vector, as well as the cell-specific vector-mediated transcriptome dysregulation by Null (no transgene) AAVrh.10 vector.
Hepatocyte subtypes
In total, we profiled the transcriptomes of 46,500 mouse liver cells, in which 43,811 cells were hepatocytes under normally fed condition. Together with the 1,500 mouse hepatocytes assessed under starved condition from Halpern et al., 9 the data contribute to the knowledge in the dynamic subpopulations of mouse hepatocytes through the dietary cycle. Interestingly, three subtypes of hepatocytes were identified (Ttr-enriched “Hep1,” Tat-enriched “Hep2,” and Alb-enriched “Hep3”).
The Hep1 cells are the largest subpopulation, representing 85–90% of the total hepatocytes, followed by Hep2 5–10% and Hep3 ∼5%, respectively. Based on the molecular signatures, the three subtypes are separated more depending on the glucose and lipid homeostasis signaling/regulators rather than on the well-known porto-central zonation. The Hep1 cells are expressing higher levels of genes Serpina1a-e (encoding α1-antitrypsin) and Ttr (encoding transthyretin). Meanwhile the Hep2 and Hep3 cells are dominated by genes of glucose-dependent signaling/regulators, including transcriptional factors such as Mlxipl (encoding CHREBP), surface receptors such as Insr (encoding insulin receptor), and Gcgr (encoding glucagon receptor), as well as their downstream effectors such as G6pc (encoding glucose-6-phosphatase) and Pck1 (encoding phosphoenolpyruvate carboxykinase 1). The CHREBP is a major regulator to directly monitor blood glucose levels and activate glycolytic and lipogenic pathways to convert excessive glucose into lipid. 25 Although CHREBP functions independently of the insulin signaling pathway, it is reported that the CHREBP and the insulin signaling pathway have many common target genes 50 ; hence, it is not surprising that Mlxipl and Insr genes are expressed in the same hepatocyte subtypes based on transcriptional patterns. Although both the liver-produced α1-antitrypsin and transthyretin are reported to enhance pancreatic insulin secretion by protection of islet β cells at multiple levels, 29 they are expressed lower in the Hep2 and Hep3 cells, implicating a negative feedback loop.
Intriguingly, the Mlxipl +/Insr + hepatocyte subtype was also observed in the data of Halpern et al. 9 under starved condition, with a number of common top markers. Most other subtype markers are different, but it is reasonable as the Wnt signaling likely influences the transcriptional pattern more strongly in the starved condition. Taken together, these observations underline the concept that hepatocytes are influenced by many factors under different conditions and thus display highly heterogeneous transcriptional patterns.
Cell-type–specific transgene expression
We observed that mCherry expression is not restricted in hepatocytes, but also in all other cell types, at heterogeneous levels. Among the hepatocyte subtypes, the mCherry transgene expression levels were also highly heterogeneous. The Hep1 cells had the highest expression levels, meanwhile the Hep2 and Hep3 cells had much lower expression levels. The possible reason is that the Hep2 and Hep3 cells are expressing a higher level of EGF and insulin receptors.
It is reported that the EGF receptor could exert protein tyrosine kinase activity and reduce AAV transduction efficiency at multiple levels, including inhibiting viral entry by capsid phosphorylation, 31 degrading viral particle by capsid ubiquitination, 33 and limiting the AAV second viral genome DNA synthesis by FKBP52 phosphorylation, 32 leading to fewer active copies of AAV genome in the cells. The insulin receptor is also a receptor tyrosine kinase like EGF receptor. 51
Insulin is reported to enhance AAV transduction of hepatocytes both in vitro and in vivo. 51 This does not conflict with the single-cell data as the mechanism of insulin-mediated enhancement of AAV gene transfer is not clear. It is possible that insulin does not enhance AAV transduction directly through insulin signaling, or the EGF receptor exerts a stronger negative effect in our experimental setting.
We observed that the mCherry transgene expression is highly correlated with a 10-gene signature (Ttr, Serpina1b, Serpina1c, Serpina3k, Mgst1, Apoa2, Fabp1, Gpx1, Mup20, and B2m). Most of the genes encode for secreted proteins except for Gpx1, Mgst1, and Fabp1. These three genes might be truly responsible for the higher transgene expression, as the secreted proteins are not functioning within the cells. Gpx1 and Mgst1 are located in cytosol and mitochondria and function to protect cells from oxidative stress through glutathione metabolism. 35,36 FABP1 is a cytoplasmic protein functioning for fatty acid uptake and also has antioxidant activity. 34 Insulin and EGF receptor signaling are sensitive to ROS and thus negatively regulated by GPX1 through ROS clearance in the liver. 37,38 Consistent with our data, the hepatocytes expressing the mCherry-correlated gene signature, which contains Gpx1, Mgst1, and Fabp1, have little overlap with those expressing the insulin-responsive gene signature. The AAVrh.10-mediated transgene expression is positively correlated with the 10-gene signature probably due to lower receptor tyrosine kinase activities in these cells. Another possibility is the higher potency of the transgene promoter in the Hep1 cells employing a similar transcriptional machinery to the 10-gene signature.
Taken together, there are both positive and negative factors affecting AAVrh.10 vector transduction. Many of these factors are expressed in a nonrandom pattern in hepatocytes, highlighting the usefulness of single-cell sequencing techniques to identify such factors from different subpopulations and evaluate their influences on AAV vector transduction efficiency. Given that the therapeutic target is a nonrandom expressing gene in the liver, it would be optimal to choose an AAV vector serotype based on tropism toward different hepatocyte subtypes relevant to therapy.
Cell-specific vector-mediated transcriptome dysregulation
To evaluate the cell-specific transcriptional response to the AAVrh.10 vector per se, we used an AAVrh.10Null vector with transgene replaced by an intron, excluding the profound effects due to overexpression of the transgene. These results could be serotype specific or may have overlap with the transcriptional dysregulation induced by other serotypes. The data demonstrate that AAVrh.10 vectors evoked significant transcriptional dysregulation in various liver cell types that might be associated with toxicity and/or limit expression. The intravenous administration of AAVrh.10Null vectors activated common antiviral pathways, such as complement and coagulation cascade, xenobiotic metabolism by cytochrome P450, and peroxisome in most of the cell types.
In addition, there were also cell-type–specific transcriptional dysregulation in different cell types. These alterations have possible both protective and adverse effects on AAV-based gene therapy. For example, the transduction of the AAVrh.10Null vectors reduced hepatocyte proliferation inhibitor Btg2. The cell proliferation is protective for the hepatocytes but may cause vector genome dilution. As transgene overexpression is a burden of the host cell and may cause some adverse effects such as protein misfolding and even cell death, a moderate vector genome dilution might not necessarily be an adverse effect on the gene therapy outcome. Further investigation is needed to evaluate the actual effect of cell proliferation on the outcome of gene therapy. It also promoted higher production of vitronectin and clusterin in endothelial cells and hepatic stellate cells to neutralize the terminal complement complexes.
In contrast, it downregulated the negative regulator Mif and evoked the positive regulators Csf1r, Maf, and Ccl6 in Kupffer cells to activate the immune response. In B cells and T cells, activating markers were upregulated as well. These findings enabled investigators to design strategies to augment protective effects on AAV vectors and reduce immune clearance for AAV-based gene therapy.
In summary, these observations provide a large-scale single-cell resolution transcriptome atlas of young male mouse liver cells and, importantly, insights into the cell-type–specific transgene expression as well as the cell-specific dysregulation of liver cell biology after AAVrh.10-mediated liver gene transfer. Further studies are necessary to assess the extent, capsid/transgene specificity, and persistence of these AAV-evoked liver cell-specific transcriptional changes over time. However, these observations represent a cautionary note that AAV vectors can evoke significant liver cell-specific transcriptional dysregulation that may be relevant to the consequences of AAV-mediated gene therapy, beyond transgene expression per se, and the well-known anticapsid and antitransgene immune responses after intravenous AAV administration. 52 –54
Footnotes
Authors' Contributions
R.G.C. conceived and designed the experiments; D.Z., W.Z., and P.L.L. collected the samples, performed the experiments, and acquired data; D.Z. and M.R.R. analyzed data; and D.Z. and R.G.C. wrote the article.
Acknowledgments
We thank F. He and J. Xiang from the Genomics Core Facility of Weill Cornell Medical College regarding single-cell sequencing; S.M. Kaminsky, B.P. De, J.B. Rosenberg, and A. Chen, Department of Genetic Medicine, for their support in animal studies and viral vector production and characterization; and N. Mohamed for editorial support.
Author Disclosure
No competing financial interests exist.
Funding Information
These studies were supported, in part, by HL140670 and Department of Genetic Medicine, Weill Cornell Medical College.
Supplementary Material
Supplementary Figure S1
Supplementary Figure S2
Supplementary Figure S3
Supplementary Figure S4
Supplementary Table S1
Supplementary Table S2
Supplementary Table S3
Supplementary Table S4
Supplementary Table S5
Supplementary Table S6
Supplementary Table S7
Supplementary Table S8
Supplementary Table S9
Supplementary Table S10
Supplementary Table S11
References
Supplementary Material
Please find the following supplemental material available below.
For Open Access articles published under a Creative Commons License, all supplemental material carries the same license as the article it is associated with.
For non-Open Access articles published, all supplemental material carries a non-exclusive license, and permission requests for re-use of supplemental material or any part of supplemental material shall be sent directly to the copyright owner as specified in the copyright notice associated with the article.