
Abstract
Recent studies have reported the crucial role of stanniocalcin-2 (STC2) in hepatocellular carcinoma; however, its role in head and neck squamous cell carcinoma (HNSCC) remains elusive. In this study, microRNA-206 (miR-206) was predicted to target STC2 gene. The study herein aimed to elucidate the effect of miR-206 on HNSCC by targeting STC2. STC2 was highly expressed in HNSCC tissues and cells. By targeting STC2, miR-206 decreased mRNA and protein expression of STC2. Importantly, our study showed that miR-206 blocked the Akt signaling pathway by inhibiting STC2. Intriguingly, our data from in vitro and in vivo experiments suggested that miR-206 overexpression led to decreased cell proliferation and increased cell apoptosis and autophagy, as well as suppressed tumor growth; whereas, STC2 silencing reversed the effects of miR-206 inhibitor on those biological behaviors. In this study, we investigated the antioncogenic effect of miR-206 on HNSCC by targeting STC2, and highlighted miR-206/STC2 aixs as potential therapeutic targets for HNSCC.
Introduction
Head and neck squamous cell carcinoma (HNSCC) refers to the genetic heterogeneity of tumors that is produced by the squamous epithelium of the buccal cavity, oropharynx, larynx, and hypopharynx. 1 Although both human papillomavirus infection and traditional pathogenic factors (i.e., tobacco and alcohol) are known to be risk factors, however, the major factors of HNSCC remain elusive. 2 In addition, HNSCC lacks readily available diagnostic biomarkers, such as prostate-specific antigens in prostate cancer or carcinoma antigen (CA19-9) in pancreatic cancer, thus making it difficult for tumor surveillance. 3 Hence, these challenges significantly contribute to the fact that most patients with HNSCC are often diagnosed at late stage, resulting in poor prognosis. Therefore, HNSCC adversely affects the quality of patient's life and now it is becoming a global concern with an increasing number of cases worldwide. 4
Notably, stanniocalcin (STC) is a glycoprotein hormone that was originally found in fish and reported to be involved in regulating calcium and phosphate homeostasis.
5
STC2 is a homolog of STC and indicated to possess a crucial role in the development of various cancers such as ovarian cancer,
6
lung cancer,
7
and cervical cancer.
8
More importantly, Zhou et al. illustrated STC2 protein as a valuable prognostic marker for laryngeal squamous cell carcinoma.
9
Besides, preclinical studies have reported the crucial role of the Akt pathway in cell proliferation and metastasis.
10
Intriguingly, STC2 has been indicated to regulate the metastasis of HNSCC through the PI3K/Akt/Snail signaling axis. Thus, STC2 could be anticipated as a target for effective treatment of metastatic HNSCC.
11
Accumulating studies have indicated the pivotal role of abnormally expressed microRNAs (miRNAs) in the occurrence and development of HNSCC, thus suggesting that those miRNAs may act as the potential prognostic markers in HNSC.
12,13
Peculiarly, miR-206, a part of the tumor suppressor miRNA group, has reported being involved in the downregulation of tumor progression in human malignant tumors.
14
Moreover, a recent study has demonstrated the role of miR-206 in cell cycle progression in HNSCC cells by targeting HDAC6 through the PTEN/AKT/mTOR signaling pathway.
15
Intriguingly, miR-206 was predicted to target STC2 based on the bioinformatics analysis accessible at TargetScan (
Materials and Methods
Ethical statement
All the experiments were approved by the Ethics Committee of Peking University First Hospital. All patients signed the consent of the operation and signed approval to be enrolled in the research of this study. The experiments involving animals were performed according to the recommendations in the Guide for the Care and Use of Laboratory Animals of the National Institutes of Health.
Expression of STC2 gene in the cancer genome atlas database
The cancer genome atlas (TCGA) database was applied to retrieve the expression and prognosis of the STC2 gene in HNSCC.
Differentially expressed gene screening
The U.S. National Center for Biotechnology Information (NCBI) was applied as a public platform to store gene expression datasets, original sequences, and records. We found the GSE41328 and GSE12452 datasets by retrieving the HNSCC-related microarray. Thereafter, we downloaded the microarray data from the Gene Expression Omnibus (GEO) database. Besides, R language based on the Empirical Bayes method by the limma package of Bioconductor was used to select significant differentially expressed genes. Then differentially expressed genes were annotated by Annotate Package. Subsequently, we retrieved STC and obtained data, which were drawn using GraphPad prism software. p < 0.05 was considered to be statistically significant.
miRNA prediction
miRNA target prediction websites (Target Scan:
Study subjects
From June 2013 to June 2016, HNSCC tissues and adjacent normal tissue specimens were collected during routine surgery from a total of 53 patients (37 males, and 16 females), with a mean age of 59 years (ranged from 55 to 68 years) hospitalized in the Otorhinolaryngology-Head and Neck Surgery Department of Peking University First Hospital. None of the enrolled patients received chemoradiotherapy before experimentation. All the HNSCC tissues were isolated from the areas of non-liquefaction necrosis of the tumor center followed by pathological confirmation of tissues by Peking University First Hospital. After surgical procedures, all tissue samples were preserved at −80°C. The tumor-node-metastasis (TNM) staging was conducted based on the standards of American Joint Committee on Cancer (AJCC), which defined 38 patients with stage I and II tumors, and 15 patients with stage III and IV tumors; on the basis of tumor location, 18 patients were supraglottic, 28 were 5 glottic, and 7 were subglottic; 22 patients were lymph node metastasis (LNM) positive and 31 were LNM negative.
Dual-luciferase reporter gene assay
The bioinformatics prediction website (
Cell transfection
HNSCC cell line SCC25 and normal oral epithelial cell line OKF6 were provided by the Central Laboratory, Tangdu Hospital, Fourth Military Medical University (Xi'an, China). Upon 80% cell confluence, SCC25 cells were detached and seeded in six-well plates with about 0.1 million per well. The next day, cells were cultured in serum-free medium and transfected after 12 h of serum removal. SCC25 cells were classified into blank, NC, miR-206 mimic, miR-206 inhibitor, siRNA-STC2, and miR-206 inhibitor+siRNA-STC2 groups. Thereafter, cell transfection was conducted according to instructions provided by lipofectamine 2,000 (Invitrogen Life Technologies, Carlsbad, CA). A total of 5 μL aforementioned sequences or plasmid was diluted by 200 μL per well serum-free Opti-MEM and incubated at room temperature for 5 min, and 5 μL lipofectamine 2,000 was diluted by 200 μL per well serum-free Opti-MEM and incubated at room temperature for 5 min. The above two diluted solutions were mixed with equal volume and placed at room temperature for 30 min. After that, the mixture was incubated with 1 mL serum-free Opti-MEM per well at 37°C and 5% CO2. After 4–6 h, the transfection efficiency was preliminarily estimated according to the fluorescence of the NC group. The medium was replaced with conventional serum medium for further culture and subsequent experiments were conducted after 48 h.
RNA immunoprecipitation
RNA immunoprecipitation (RIP) assay was conducted according to the instructions of the Magna RIP RNA-Binding Protein Immunoprecipitation kit (Millipore, Billerica, MA). SCC25 cells were lysed by the addition of 100 μL lysate buffer containing protease inhibitor and ribonuclease inhibitor on the ice for 3 min. The supernatant was obtained by centrifugation at 12,000 rpm for 3 min at 4°C. A portion of the cell extract was taken out as an input and a portion of cell extract was co-precipitated by incubation with the antibody and 50 μL magnetic beads at 4°C overnight followed by centrifugation at 3,000 rpm at 4°C for 5 min. Antibodies for RIP included rabbit anti-human immunoglobulin G (IgG) and AGO2 (ab2850; Abcam, Cambridge, UK). The protein A/G-beads complex was washed with 1 mL of lysis buffer and centrifuged at 1,000 rpm for 1 min at 4°C followed by the addition of 15 μL of 2 × sodium dodecyl sulfate (SDS) loading buffer. The eluted samples were heated in boiling water for 10 min. Purified RNA was obtained using the TRIzol method for subsequent detection of relationship between STC2 and miR-206 by reverse transcription-quantitative PCR (RT-qPCR) assay.
Reverse transcription-quantitative PCR
Total RNA was extracted from HNSCC tissues, adjacent normal tissues, and cells, respectively, according to the instructions of the TRIzol Kit (Invitrogen, Carlsbad, CA). Then the concentration of RNA of tissues was examined. The quality and concentration of RNA were determined on the basis of the optical density (OD), respectively, at 260 and 280 nm measured by an ultraviolet spectrophotometer. The reverse transcription reagent kit (Fermentans Company) was used to produce cDNA, which was preserved at −20°C for later use. PCR was conducted using SYBR Green qPCR Mix Kit (Guangzhou Dongsheng Biotechnology Co., Ltd., Guangdong, China) in the fluorescence qPCR instrument (ABI Company, Oyster Bay, NY). Primers were designed with the primer design software Primer 5.0 and synthesized by Beijing Bioss Biotechnology Co. Ltd., Beijing, China. U6 was regarded as the internal control of the miR-206 and GAPDH was regarded as the internal control of other genes. The primers are shown in Table 1. All reactions were set up with three replicates. The relative expression of the related genes was calculated according to the 2−ΔCt method.
Primer sequence for reverse transcription-quantitative PCR
F, forward; R, reverse; miR-206, microRNA-206; STC2, stanniocalcin-2; Bax, Bcl-2-associated X; Bcl-xl, B cell lymphoma extra large; Bcl-2, B cell lymphoma 2.
Western blot analysis
The total protein extracted from the logarithmic growth period cells was directly used in the Western blot analysis. The total protein concentration was determined according to the bicinchoninic acid (BCA) protein assay kit (Beyotime Institute of Biotechnology, Shanghai, China). Then 10% SDS gel loading buffer was prepared. The mixture of extracted protein and the loading buffer was boiled at 100°C for 10 min, ice bathed, centrifuged, and equivalently added into each lane for electrophoresis by a micropipette, and then the gel protein was transferred to nitrocellulose membrane. The membrane was added with the following primary antibodies: rabbit anti-human STC2 (1:500, ab63057), mTOR (1:2,000, ab2732), p-mTOR (1:1,000, ab109268), Bax (1:10,000, ab32503), LC3 (LC3II, LC3I) (1:3,000, ab51520, Survivin (1:5,000, ab76424), Beclin1 (1:2,000, ab207612), Akt (1:500, ab8805), p-Akt (1:500, ab8933), Bcl-2 (1:1,000, ab182858), and Bcl-xl (1:1,000, ab32370) (all from Abcam). With an addition of the secondary antibody of goat anti-rabbit IgG conjugated with horseradish peroxidase (1:5,000; Beyotime Institute of Biotechnology), the membrane was oscillated and incubated at 37°C for 1 h. The membrane was immersed in the enhanced chemiluminescence reaction solution (Pierce, Waltham, MA) for 1 min with the removal of the liquid and exposed by the chemiluminescence machine (Shanghai Jing Science and Technology Co., Ltd., Shanghai, China). In this experiment, sodium dodecyl sulfate-polyacrylamide gel electrophoresis (SDS-PAGE) was carried out and the antigen-antibody reaction was conducted after the membrane was transferred. The semiquantitative gray analysis was adopted to analyze the bands through the FluorChem FC2 system (Alpha Innotech, San Leandro, CA) and the gray value of each band was calculated. The β-actin content detected using mouse anti-human β-actin antibody (ab6276, 1:5,000) was used as an internal control and the ratio of the gray value between target band and β-actin band was used as the relative expression level of the related proteins.
3-(4, 5-dimethylthiazol-2-yl)-2, 5-diphenyltetrazolium bromide assay
After 48 h of cell transfection, cells were treated with trypsin with cell density adjusted to l × l04 cells/mL (100 μL/well) and inoculated into the 96-well culture plates and continued to be cultured for 24–72 h. A total of 20 μL (5 mg/mL) 3-(4, 5-dimethylthiazol-2-yl)-2, 5-diphenyltetrazolium bromide (MTT) solution (GD-Y1317; Guduo Biotechnology Company, Shanghai, China) was added to each well for culture in the incubator for a further 3 h. After removing the supernatant, 150 μL dimethyl sulfoxide (D5879-100ML; Sigma-Aldrich Co., Ltd., St. Louis, MN) was added to each well with oscillation to get the crystals dissolved and mixed. The enzyme-linked immunosorbent assay (ELISA) was used to measure the OD value at 490 nm. With the blank culture medium adjusted to zero, the OD values were obtained, and the growth curve of cells in each group was drawn. Each experiment was repeated thrice.
Flow cytometry
HNSCC cells in the logarithmic growth phase were selected. The cell culture solution (containing cells that were suspended and apoptotic or necrotic) was absorbed into the centrifuge tubes placed as the spare. The adherent cells were washed once with phosphate-buffered saline (PBS) and then detached with a moderate 0.25% trypsin solution. Cells were incubated at room temperature and observed under the microscope. When the close link between cells began to disappear and the contour of cells became round, the trypsin solution was immediately removed to avoid the overdigestion of cells. Thereafter, the cells were added with cell culture medium and gently triturated into cell suspension. Afterward, the cell suspension was transferred to the centrifuge tubes for centrifugation at 1,000 r/min for 5 min followed by removal of the supernatant. Then the pellets were collected, resuspended with 1 mL PBS, and the cells were counted. About 100 thousand resuspended cells were centrifuged in a centrifugal machine at 1,000 r/min for 5 min, after which the supernatants were discarded and the cells were collected. Based on the instructions of the Annexin-V-FITC apoptosis detection kit (Seven Sea Futai Biotechnology Co., Ltd., Shanghai, China), cells were resuspended with the addition of 195 μL Annexin V-FITC binding buffer. Thereafter, another 5 μL Annexin V-FITC was added, cells were mixed gently, wrapped with the tin foil to avoid light at room temperature, incubated for 15 min, and then centrifuged at 1,000 r/min for 5 min, after which the supernatant was discarded. With the addition of 190 μL Annexin 43 V-FITC binding buffer for cell suspension and 10 μL propidium iodide (PI) staining liquid, cells were gently mixed and placed under ice bath 5 min in dark. Finally, cell apoptosis was detected by FACS Calibur flow cytometer (BD, San Jose, CA) within 30 min.
Immunofluorescence assay
Cells in the logarithmic growth phase were collected and detached for 1 min by 0.25% trypsin, which was terminated by using Dulbecco's minimum essential medium (DMEM) containing 10% fetal bovine serum. Cells were resuspended after centrifugation to make cell suspension of 5 × 10⁴ cells/mL concentration. Afterward, the 0.8 mL cell suspension was added to each well of six-well plates containing cell slides pretreated with lysine followed by the addition of culture medium to make the final volume up to 2 mL in each well after 1 h. The cells were cultured for another 2 h. Then, the serum-free medium supplemented with different concentrations of alcohol (0, 50, 100, 200, and 400 mM) was added to cells, respectively, followed by incubation at room temperature for 2 h, and then washed with PBS thrice, fixed with 1 mL 4% paraformaldehyde, and incubated at 4°C overnight. Afterward, cells were washed once by precooling PBS at 4°C and incubated with 0.5% Triton X-100 in PBS at room temperature for 5 min. Then the cells were blocked by using 5% nonfat milk powder at room temperature for 1 h. Finally, cells were added with the LC3 (LC3II and LC3I) antibody (1:3,000) and incubated at 4°C overnight. After overnight incubation, cells were further incubated at room temperature for 1 h with Alexa Fluor 488-labeled donkey anti-rabbit secondary antibodies (1:3,000, ab 150073; Abcam), followed by washing. Then the cell nucleus was stained using Hoechst33342 staining, mounted with fluorescence quenching agent, and observed under the fluorescence microscope.
Xenograft tumor in nude mice
A total of 36, 4-week-old, specific pathogen-free (SPF) BALB/C(nu/nu) nude mice weighing ∼22 g (half male and half male, provided by Beijing Vital River Laboratory Animal Technology) were randomly assigned into six groups. The mice were provided with free access to food and water in the SPF bacteria-free room. The HNSCC cell groups in the logarithmic proliferative stage after transfection were classified into the blank group, the NC group, the miR-206 mimic group, the miR-206 inhibitor group, the siRNA-STC2 group, and the miR-206 inhibitor+siRNA-STC2 group. A total of 200 μL cell suspension (1 × 10⁷ cells/mL) in each group was inoculated into the subcutaneous part of the right axilla of mice. Subsequently, the mice were fed in the same environment and observed once every 7 d to record the length and width of the tumor. The tumor volume was calculated based on the following formula: volume = length × width 2 /2. On the 35th day, the mice were neck dislocated and the tumor was dissected, while three tumors were collected in each group.
Statistical analysis
Statistical analyses on the study were performed using the SPSS 21.0 statistical software (IBM Corp., Armonk, NY). Measurement data were presented as the mean ± standard deviation. Paired data in compliance with normal distribution and homogeneity between the two groups were compared using a paired t-test, while unpaired data were compared using the unpaired t-test. Comparisons among multiple groups were conducted by one-way analysis of variance (ANOVA) with Tukey's post hoc test. Data at different time points were compared by repeated-measures ANOVA followed by Bonferroni post hoc test. The survival rate was calculated by the Kaplan-Meier method. The enumeration data were expressed in [case (%)], examined by the chi-square test. A value of p < 0.05 was considered to be statistically significant.
Results and Discussion
STC2 is highly expressed in HNSCC and associated with prognosis of patients with HNSCC
A recent study has reported the crucial role of STC2 in the survival of hepatocellular carcinoma. 16 Moreover, STC2 plays a carcinogenic role in various types of human cancers, for instance, STC2 has been reported to be upregulated in hepatocellular carcinoma and promotes cell proliferation and migration. 17 In the present study, the STC2 gene was selected as a candidate research gene and we therefore aimed to elucidate the role and clinical significance of STC2 in HNSCC. Intriguingly, our data from in vitro and in vivo experiments illustrated that STC2 overexpression inhibited cell apoptosis, promoted cell proliferation, migration, and invasion, and arrested cells in G1/S phase. However, silencing of STC2 inhibited these activities, thus suggesting that targeted therapy against STC2 could be a novel strategy to effectively treat patients with HNSCC.
Herein, the expression and prognostic expression of STC2 gene in HNSCC were retrieved in TCGA database (Fig. 1A, B), and our results showed that STC2 was highly expressed in HNSCC, and the expression of STC2 was associated with prognosis of patients (p < 0.05). RT-qPCR and Western blot analyses were adopted to determine the expression of STC2 in HNSCC tissues. The results displayed STC2 high expression in HNSCC tissues (Fig. 1C–E). In addition, RT-qPCR was employed to detect the expression of STC2 in the SCC25 cell line. Our results revealed that STC2 was highly expressed in the SCC25 cell line compared with the normal oral epithelial cell line OKF6 (Fig. 1F).

High STC2 expression in HNSCC tissues and cells and its significance in the prognosis of miRNA regulation.
STC2 is targeted and downregulated by miR-206
To study the upstream of the differentially expressed gene STC2, STC2 miRNAs were predicted through bioinformatics websites (Target Scan:

miR-206 directly targets and downregulates STC2.
The relationship between the relative expression of microRNA-206 and the clinicopathological characteristics of head and neck squamous cell carcinoma patients
Value over the mean value referred to high expression of miR-206, while value under the mean value referred to low expression of miR-206 (the data were all measured by chi-square test).
HNSCC, head and neck squamous cell carcinoma; miR-206, microRNA-206; TNM, tumor-node-metastasis.
Based on the bioinformatics website, we observed a specific binding region between the STC2 gene sequence and miR-206 sequence (Fig. 2D). The dual-luciferase reporter gene assay verified that STC2 was the target gene of miR-206. Our results in Fig. 2E showed that the luciferase activity of the STC2-WT-3′-UTR in the miR-206 mimic group was lower than that in the NC group (p < 0.05). However, no significant difference was observed in the luciferase activity of STC2 MUT-3′-UTR (p > 0.05), thus indicating that miR-206 could bind to the STC2 gene. Furthermore, the enrichment of SCT2 by miR-206 was examined by RIP assay. Our results exhibited a significant enhanced enrichment of miR-206 in cells overexpressing STC2 (p < 0.05; Fig. 2F). Afterward, miR-206 mimic was transfected into the SCC25 cell line and the expression of miR-206 and STC2 was determined by RT-qPCR assay. Importantly, our results revealed that the expression of STC2 was significantly decreased after overexpression of miR-206 (Fig. 2G). Hence, the above-described results indicated that miR-206 targeted and inhibited STC2.
miR-206 inhibits phosphorylation and activation of the Akt signaling pathway through suppression of STC2
Furthermore, our data indicated that STC2 enhanced the phosphorylation of AKT and facilitated the metastasis of HNSCC through Snail-mediated increase in vimentin and reduction in E-cadherin. 11 Therefore, we speculated that STC2 regulated the HNSCC cell migration through the PI3K/AKT/Snail signaling axis. In addition, previously reported data have confirmed that STC2 promotes the CRC tumorigenesis and EMT by activating ERK/MEK and PI3K/AKT signaling pathways. Besides, STC2 protein has been indicated as a potential tumor biomarker for CRC diagnosis and prognosis. 18 To further validate our results, the expression of Akt signaling pathway-associated proteins in HNSCC and adjacent tissues was examined by Western blot analysis. Our results revealed that compared with adjacent tissues, no significant difference was observed in total protein expression of Akt and mTOR, whereas protein expression of p-Akt and p-mTOR was significantly elevated (all p < 0.05; Fig. 3A, B).

miR-206 downregulates STC2 to inhibit the activation of Akt signaling pathway.
Thereafter, the expression of miR-206 and STC2 in transfected HNSCC cells was measured by the RT-qPCR assay. The results (Fig. 3C) demonstrated no significant difference between the blank group and NC group (p > 0.05). Compared with the blank and NC groups, protein expression of STC2, p-Akt, and p-mTOR was significantly reduced in the miR-206 mimic or siRNA-STC2 group (both p < 0.05), but significantly elevated in the miR-206 inhibitor group. Besides, no significant difference was observed in the miR-206 inhibitor+siRNA-STC2 group relative to the blank and NC groups (p > 0.05). Moreover, Western blot analysis was conducted to determine the expression of proteins related to the Akt signaling pathway; our results (Fig. 3D, E) exhibited no significant difference between the blank group and the NC group (p > 0.05). Intriguingly, compared with the blank and NC groups, in the miR-206 mimic group and the siRNA-STC2 group, protein expression of STC2, Akt, and mTOR was decreased, while in the miR-206 inhibitor group, it was elevated (all p < 0.05). However, the protein expression of STC2, Akt, and mTOR exhibited no statistical significance in the miR-206 inhibitor+siRNA-STC2 group in comparison with blank and NC groups (all p > 0.05). Collectively, these results demonstrated that miR-206 downregulated the STC2 to restrain phosphorylation and activation of the Akt signaling pathway.
Overexpression of miR-206 downregulates STC2 to inhibit proliferation of HNSCC cells
After the cell transfection in each group, the viability of cells was detected by MTT assay at 24, 48, and 72 h, respectively. The results showed that there was no significant difference in the viability of HNSCC cells at the 24th hour (p > 0.05). However, compared with the NC and blank groups, the miR-206 mimic group and the siRNA-STC2 group exhibited significantly declined cell viability at the 48th and 72nd hours, respectively (all p < 0.05), while the miR-206 inhibitor group exhibited significantly higher cell viability (p < 0.05). No difference was observed in the cell viability of the miR-206 inhibitor+siRNA-STC2 group versus the NC and blank groups (p > 0.05; Fig. 4A). Expression of proliferation markers, including proliferating cell nuclear antigen (PCNA) and Ki-67, was evaluated by Western blot analysis. Compared with the NC and blank groups, the expression of PCNA and Ki-67 in the miR-206 mimic or siRNA-STC2 group was significantly diminished at the 72nd hour (both p < 0.05); however, it was significantly increased in the miR-206 inhibitor group (both p < 0.05). Moreover, no significant difference in the expression of PCNA and Ki-67 was observed in the miR-206 inhibitor+siRNA-STC2 group versus the NC and blank groups (Fig. 4B). Taken together, these results indicated that overexpression of miR-206 contributed to reducing the proliferation of HNSCC cells by targeting STC2.
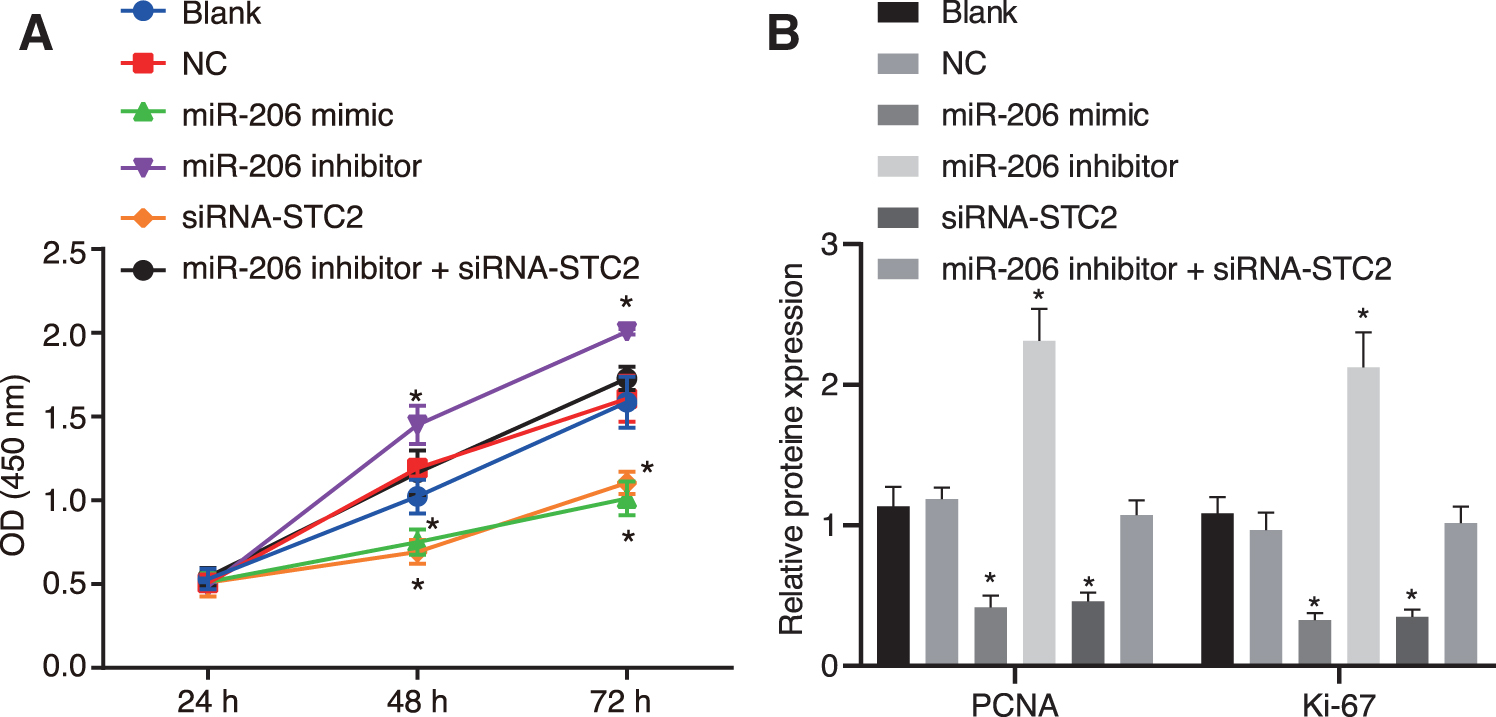
miR-206 inhibits HNSCC cell proliferation by inhibiting the expression of STC2.
Upregulation of miR-206 downregulates STC2 to promote cell apoptosis of HNSCC cells
Thereafter, the mRNA and protein expression of apoptosis-related genes in HNSCC and adjacent tissues were determined by the RT-qPCR and Western blot analysis. Intriguingly, our results (Fig. 5A, B) showed that the mRNA and protein expression of BAX was significantly decreased, whereas the mRNA and protein expression of Survivin, Bcl-2, and Bcl-xl were significantly elevated in HNSCC tissues in comparison with adjacent tissues (p < 0.05).
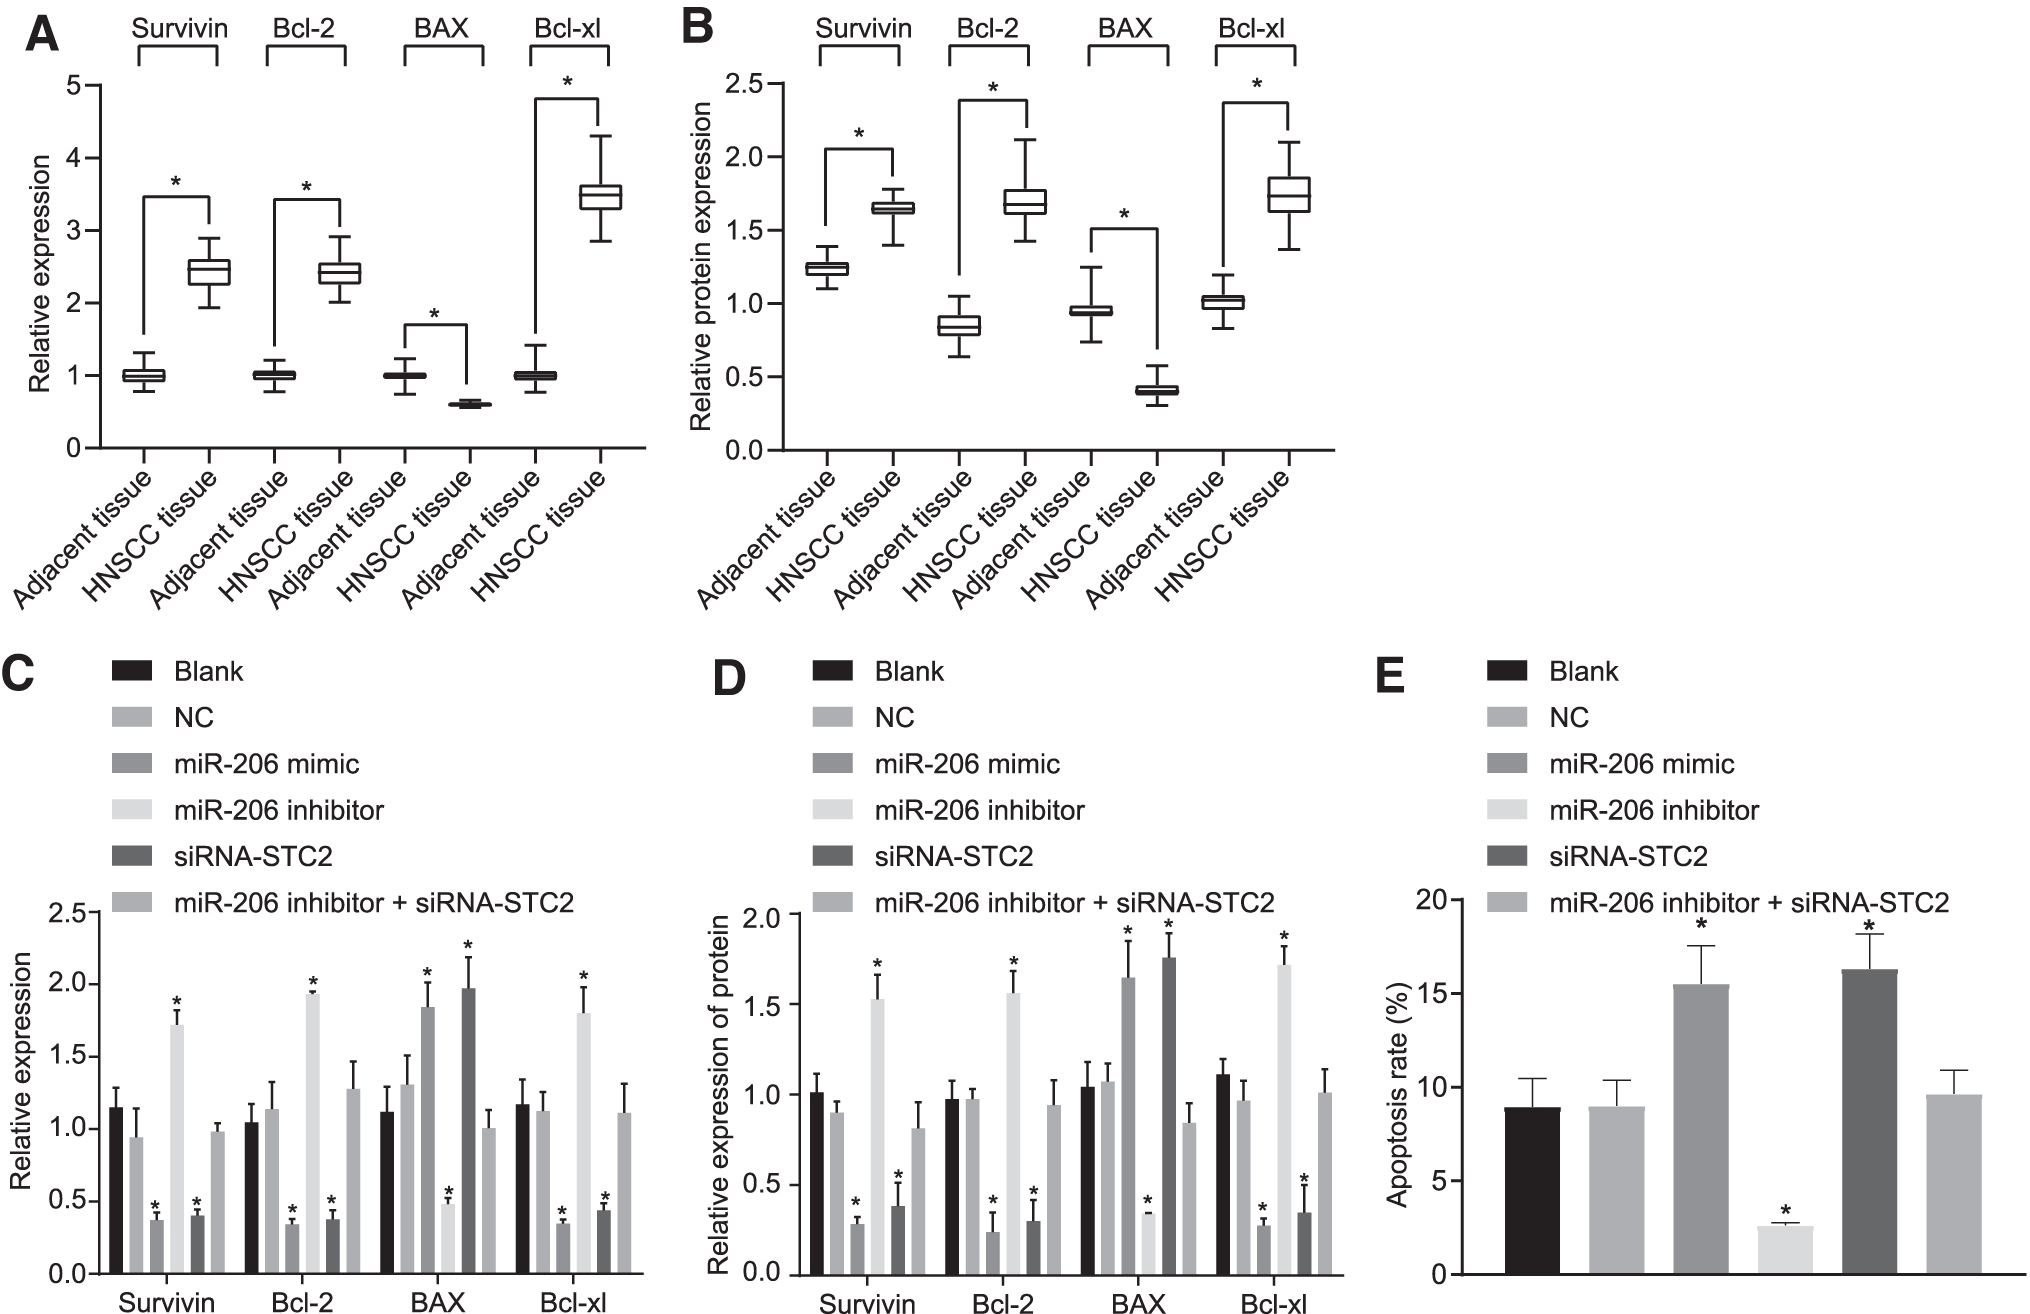
Upregulation of miR-206 promoted the apoptosis of HNSCC cells through downregulation of STC2.
After transfection, the apoptosis of the cells was assessed by RT-qPCR (Fig. 5C), Western blot analysis (Fig. 5D), and flow cytometry (Fig. 5E), respectively. No significant difference was observed in the apoptotic rate between the blank group and the NC group (p > 0.05). Compared with the blank and NC groups, the mRNA and protein expression of Bax were remarkably increased in the miR-206 mimic group and the siRNA-STC2 group, while the expression of survivin, Bcl-2, and Bcl-xl was significantly decreased (all p < 0.05), corresponding to significantly increased apoptotic rate (p < 0.05); on the contrary, Bax expression was reduced, while expression of survivin, Bcl-2, and Bcl-xl was elevated, accompanied with reduced apoptotic rate in the miR-206 inhibitor group. Moreover, we found that the apoptotic rate of the miR-206 inhibitor+siRNA-STC2 group was not significantly different from that of the blank group and the NC group (p > 0.05). The aforementioned findings suggested that the upregulation of miR-206 could promote the apoptosis of HNSCC cells through inhibition of STC2.
Overexpression of miR-206 downregulates STC2 to promote autophagy in HNSCC cells
Furthermore, Western blot analysis was applied to determine the expression of autophagy-related proteins in HNSCC and adjacent tissues. The results (Fig. 6A) indicated that the protein expression of Beclin1 in HNSCC tissues was significantly reduced in comparison with adjacent tissues, accompanied by a decreased protein ratio of LC3II/LC3I (all p < 0.05).
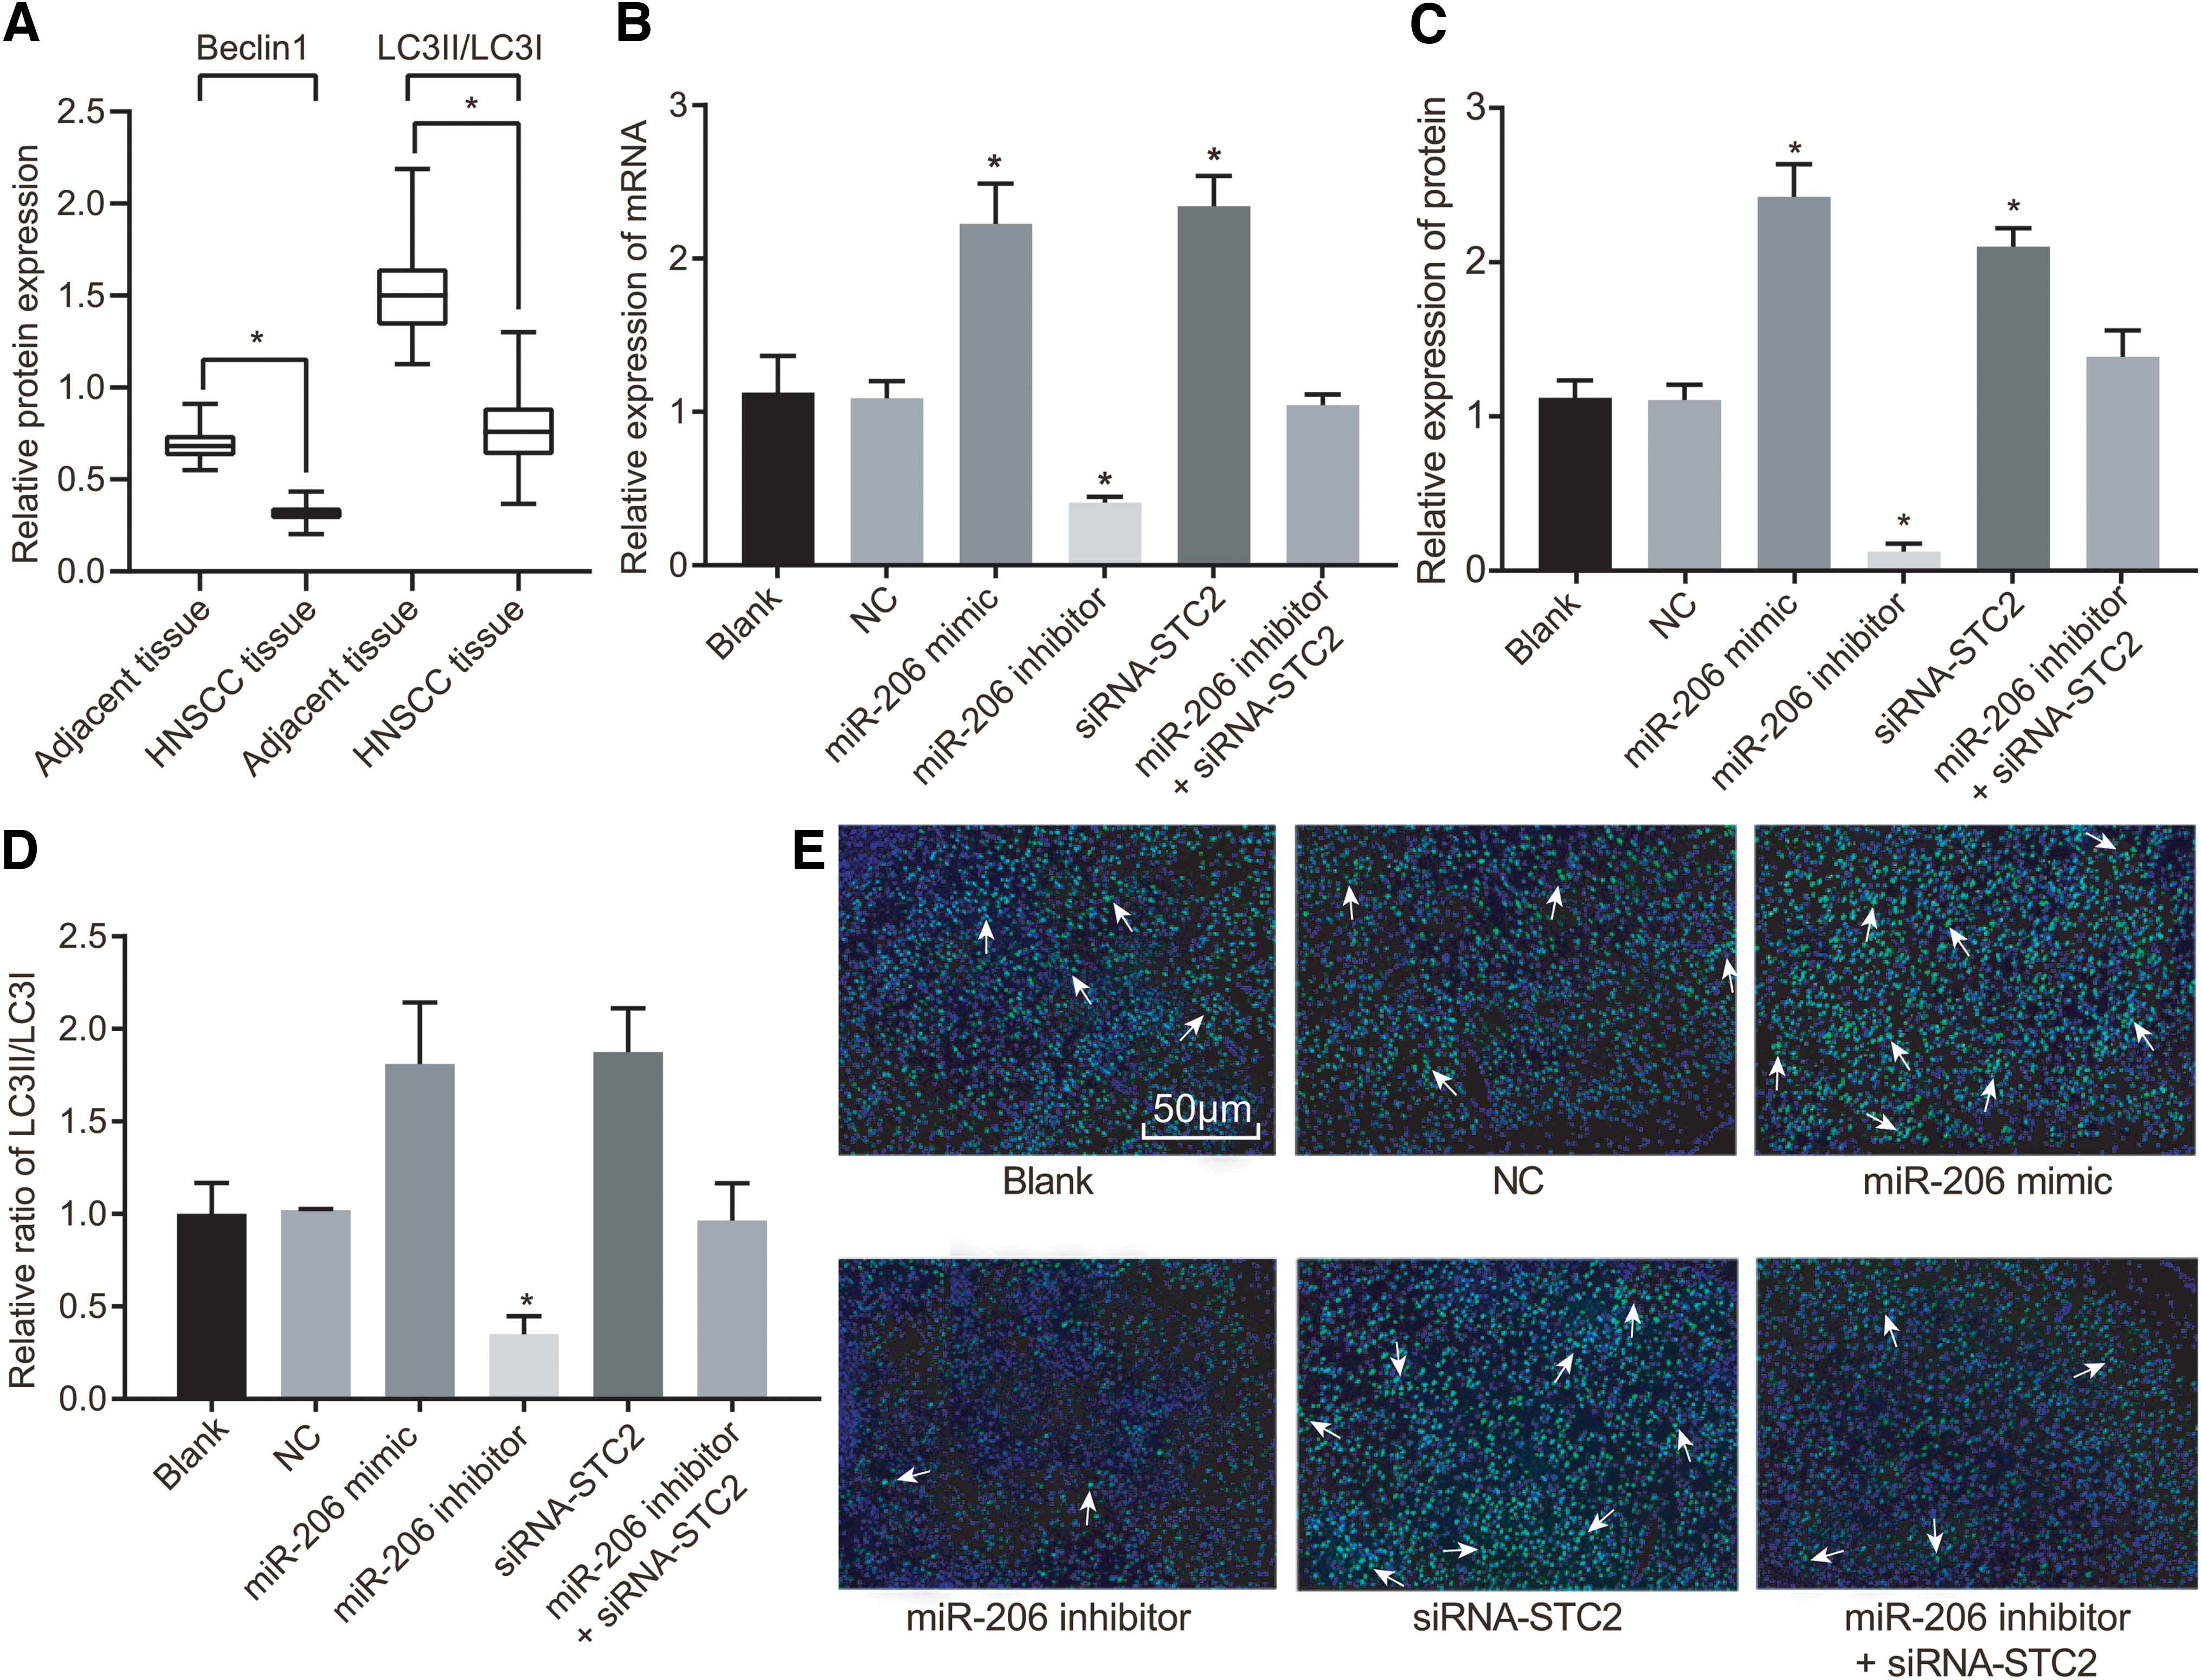
Upregulation of miR-206 or downregulation of STC2 inhibited autophagy in HNSCC cells.
After transfection, the expression of autophagy marker Beclin1 and the ratio of LC3II/LC3I were detected by RT-qPCR (Fig. 6B), Western blot analysis (Fig. 6C, D), and immunofluorescence assay (Fig. 6E). Importantly, the ratio of LC3II/LC3I was directly correlated with autophagy, exhibiting that, the higher the ratio of LC3II/LC3I, the greater the degree of autophagy would be. Moreover, our results showed that in the blank and NC groups, no significant change was observed in green fluorescent spots, mRNA, and protein expression of Beclin1, as well as the ratio of LC3II/LC3I (all p > 0.05). Compared with the blank group and NC group, the number of green fluorescent spots, the mRNA and protein expression of Beclin1, and the ratio of LC3II/LC3I were increased markedly in the miR-206 mimic group and siRNA-STC2 group (all p < 0.05), suggesting enhanced autophagy capacity, which was suppressed in the miR-206 inhibitor group (p < 0.05). However, no significant difference regarding autophagy was observed among the miR-206 inhibitor+siRNA-STC2, blank, and NC groups (p > 0.05). Collectively, these results suggested that the upregulation of miR-206 could promote autophagy in HNSCC cells through the downregulation of STC2.
miR-206 overexpression downregulates the STC2 to inhibit tumor growth of nude mice with HNSCC
Xenograft tumor model in nude mice was developed to compare the growth rate and volume of tumors (Fig. 7A, B). Our results exhibited no significant difference in the subcutaneous tumor size between 7 and 14 days in the blank group and the NC group (p > 0.05), respectively. After 21 days, the subcutaneous tumors in the miR-206 inhibitor group were significantly larger than those in the blank group and the NC group, whereas the fastest growth rate of tumors was observed (all p < 0.05). Moreover, we found that the growth rate and tumor size of subcutaneous tumors in the miR-206 mimic group and the siRNA-STC2 group were significantly reduced versus those in the blank group and the NC group (all p < 0.05). However, no significant difference was detected in subcutaneous tumor size between the miR-206 inhibitor+siRNA-STC2 group compared to the blank group and NC group (all p > 0.05).
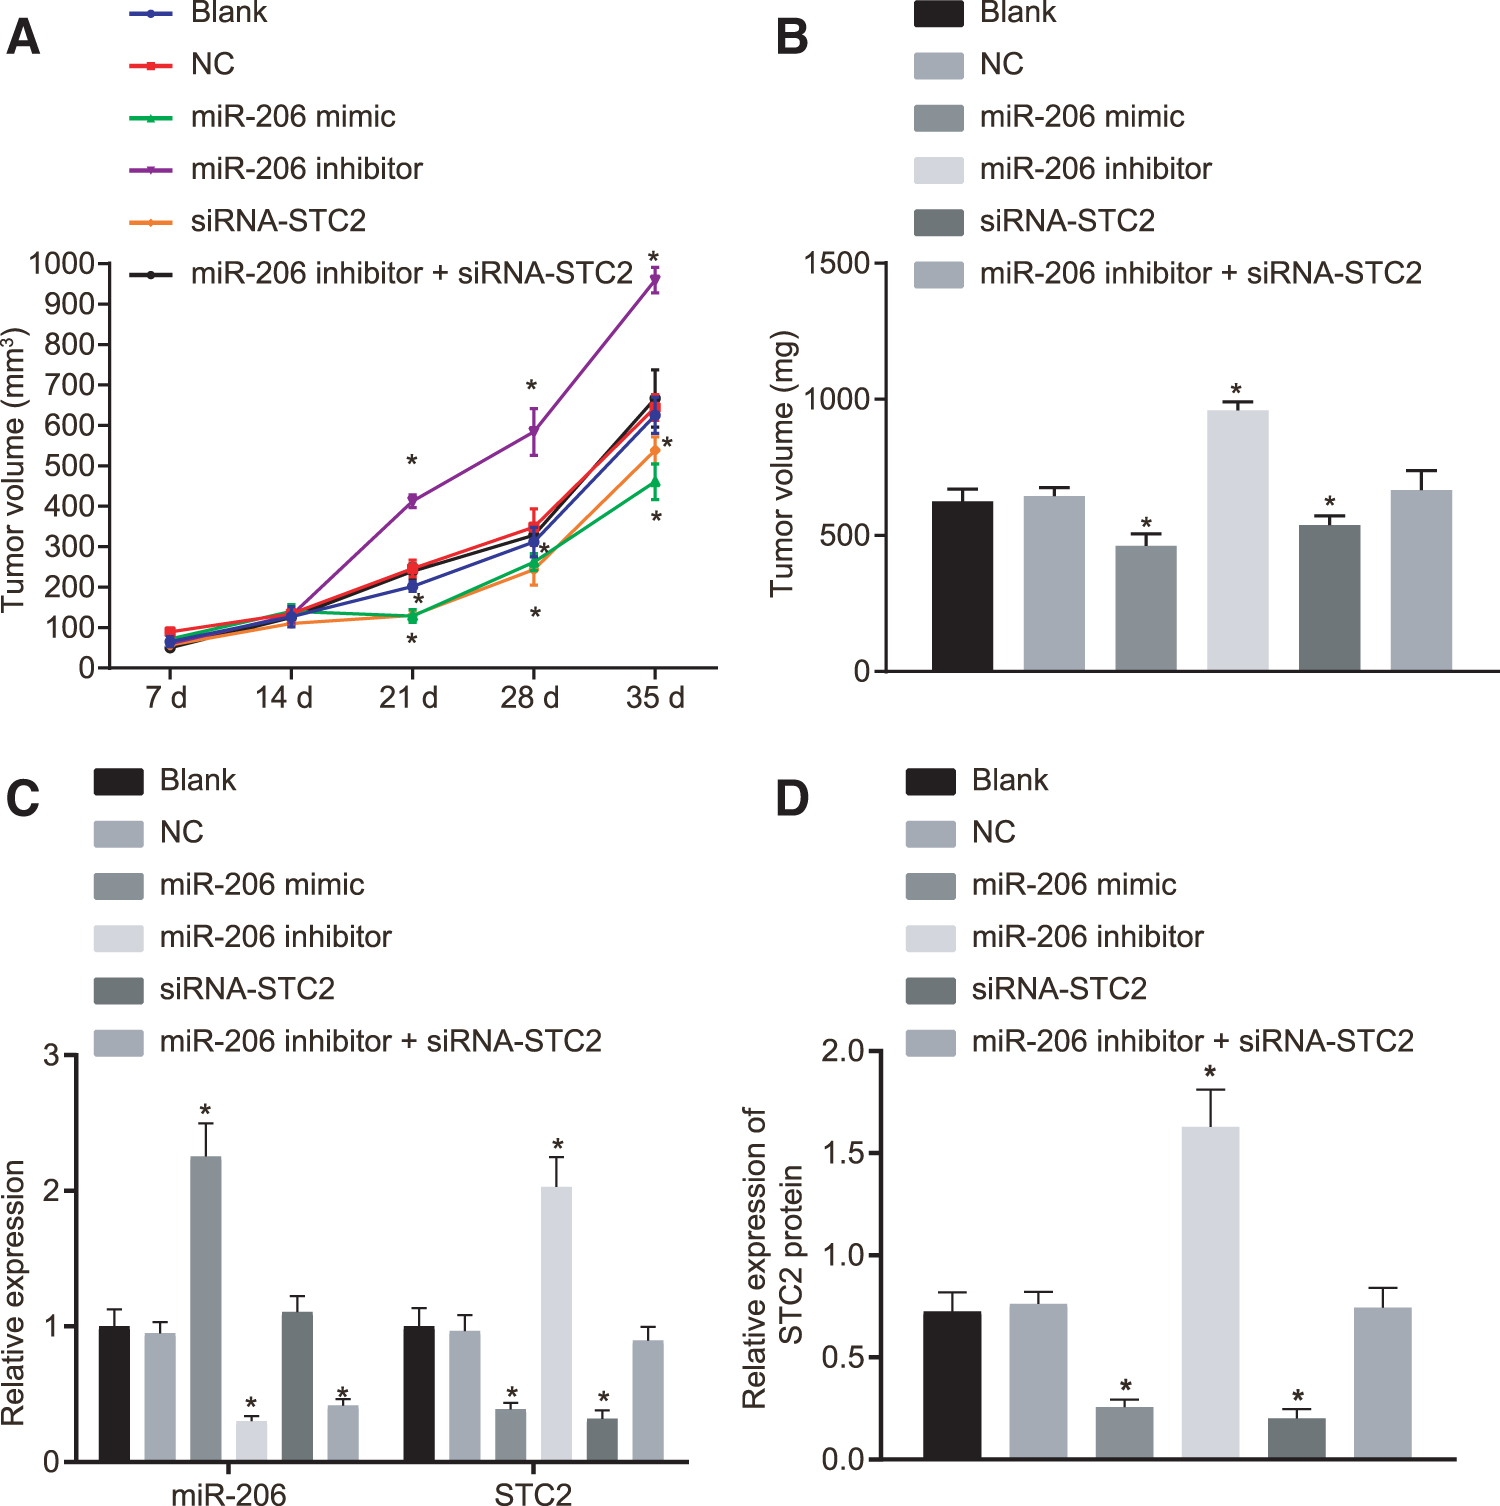
The tumor growth of nude mice was restricted by miR-206 overexpression and STC2 silencing.
Meanwhile, the expression of miR-206 and STC2 was measured by RT-qPCR and Western blot analysis (Fig. 7C, D). The results revealed no significant difference in the expression of miR-206 and STC2 between the blank group and NC group (p > 0.05). However, compared with the blank and NC groups, the miR-206 mimic group and the siRNA-STC2 group exhibited lower protein expression of STC2 (p < 0.05). Moreover, we found that the expression of miR-206 was increased in the miR-206 mimic group (p < 0.05), but remained unchanged in the siRNA-STC2 group (p > 0.05) relative to the blank and NC groups. Further investigations revealed reduced expression of miR-206 in the miR-206 inhibitor group (p < 0.05), accompanied by a significant increase in the protein expression of STC2. In addition, the expression of miR-206 was significantly diminished in the miR-206 inhibitor+siRNA-STC2 group (p < 0.05), whereas no significant difference in protein expression of STC2 was observed (p > 0.05) compared to the blank and NC groups. Briefly, our data demonstrated that the upregulation of miR-206 could inhibit tumor growth of nude mice with HNSCC through suppression of STC2.
Discussion
Evidence has suggested that abnormally expressed miRNAs disrupt the RNA network of normal cells, thus promoting the occurrence of a pathological event making for the development of HNSCC. 19 Recently, miR-206 has been verified as a tumor suppressor in various cancers, including breast cancer, lung cancer, and rhabdomyosarcoma. 20 –22 Accordingly, this study investigated the effects of miR-206 on the regulation of proliferation, apoptosis, and autophagy in HNSCC. Collectively, our data demonstrated that miR-206 influenced the Akt signaling pathway by inhibiting expression of STC2, thereby inhibiting proliferation, while promoting apoptosis and autophagy of HNSCC cells.
Initially, our study exhibited the low expression of miR-206 and high expression of STC2 in HNSCC. Similarly, Kondo, et al. have shown a dramatic decline in the expression of miR-206 in breast cancer, whereas the elevated miR-206 has been indicated to inhibit cell growth in ERa-positive human breast cancer. 23 Furthermore, we sought to investigate the role of STC2 in the development of HNSCC. Accordingly, previously reported data have shown the correlation between STC2 overexpression and a decline in the overall survival of HNSCC patients. Moreover, STC2 is a poor prognostic producer for patients with HNSCC. 11 A further study has suggested that miR-206 can target STC2 in HNSCC. 24 Accordingly, our data from bioinformatics analysis and dual-luciferase reporter gene assay further verified that STC2 was the target of miR-206. Hence, we speculated that the high STC2 expression in HNSCC was potentially induced by the loss of miR-206. Moreover, we found that upregulated miR-206 or downregulated STC2 reduced the mRNA and protein expressions of STC2, Akt, and mTOR. as well as the extents of Akt and mTOR phosphorylation, indicating that miR-206 elevation or STC2 silencing could inhibit the phosphorylation and activation of the Akt signaling pathway. Consistently, it has been reported that the deregulation of mTOR signaling plays an important part in HNSCC progression, whereas mTOR activation could lead to several key cancerous behaviors, thus suggesting mTOR as a key therapeutic target for HNSCC. 25 A recent study has shown another mechanism by which miR-206 involves in the tumor growth in HNSCC, wherein miR-206 potentially downregulates HDAC6 and blocks the Akt/mTOR pathway to delay cancer progression. 15 It has also been illustrated in osteosarcoma cells that upregulation of miR-206 by transfection with a mimic greatly decreases Akt expression, suggesting that miR-206 inhibits the Akt signaling pathway. 26 Our results demonstrated that miR-206 downregulation may promote the expression of STC2, whereby blocking the Akt signaling pathway during the progression of HNSCC.
Furthermore, our data from in vitro and in vivo experiments reported that miR-206 inhibited cell proliferation in HNSCC and tumor growth, while enhancing cell apoptosis and autophagy by downregulating STC2. Notably, survivin, an antiapoptotic protein, has been reported to be highly expressed in cancer cells and regulates the apoptosis and cell cycle. 27 Moreover, survivin has been proved to play a key role in tumor growth, apoptosis, and autophagy by influencing cell division. 28 Bcl-2 and Bcl-x of the Bcl-2 protein family possess the ability to promote the cancer cell progression by preventing cell apoptosis. 29 Accordingly, accumulating studies have employed the autophagy-related proteins (Beclin1, LC3, and p62) to evaluate the conditions of autophagy. 30 It has been suggested that increased expression of Beclin-1 and LC3-II/I is directly correlated with Akt activation and autophagy promotion. 31 Moreover, other data have shown that the upregulation of miR-24-1-5p could potentially accelerate cell autophagy and apoptosis in malignant melanoma by increasing the LC3-II/I ratio and the expression of Beclin-1, and decreasing the expression of Bcl-2 and Bcl-xL. 32 More importantly, inhibition of miR-206 has been proved to restrain cell autophagy and apoptosis, accompanied by increased Bcl-2/Bax ratio and reduced p62 and Beclin1. 33 Accordingly, our data exhibited a decline in the expression of survivin, Bcl-2, and Bcl-x, whereas the ratio of LC3II and LC3I expression of Beclin1 and Bax were significantly increased in the presence of miR-206, demonstrating that miR-206 enhanced the apoptosis and autophagy of HNSCC cells.
In summary, this study suggests that miR-206 inhibits proliferation and promotes apoptosis and autophagy in HNSCC cells through the inactivation of the Akt signaling pathway by decreasing the expression of STC2 (Fig. 8). These findings may pave the way for novel avenues for future HNSCC therapies. However, the findings are limited with only SCC25 cells tested. Moreover, the number of selected patients needs to be enlarged in the following experiments for validation. However, further research will be conducted to further evaluate the potential of miR-206 as a potential therapeutic target in the treatment of HNSC.
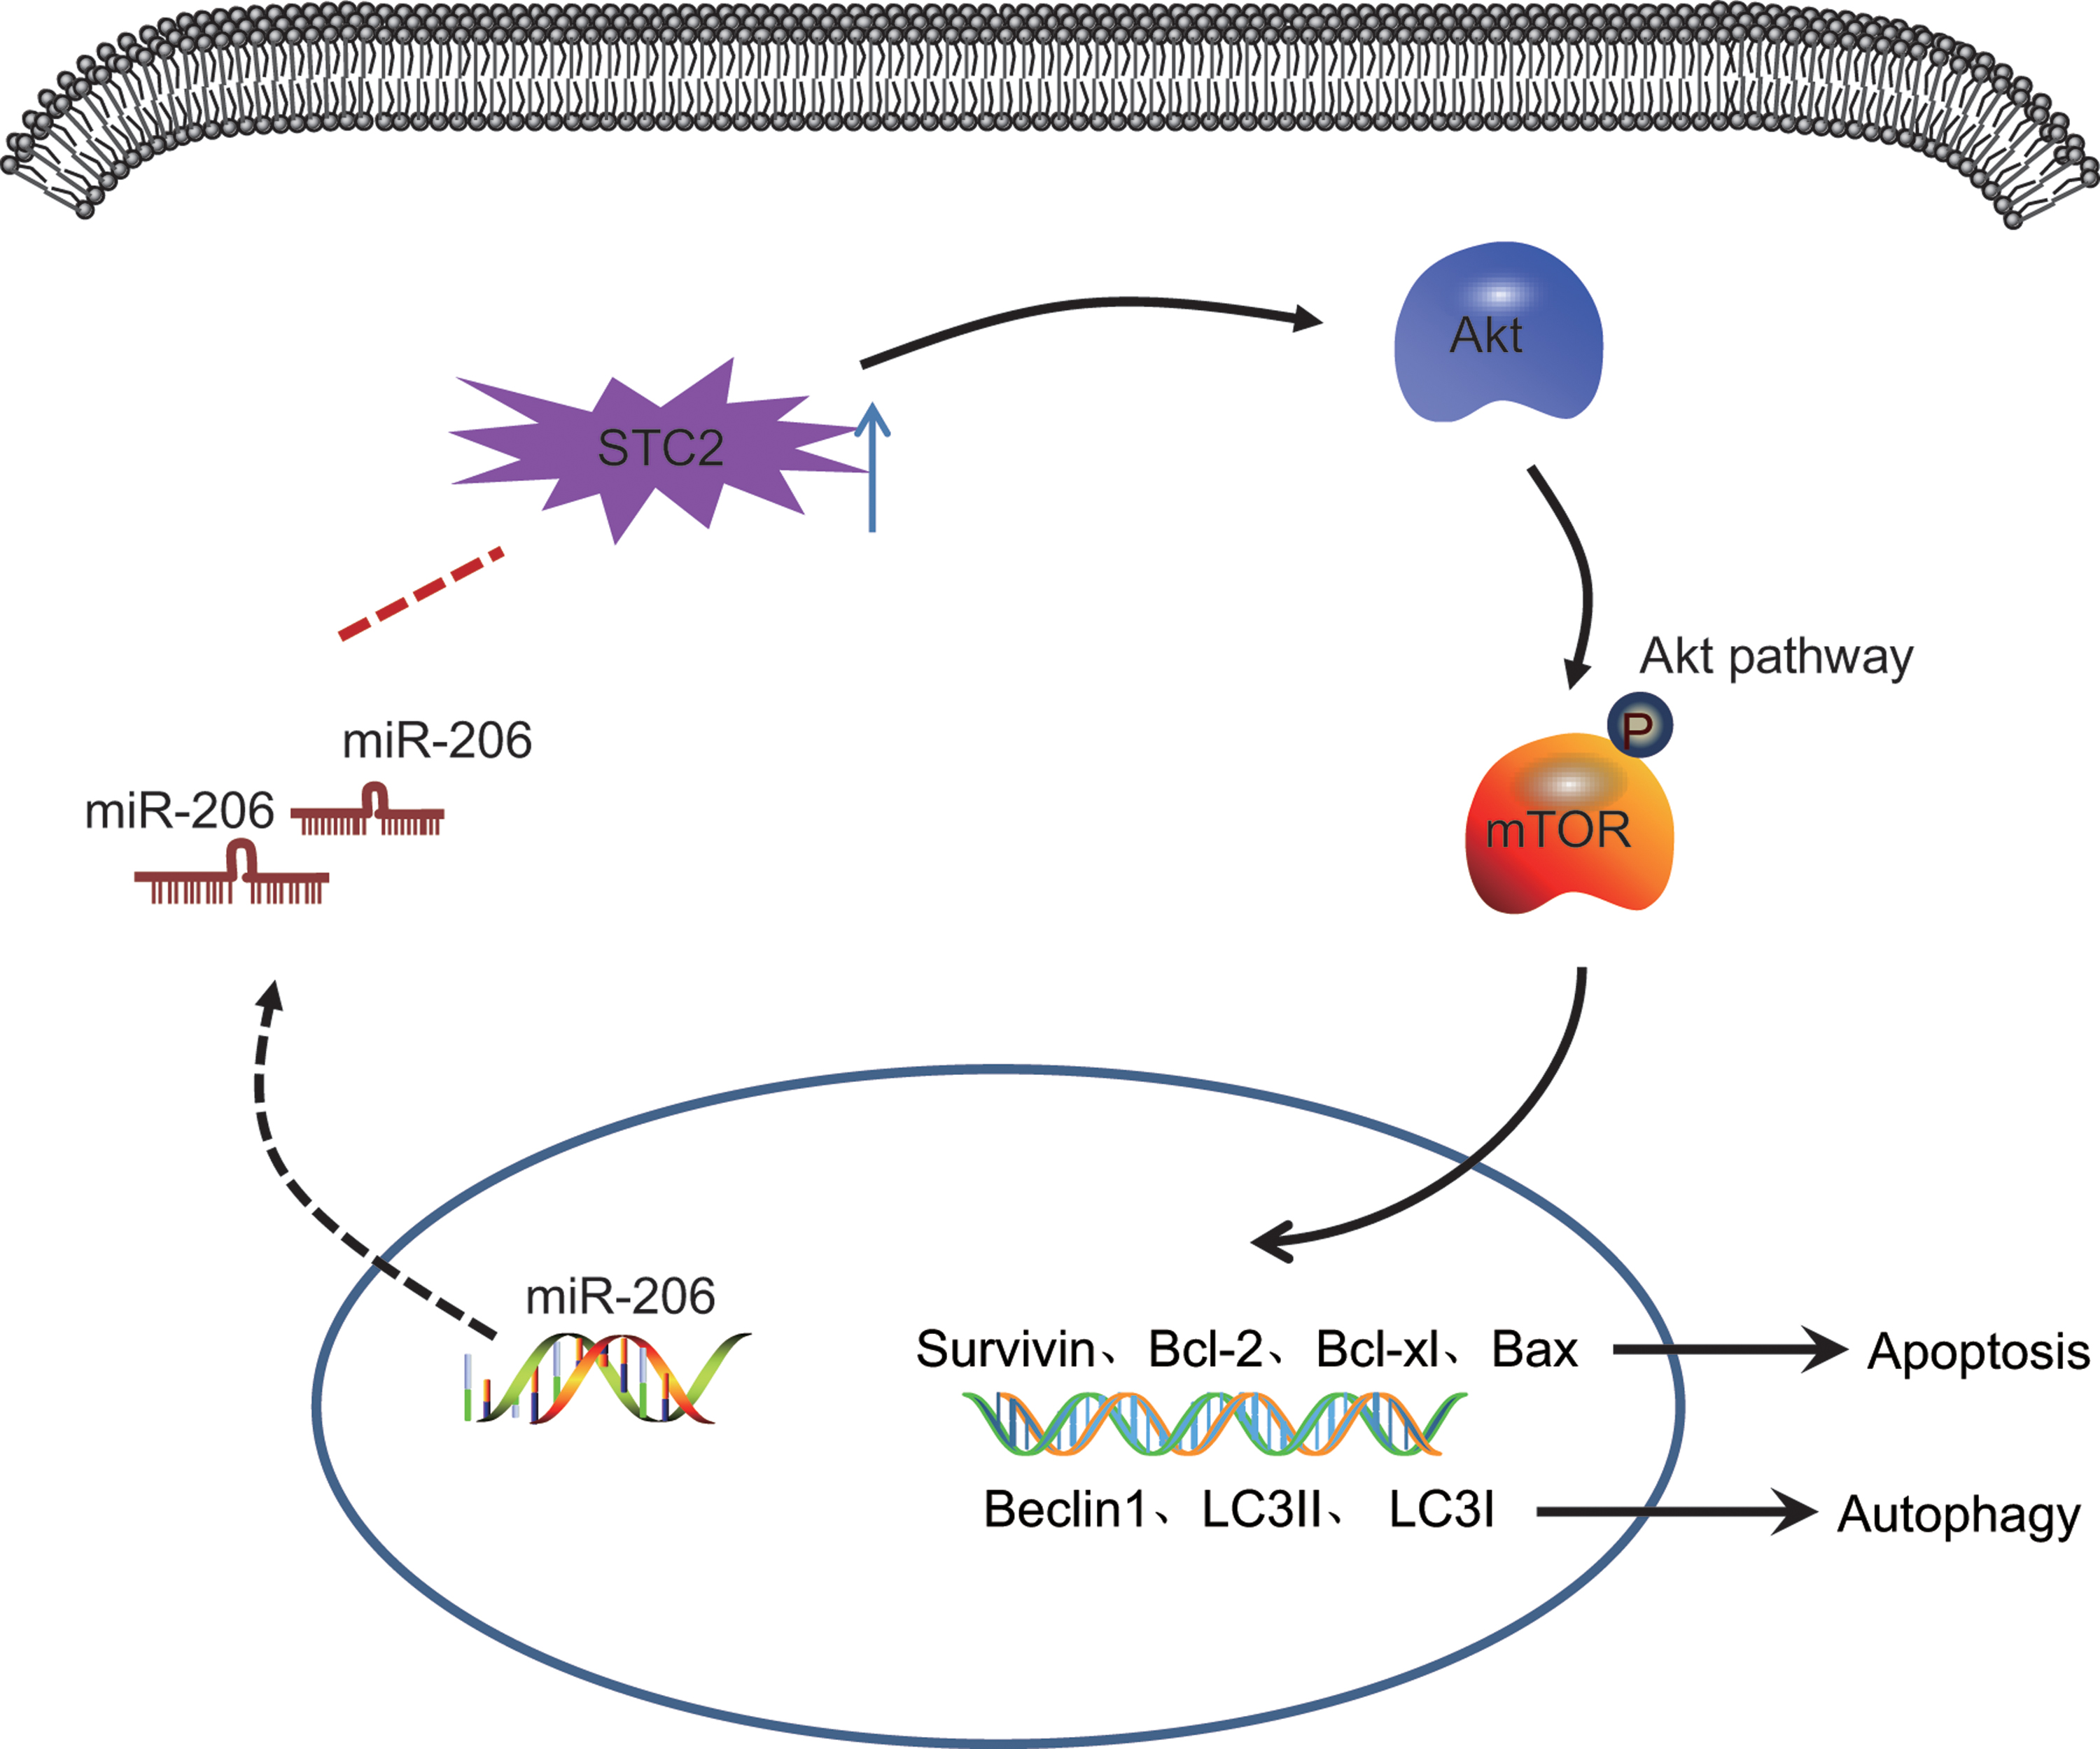
miR-206 inhibited cell proliferation and promoted their apoptosis and autophagy in HNSCC through the inactivation of the Akt signaling pathway by decreasing expression of STC2. Color images are available online.
Footnotes
Acknowledgments
We would like to give our sincere appreciation to the reviewers for their helpful comments on this article.
Author Disclosure
No competing financial interests exist.
Funding Information
This study was supported by Beijing Xisike Clinical Oncology Research Foundation (No. Y-MT2016–014), Beijing Municipal Science and Technology Commission (No. Z171100001017094), and Beijing Xicheng District Science and Technology and Information Technology Commission (No. XCSTS-SD2018–05). The work was carried out in the Department of Otorhinolaryngology-Head and Neck Surgery, Peking University First Hospital, Beijing, China.