
Abstract
There is considerable industry excitement about the curative potential of cell and gene therapies, but significant challenges remain in designing cost-effective treatments that are accessible globally. We have taken a modeling-based approach to define the cost and value drivers for cell therapy assets during pharmaceutical drug development. We have created a model development program for a lentiviral modified ex vivo autologous T cell therapy for Oncology indications. Using internal and external benchmarks, we have estimated the total out-of-pocket cost of development for an Oncology cell therapy asset from target identification to filing of marketing application to be $500–600 million. Our model indicates that both clinical and Chemistry Manufacturing and Controls (CMC) cost of development for cell therapies are higher due to unique considerations of ex vivo autologous cell therapies. We have computed a threshold revenue-generating patient number for our model asset that enables selection of assets that can address high unmet medical need and generate pipeline value. Using statistical approaches, we identified that short time to market (<5 years) and reduced commercial cost of goods (<$65,000 per dose) will be essential in developing competitive assets and we propose solutions to reduce both. We emphasize that teams must proactively plan alternate development scenarios with clear articulation of path to value generation and greater patient access. We recommend using a modeling-based approach to enable data driven go/no-go decisions during multigenerational cell therapy development.
Introduction
Cell and gene therapies represent an exciting and complex new treatment type, with the potential to treat a vast range of indications, in some cases offering the possibility of a disease cure with a single treatment. 1 –4 Cell and gene therapy (CGT) as a medicinal modality is undergoing a major upward inflection in the biopharmaceutical industry. This is evident from large financing deals, exciting clinical data, and landmark regulatory approvals in the past 1–2 years. The global venture financing has exceeded $9 billion in 2019, an increase of 32% year on year from 2018 and large and mid-cap pharmaceutical companies continue to ramp up acquisitions of small biotech developers ($11 billion in mergers and acquisition upfront payment in 2019). 5
The number of approved products in 2019 grew with regulatory approvals for CGTs for Spinal Muscular Atrophy (AveXis/Novartis's Zolgensma), Beta Thalassemia (Bluebird bio's Zynteglo), and Critical Limb Ischemia (AnGes's Collategene) receiving their first approval in the United States, Europe, and Japan, respectively. 5 Chimeric antigen receptor (CAR-T) therapies received additional approvals in Canada (Kite/Gilead's Yescarta) and Japan (Novartis's Kymriah). 6,7 Anticipated near-term filings and approvals include diseases like Hemophilia A (BioMarin's Valrox), Metachromatic Leukodystrophy (Orchard's OTL-200), Multiple Myeloma (Bluebird/BMS's Ide-cel), and Solid tumors (Iovance's Lifleucel). 5 There are over 2,000 clinical programs with >60,000 patients enrolled worldwide, and the Food and Drug Administration is witnessing a surge in the number of investigational new drug (IND) applications (estimated >200 INDs/year by 2020, 10–20 approved products a year by 2025). 5,8
While there is considerable industry excitement about the curative potential of CGTs, significant challenges remain in designing safe, efficacious, durable, scalable, and cost-effective treatments that are accessible globally. 9 –11 Development and regulatory frameworks that enable demonstration of preclinical safety, product quality, and clinical efficacy are well established for small molecules and biopharmaceuticals. For CGT medicines they are less defined and lack harmonization across jurisdictions. 12 –15 CGT candidates have struggled to meet the requirements for successful Health Technology Assessments and demonstrate short-term cost effectiveness versus noncurative comparators. 16 –18 Patients face barriers to access as these therapies may only be offered at a small number of specialized medical centers. The unclear reimbursement landscape had led developers to pursue various approaches like outcome-based payments impacting pricing and market access. 19 –21
In the case of ex vivo autologous T cell therapies, cost and complexity associated with developing a medicine are significant and development teams may struggle to articulate a clear path to addressing both unmet medical need and creating pipeline value. 22,23 The identification of development parameters that create pipeline value are important to encourage continued investment required to translate these cutting-edge technologies into medicines with meaningful clinical benefit to patients. 24 –26
We have taken a modeling-based approach to define the cost and value drivers for genetically modified T cell therapies in development. We created a model development program for a lentiviral modified ex vivo autologous T cell therapy for Oncology using internal and external benchmarks. The model (see methods) is different from a traditional biologics drug development program in several ways. (1) We assumed preclinical safety and efficacy evaluation to be in vitro due to lack of availability of good in vivo animal models for Oncology cell therapies. (2) Since cell therapies are entering Oncology treatment paradigm in a late line setting where patients are sick and heavily pretreated, we assumed a pilot to pivotal clinical study design for accelerated approval as opposed to the traditional phase 1, 2, 3 design. (3) We modeled early clinical evaluation in small studies across many indications to maximize patient availability as screen failure rates can be very high for cell therapies. (4) We included long-term follow-up and real-world evidence clinical studies in the model design as these are increasingly being leveraged to generate enough evidence in cell therapies. (5) We included in the model a companion diagnostic development program to identify eligible cell therapy patients and a biomarker program to test for T cell presence, activation, expansion, and persistence at the tumor site. (6) We assumed a circular supply chain where a patient undergoes leukapheresis to isolate peripheral blood mononuclear cells at a clinical site. The cells are sent to a manufacturing facility where T cells are selected, activated, genetically modified using lentivirus, formulated into drug product and sent back to the clinical site for infusion into the patient. (7) In the supply chain assumptions, we included vein-to-vein real-time tracking during transport of patient cells. (8) We considered that compared with traditional biologics, the clinical and manufacturing cost per patient are significantly higher for cell therapies and by benchmarking from external cell therapy-specific references we included these costs in our development model. All these considerations allowed evaluation of autologous cell therapies as peculiar products different from traditional biologics in pharmaceutical drug development models.
Using our model, we identified the cost of development of one asset from target identification to filing of the marketing application. We identified the biggest levers to reduce cost of development and cost of goods (COGS). Using sensitivity analysis, we identified drivers of high asset value and time to market thresholds that create favorable pipeline value. We will demonstrate how the proposed modeling framework can be used to enable data-driven decisions during cell therapy development.
Materials and Methods
Cell therapy asset development model
A multidisciplinary bottoms-up asset development model (Fig. 1) was created starting from commit to target (C2T) milestone through preclinical development, pilot and pivotal clinical studies to filing of Biologics License Application (BLA) and launch. Approximately 4 years were assumed from the milestone of C2T to candidate selection during which sufficient preclinical biology and safety data were collected to justify preparation for first in human studies (FTIH). Candidate selection was defined as a milestone where a single transgene construct was selected for FTIH after experimentation with many lead constructs (e.g., several CAR/T cell receptor [TCR]). Before candidate selection, many lead CAR/TCR constructs were designed into viral vectors that transduced primary T cells. Each construct was tested for ability to engage and modulate a tumor target and elicit cytotoxic response in cancer cells.

Cell therapy asset development model. A multidisciplinary asset development model was created starting from C2T milestone through preclinical development, pilot and pivotal clinical studies to filing of BLA and launch. Approximately 4 years were assumed from the milestone of C2T to candidate selection. Candidate selection was defined as a milestone where a single construct (e.g., CAR/TCR for T cell expression) was selected for first in human studies after experimentation with many lead constructs. One year was assumed to allow preparation from candidate selection to start of first in human studies. Clinical development program for one asset testing a new target was defined as executing three pilot clinical studies. It was assumed that successful pilot studies will lead to two pivotal studies that will enable a BLA in at least one indication. BLA, biologics license application; C2F, commit to file; C2P, commit to pivotal; C2T, commit to target; CS, candidate selection; Dev, development; FTIH, first time in human; GMP, good manufacturing practice; IND, investigational new drug application; LD, lead declaration; LS, lead selection; Manuf, manufacture; PAI, preapproval inspection (of GMP facilities); TT, tech transfer.
One year was assumed to allow preparation from candidate selection to start of FTIH studies, including obtaining regulatory approval and opening clinical sites. Clinical development program for one asset testing a new target was defined as executing three pilot clinical studies (dose escalation/expansion, 20 patients each, 2.5 year) in Oncology indications dictated by target expression. It was assumed that successful pilot studies will lead to two pivotal studies (150 patients each, 3 year) that will enable a BLA in one indication. A biphasic approach to Chemistry Manufacturing and Controls (CMC) development was assumed: fast to clinic development for pilot and additional commercial enabling development for pivotal studies. CMC is defined as process, analytical and formulation development, technology transfer, good manufacturing practice (GMP) manufacture, release testing, and stability of viral vector and cell product.
The out-of-pocket cost of development is defined as the total expenditure incurred by a drug developer across all functional disciplines for an asset developed internally (not in-licensed) between milestones of C2T to market launch. To estimate the out-of-pocket cost of development of an asset, each work package contributing to development was assigned a rate of Internal Project Expenditure (IPE, people in an organization across scientific disciplines) and External Project Expenditure (EPE, all other costs except people, e.g., payment to external vendors) over the duration of the work. The IPE and EPE costs were spread over the duration of asset development starting form C2T and ending at asset launch. IPE costs were fully loaded to include allocations for corporate functions and nonscientific overhead. Any additional development costs incurred postlaunch were not included in our calculations. Development costs were calculated as “out-of-pocket” and not adjusted for pipeline attrition or cost of capital.
For the value calculation, revenue-generating patients were computed by estimating annual disease incidence and discounting for various factors such as line of therapy, biomarker utilization, antigen expression, human leukocyte antigen (HLA) allele frequency (for TCR), patient performance rate, geographical access rate, antigen class market share, cell therapy market share, and market access rate. Revenue-generating patient number was used in conjunction with publicly available price benchmarks to calculate a revenue curve. Thirty-year cashflows were created using revenue, COGS, sales and marketing costs, and royalty estimates. Net present value (NPV) of the cash flows was calculated using discounted cash flow method (working capital 25%, tax rate 21%, discount rate 7%).
Risk-adjusted return on investment (eROI) was used as a tool to determine asset financial health and potential for pipeline value generation. Probability of success (POS) was assigned at each phase of development using benchmarks for Oncology indications in biopharmaceutical drug development since industry benchmarks are yet to be established for CGT. Table 1 shows an example for overall POS calculation for an asset entering pilot studies computed by multiplying POS at each phase. Overall POS calculations for an asset can vary greatly on phase of development and the clinical data available. Overall POS was used to discount costs and value estimates and compute risk-adjusted development costs (eDevCost) and risk-adjusted value (eNPV). Risk-adjusted return on investment (eROI) was calculated according to the following formula:
Probability of success
POS, probability of success.
An asset with a computed eROI of one or greater was considered as yielding incremental pipeline value for incremental development cost incurred.
Efficient frontier graphs were constructed to evaluate pipeline value generated by a model asset for every incremental dollar of development cost incurred. 27,28 eDevCost, eNPV, and eROI were computed for model assets with varying number of revenue-generating patients and the assets were organized in descending order of eROI (highest to lowest). Starting from the asset with the highest eROI, the assets were plotted on a graph x-axis: Cumulative eDevCost, y-axis: Cumulative eNPV. The resulting graph was called the “efficient frontier” of the portfolio of assets considered. This graph was used to evaluate conditions that will yield high value-generating assets. An asset on part of the efficient frontier graph with a positive slope (incremental value/incremental cost) was considered “efficient” and zero slope was considered “inefficient.”
Results
Total out-of-pocket cost of development is estimated at $500–600 million
The out-of-pocket cost of development is defined as the total expenditure (IPE + EPE) incurred by a drug developer across all functional disciplines for an asset developed internally (not in-licensed) between milestones of C2T to market launch. For a lentiviral vector modified ex vivo autologous cell therapy (Oncology indication), the cost was calculated to be $550 million across 3 pilot (20 patients each) and 2 pivotal studies (150 patients each). The cost of development breakdown was calculated to be $245 million IPE (internal people) and $305 million EPE (all expenditures except internal people) (Fig. 2A). Third-party licensing fees or infrastructure investments were excluded from the calculation.

Total out-of-pocket cost of development is estimated at $500–600 million.
Clinical is cost of executing a clinical study on a per-patient basis and the cost of long-term follow-up studies, CMC is the cost of process, analytical and formulation development, technology transfer, GMP manufacture, release testing, and stability of viral vector and cell product. Plasmids, cell banks, vein-to-vein supply chain, and logistics costs are also included in CMC. Biology is the cost of conducting translation studies and developing companion diagnostic testing. Real-world evidence (RWE) is the cost of executing RWE studies like historical cohort, epidemiology, patient insights, and physician preference. Reg. is the fees incurred for filing regulatory submissions. Preclinical is the cost of executing safety and efficacy studies to generate the evidence required for progression to FTIH studies.
The EPE from C2T to launch ($305 million) was calculated by function to be CMC $151 million, clinical $114 million, biology $14 million, RWE $8 million, Reg. $6 million, and preclinical $13 million (Fig. 2B). The IPE from C2T to launch ($245 million @ $325,000/R&D cost per full time employee [FTE]), was calculated by function to be CMC (process, analytical, formulation development and GMP, supply chain) 330 FTE, clinical development and operations 148 FTE, biology 111 FTE, RWE 12 FTE, biostatisticians 60 FTE, regulatory 23 FTE, and preclinical (biology, safety, CMC) 70 FTE (Fig. 2C). FTE expenditures are on a per-asset basis and for all functions except preclinical were spread over 7 years from CS-BLA. Preclinical FTE expenditure was defined as C2T-CS over a 4-year period.
Cost of goods dominates CMC cost of development
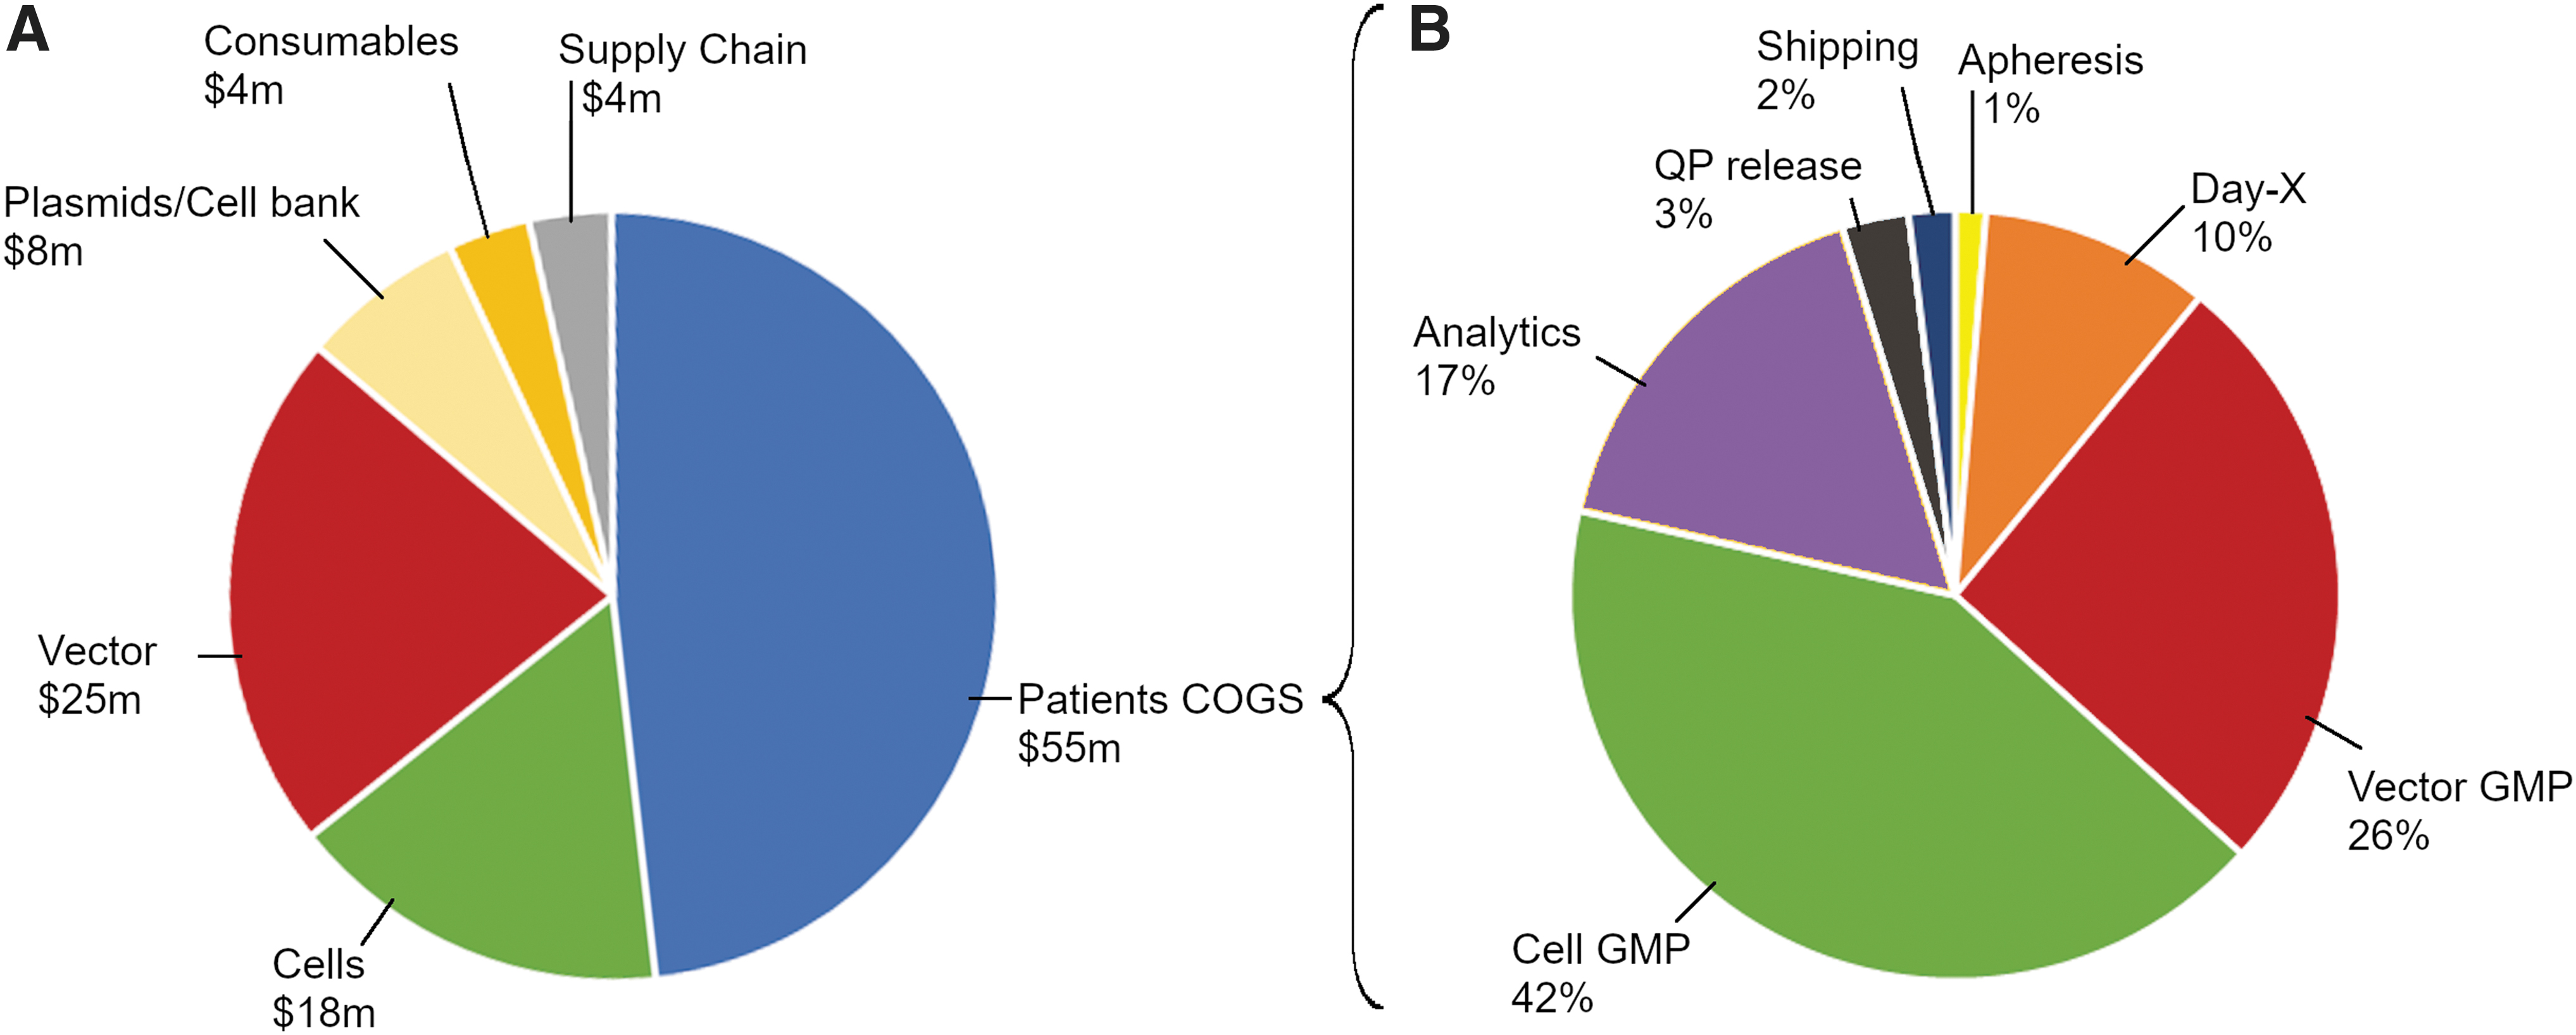
Since CMC is a major contributor to EPE for an asset (Fig. 2B, EPE, blue), we decided to investigate the biggest drivers of CMC EPE cost of development. By phase of development, the total $151 million CMC EPE was distributed as CS-FTIH EPE of $15 million, FTIH-C2P EPE of $22 million, and C2P-launch EPE of $114 million. The breakdown of C2P-launch CMC EPE ($114 million) is shown in Fig. 3A. The major categories of CMC EPE are patient COGS, vector development and tech transfer to a GMP facility (vector), cell development and tech transfer to a GMP facility (cells), plasmids and cell banks, and supply chain and logistics. Supply chain costs include shipping, storage, and real-time tracking. Plasmid costs include cost of producing, release and stability testing of GMP-grade plasmids for clinical vector supply. Cell bank costs include costs of producing and releasing GMP-grade master and/or working cell bank for viral packaging cell lines. Consumables represent development laboratory consumables (e.g., media, pipettes, etc.) The largest category of expense - patient COGS are directly proportional to the number of patients dosed in a clinical study (assumed 300 in pivotal). The cost for vector/cell development and tech transfer is directly proportional to the complexity and automation of vector and cell processing unit operations, number of sites chosen for GMP manufacture, and strategy for clinical and commercial site footprint (centralized or regional).
Cost of goods dominates CMC cost of development.
Patient COGS (Fig. 3B) represent the vein-to-vein cost of goods for viral-modified ex vivo autologous therapy (assumed $140,000–$180,000 per patient per dose). 10,29 –31 Apheresis is the cost of collecting the patient cells at a qualified center. Day-X is the cost of processing apheresis from fresh to frozen with a target cell type. Vector GMP and Cell GMP, respectively, are the cost of GMP-produced viral vector per patient and the cost of processing a patient's cells starting from selection, activation, transduction, expansion, and ending in frozen cell drug product. Depending on the complexity of the transgene carried by the viral vector (e.g., CAR, TCR construct design), COGS contribution could be >5% of the total COGS or to up to 26% of the total COGS as shown (see Discussion section). Analytics is the cost of release and stability testing of the cellular drug product for identity, purity, potency as per release specifications. QP release implies cost of a Qualified Person releasing cellular drug product—a regulatory requirement in the European Union.
The next biggest contribution to EPE cost of development comes from cost of clinical development (Fig. 2B, $114 million). Clinical EPE costs are primarily driven by clinical cost per patient (assumed $200,000–$250,000/patient 32 –34 ex vivo autologous, 60 pilot, 300 pivotal patients), which incorporates all costs incurred by study sponsors from recruiting through treatment and discharge. The other clinical cost driver is the cost of long-term follow-up per patient (assumed ∼$6,000–$10,000 per patient per year). 35 Clinical benchmarking indicates that our assumption for clinical cost per patient for a cell therapy study is higher as compared to a study with small molecules and biologics. 36 Patient eligibility criteria are typically more stringent for cell therapy and screen failure rates require opening many clinical centers to identify a small number of eligible patients. 37 Large costs can be incurred if hospitalization and specialized care are required post cell therapy treatment. 32 Biomarker testing may be higher per patient due to unique measurements required to establish target patient population and pharmacokinetic/pharmacodynamic (tumor burden, infused cell in vivo localization, and activity status) effect of cell therapy. 38,39
Assets that access more patients deliver higher pipeline value
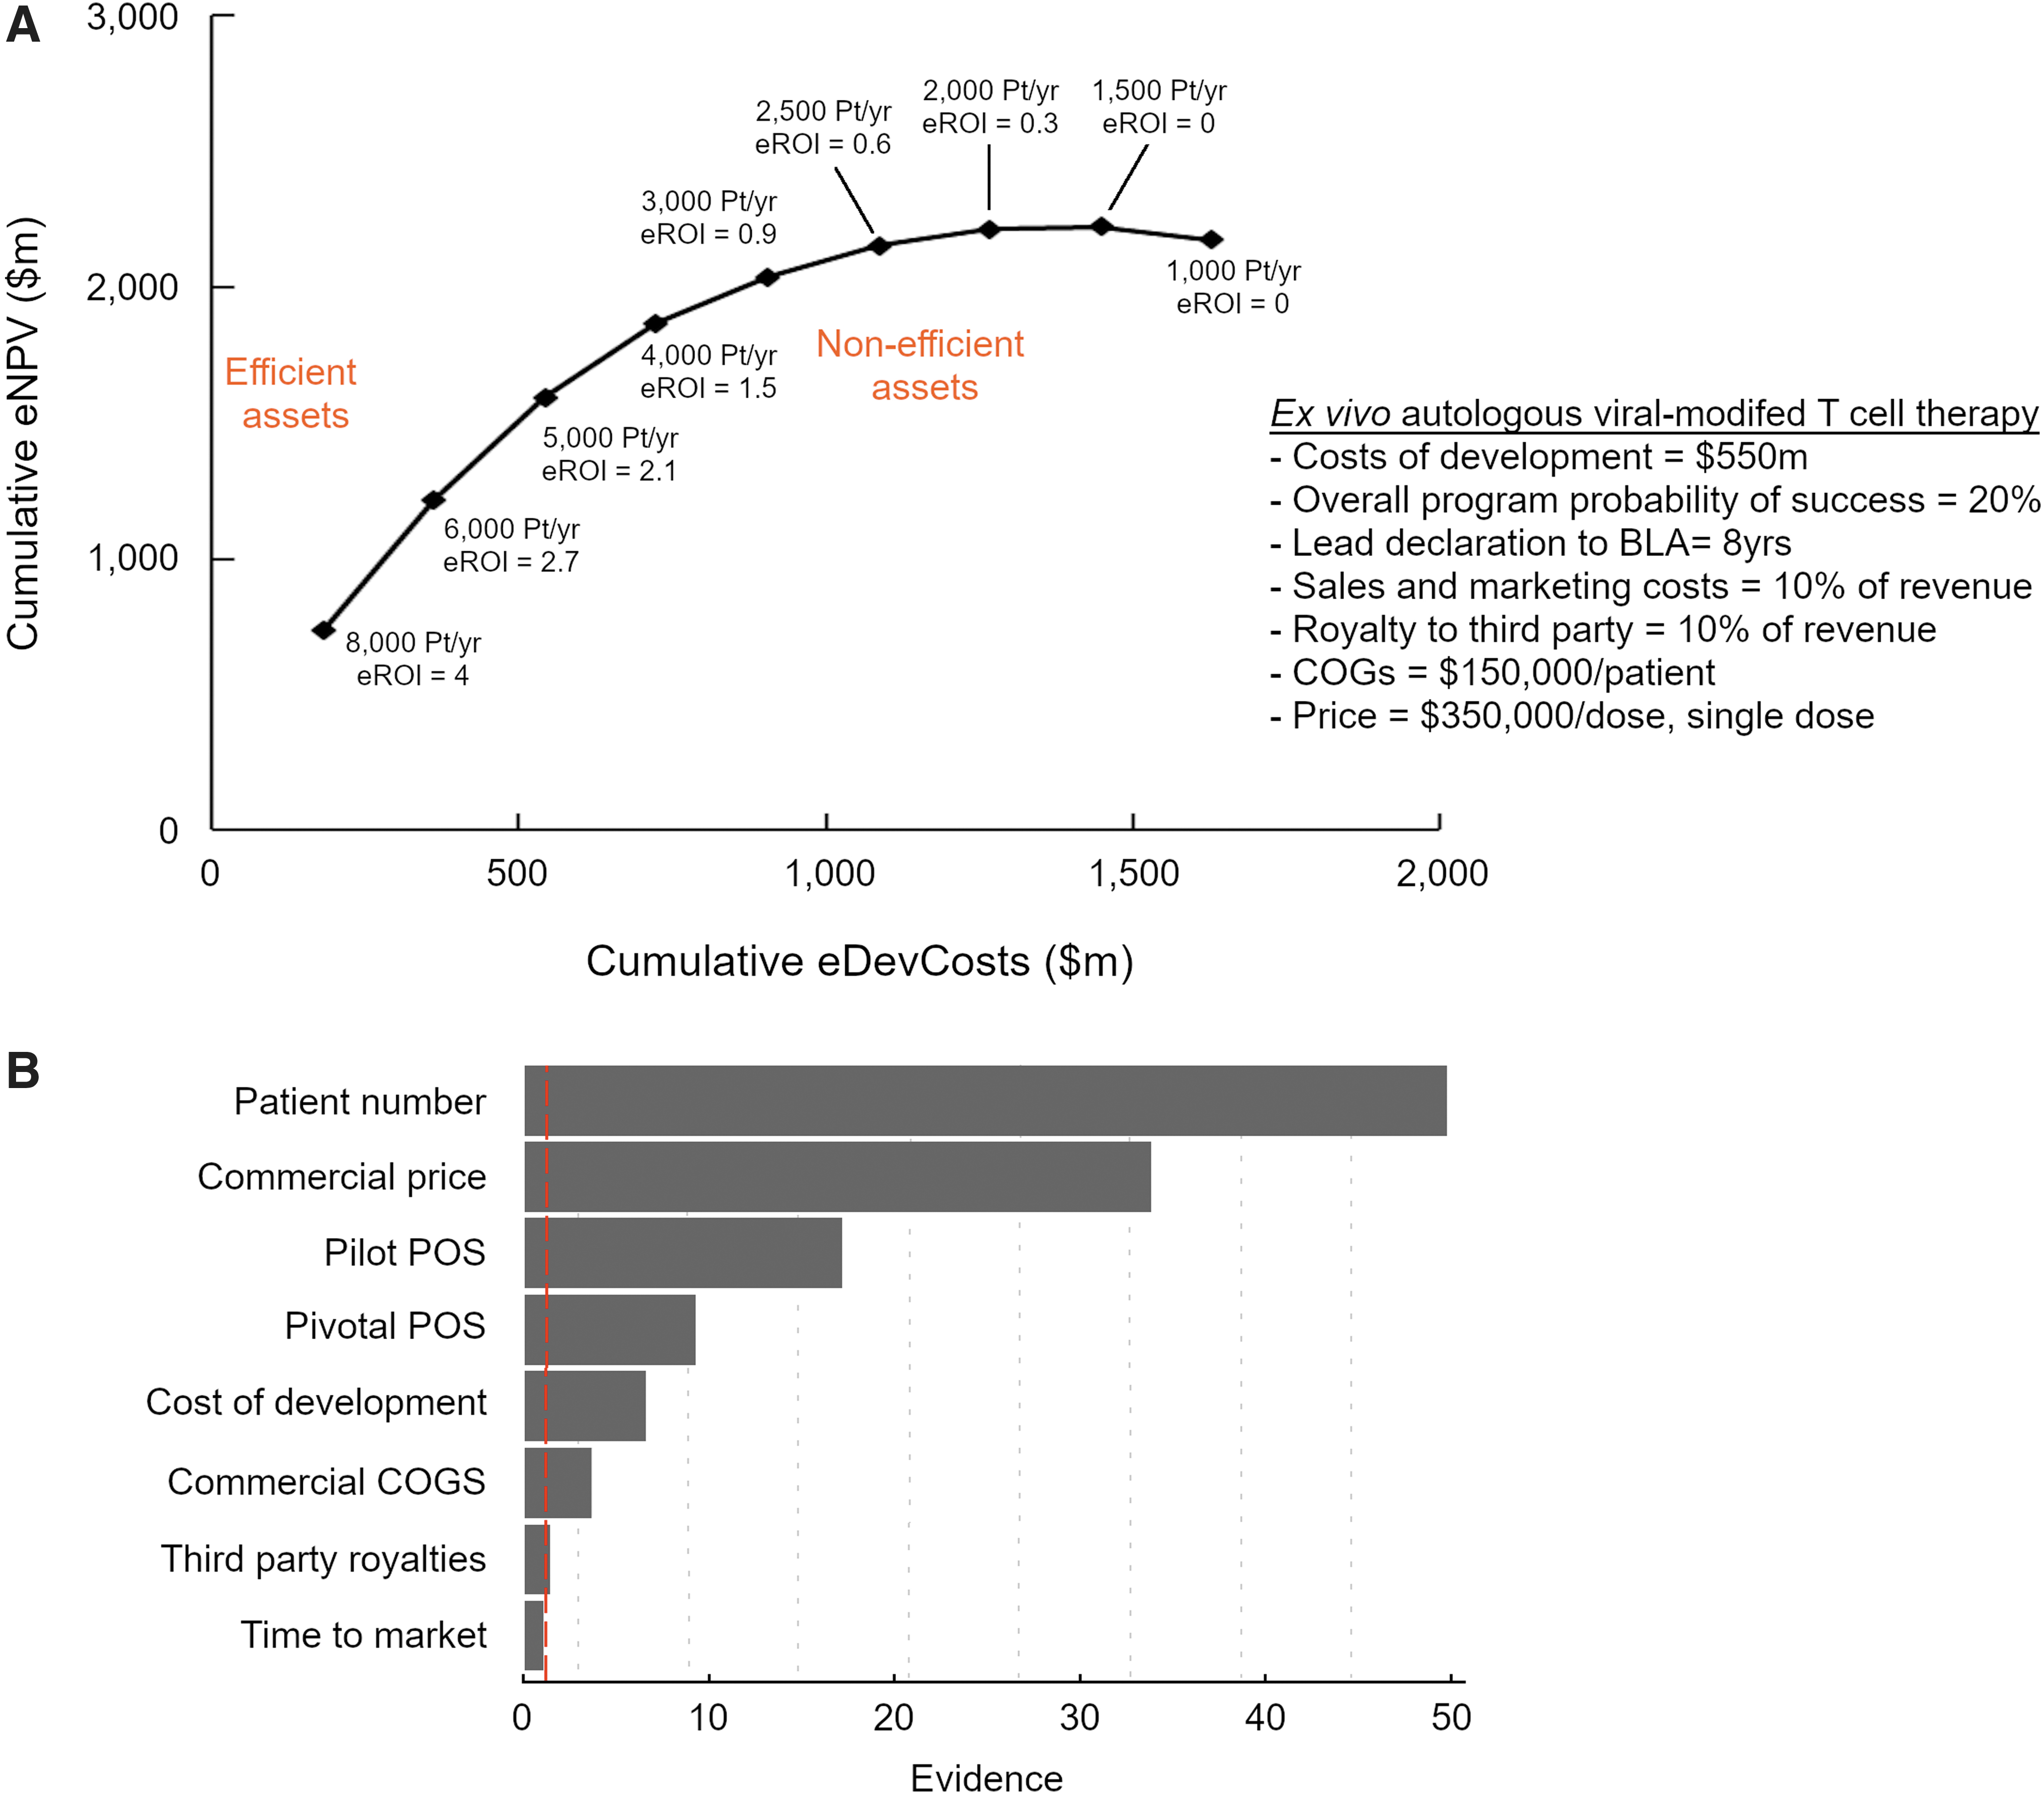
To understand the drivers of pipeline value created by an Oncology cell therapy asset, we developed an efficient frontier graph. We computed several eROI values for our model asset by varying the number of revenue-generating patients per year postlaunch but fixing some parameters as shown in Fig. 4A (cost of development, overall program POS, time to market, sales and marketing cost, royalties, COGS, and price). For simplicity, postlaunch changes in disease incidence per year or price erosion were not considered in building revenue curves. Resulting eROI values were organized in descending order and starting from the highest value, plotted on a graph of cumulative eNPV versus cumulative eDevCost.
Assets that access more patients deliver higher pipeline value.
An asset with calculated eROI on part of the efficient frontier with a positive slope was considered “efficient” as it yielded incremental pipeline value for incremental development dollars spent. An asset with calculated eROI on part of the efficient frontier with a slope of zero was considered “inefficient” as it yielded no additional pipeline value for incremental development dollars spent. Using the efficient frontier, we established a postlaunch revenue-generating patient per-year threshold (∼3,000/year) required by cell therapy program commercial forecasts to articulate favorable pipeline value creation.
Next, we aimed to understand the relative contributions of various parameters on pipeline value (Fig. 4B). We computed 135 values of eROI for different parameters at two boundary conditions and one midpoint. Values for parameters are program specific and highly dependent on competition, rate of market access, clinical data available, and process design. To build a model we assumed—patient number/year (200, 2,000, 6,000), commercial price ($350,000, $1,000,000, $2,000,000 per dose, single dose), pilot study POS (10%, 30%, 50%), pivotal study POS (30%, 50%, 80%), cost of development ($300 million, $500 million, $900 million), commercial COGS ($30,000, $80,000, $180,000), royalties (5%, 10%, 20%), and time to market (5 years, 7 years, 10 years).
We used the response surface methodology 40 to first pick the optimal parameter combinations then fit a linear model with second-order interactions and quadratic terms (JMP, version 14; SAS Institute Inc., Cary, NC, 1989–2019). To understand the relative impacts of each parameter we conducted a “joint test.” A joint test is a statistical test of whether a parameter can be removed from the model. These tests produce evidence values quantifying the relative importance of each parameter in explaining eROI. [Evidence = −log10 (p-value)]. Patient number per year and commercial price had notably larger evidence values, indicating an overwhelming impact on value generation (eROI). However, the other parameters had significant (p < 0.05) or near-significant evidence values and were considered to have a meaningful impact on value generation.
Short time to market (lead to launch) critical for delivering pipeline value
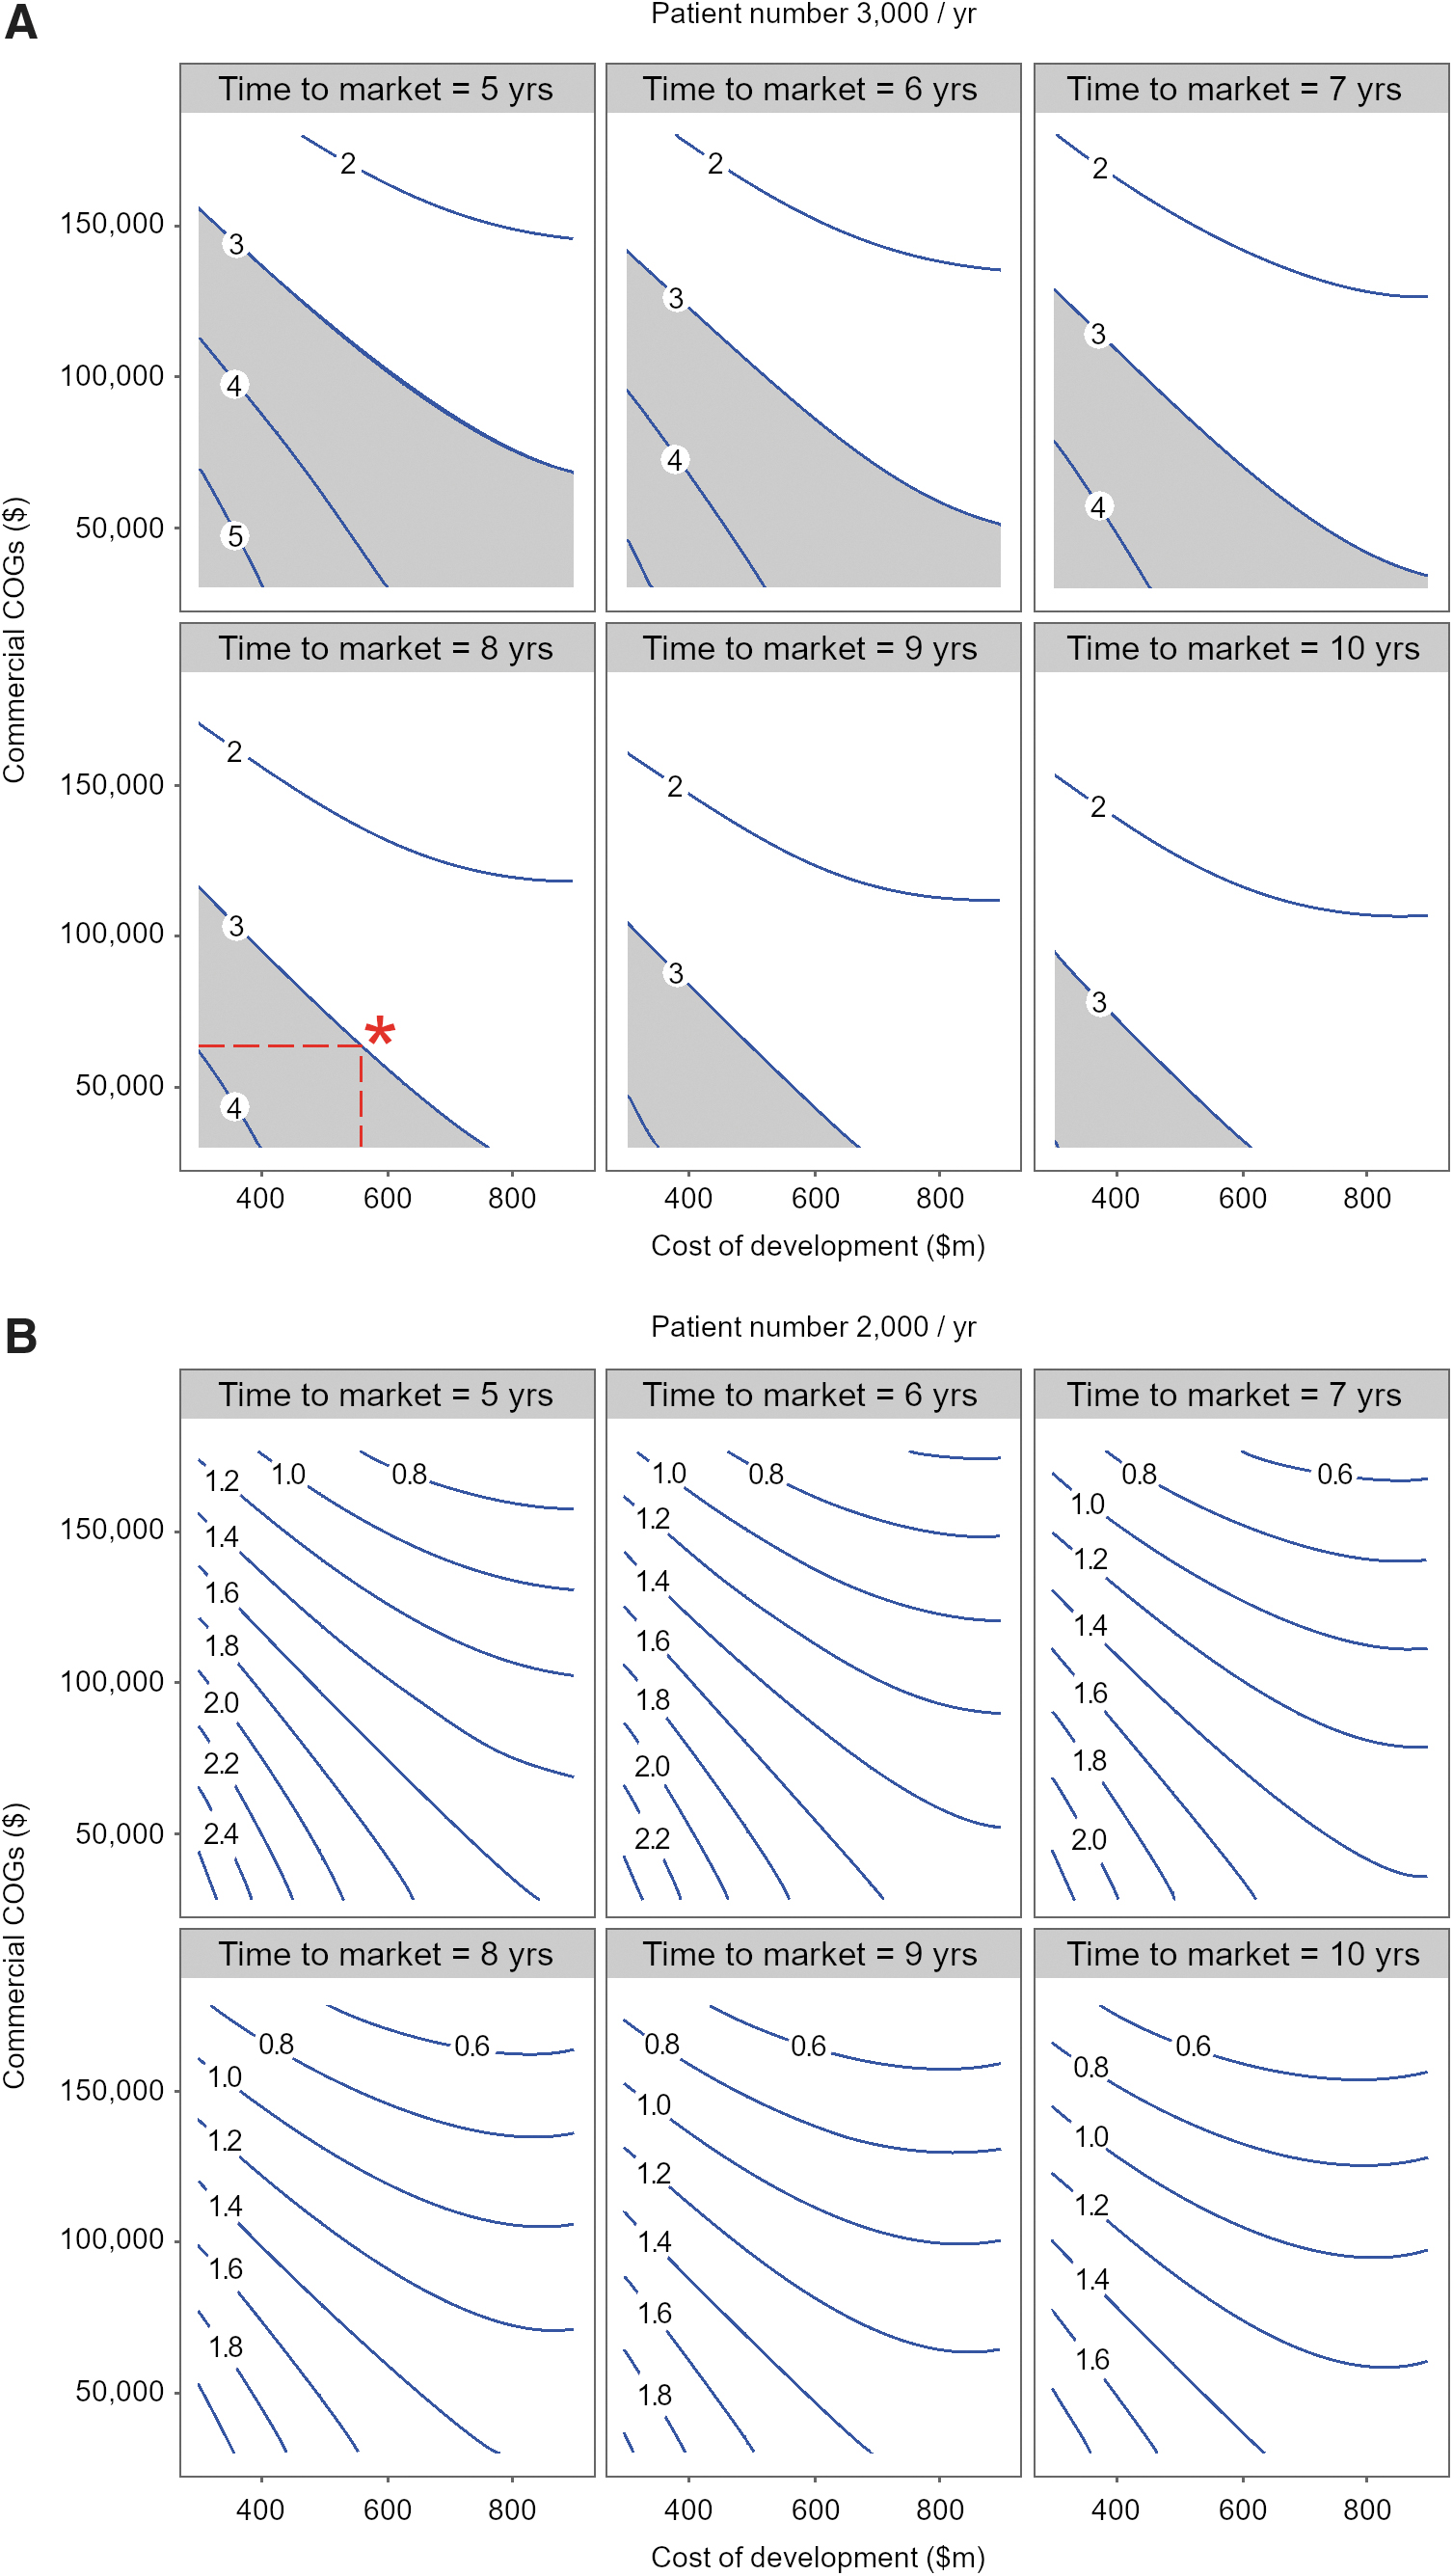
To better understand the impact of time to market and commercial COGS on eROI, we used fitted values from the response surface model to construct eROI contours for various combinations of cost of development and commercial COGS. We developed the eROI contours at three revenue-generating patient/year values (Fig. 5A: 3,000/year, Fig. 5B: 2,000/year and data not shown: 1,000/year). For each patient/year condition, we fixed pilot study POS at 30%, pivotal study POS at 70%, and commercial price at $350,000 per single dose and created contours at time to market of 5, 6, 7, 8, 9, and 10 years. Based on internal benchmarks for early phase clinical assets, an eROI value of 3 or greater was set as a threshold that cell therapy assets must articulate to be considered “efficient” or “competitive” in generating pipeline value. Favorable combinations of cost of development and commercial COGS that generate an eROI of 3 or greater are depicted by the gray area in Fig. 5A. As the time to market increases, less combinations of cost of development and commercial COGS yield a favorable eROI and the gray area becomes smaller. At a time to market of 8 years as proposed for our model cell therapy asset, if $550 million is spent in cost of development, for eROI to meet a threshold of 3, commercial COGS should be $65,000 per dose or lower (*, Fig. 5A). To withstand a higher COGS, the cost of development must be lower than $550 million (implying smaller clinical studies). The importance of accessing a threshold patient number per year is once again depicted in Fig. 5B where at 2,000 patients/year all eROI contours are below 3 and the gray area (eROI 3 or greater) has completely disappeared. At 1,000 patients/year, all eROI contours are below 1 (data not shown). Figure 5 illustrates that at cost of development and COGS values that are likely for Oncology cell therapies, short time to market and lower costs of goods are critical to delivering pipeline value. The thresholds discussed in Fig. 5 will drive development decisions such as clinical trial design, path to regulatory approval, and design of CMC processes that can deliver a lower COGS. As discussed below, it is critical to approach cell therapy development with a proactive mind set and early commercial input is vital to delivering a competitive asset profile.
Short time to market critical for delivering pipeline value.
Discussion
We have taken a modeling-based approach to define cost and value drivers for cell therapies. We have created a model development asset for a lentiviral-modified ex vivo autologous T cell therapy for Oncology indications using internal and external benchmarks. From C2T to BLA file (11 years), we have calculated the cost of development for our model asset to be $550 million. The clinical program is assumed to consist of 3 pilot (20 patients each) and 2 pivotal studies (150 patients each). The cost of development is calculated to be $245 million IPE and $305 million EPE. We have found that the cost of development (EPE) is directly proportional to the size of the clinical study. The clinical study cost per patient for a study sponsor is 2–3 × higher (assumed $200,000–$250,000/patient) compared with other biologics due to higher burden of hospitalization and testing for a cell therapy. Investment in next-generation CAR/TCR constructs (e.g., drug/switch/antibody controllable CAR-T) that improve the safety profile of cell therapies will enable outpatient administration thus lowering clinical costs. 41 –43
The clinical COGS for vein-to-vein manufacturing of cell therapies are high (assumed $140,000–$180,000 per patient per dose) due to autologous ex vivo manufacture. Our analysis indicates that the biggest levers for reducing vein-to-vein COGS are cost of GMP manufacture of vector and cell per dose, and the analytics used to release the GMP cells. Further COGS modeling (data not shown) indicate that reducing process time from 7–14 to 2–3 days will have a significant impact (50–70%) on reducing COGS and this finding is consistent with other studies. 31 Process time is dose dependent and posttransduction T cell expansion is a key driver. 44 –46 Technologies (e.g., addition of intracellular costimulatory domains to CAR design) that increase potency and cytotoxic potential of autologous T cells may reduce dose and process time. 4,47,48
Cell process development studies should aim to understand the relationship between process time and cellular composition/phenotype as evidence suggests that not all T cells are created equal. 49 –51 Younger T cells delivered through short process time (FasT CAR-T, Gracell Bio) may have a higher proportion of T memory cells as compared with T effector cells and are expected to be more clinically effective due to lower in vivo exhaustion, greater persistence, proliferation, and tumor killing capacity. 52 –54 Shorter process time and hence vein-to-vein time will also reduce the risk of patient disease progression, improve clinical outcomes, and favor the therapy for prescription by physicians. 55,56 The impact of process time and the resulting cell phenotype should be correlated to cellular dose in early clinical studies.
To decrease the cost of viral vector GMP manufacture, process intensification approaches such as perfusion in suspension-adapted bioreactors and affinity chromatographic purification have the potential to increase yield 57,58 especially for lentivirus vectors expressing next-generation constructs. Our internal data suggest that lentiviral vectors that transduce T cells with complex CAR/TCR constructs engineered with domains to overcome the tumor microenvironment 59,60 are more difficult to produce with high titer. This could be due to transcriptional or translation limitations encountered by the constructs during viral assembly in packaging cell lines. 61,62 GMP cell product release analytics is another key driver of COGS in our study and automation to include more sophisticated in-line testing will reduce the need for sampling and manual transfer to off-line testing thus reducing analytical costs.
Besides COGS, our study indicates that the cost of CMC development is determined by process design and GMP supply chain footprint developed for a cell therapy program. The cost for vector/cell development and tech transfer is directly proportional to the complexity and automation of vector and cell unit operations and the number of sites chosen for GMP manufacture. This is because a larger footprint and lack of process automation require greater number of highly trained personnel for GMP site readiness. Centralized suspension adapted viral vector manufacture will increase process yield 63 and reduce vector development and tech transfer costs to multiple facilities. With investments in overcoming yield bottlenecks for viral vector manufacture our internal experience indicates that a single 500-L bioreactor run may produce enough vector for a single program (≥300 patients/run) thus avoiding larger capital investments for 1,000–2,000-L vector bioreactor facilities to support a portfolio. For cell GMP footprint, our experience indicates that a regional hub model can deliver lower COGS if early investment is made in closed/automated cell processing. 64 In addition, implementation of platform plug and play CMC processes, methods, and formulations across a portfolio of assets will expedite development timelines and impact value generation from cell therapies.
Given the complexity, significant upfront infrastructure investment required and pressures on R&D productivity, articulating a clear path for pipeline value generation is essential for cell therapies. Sensitivity analysis in Fig. 4B indicates that revenue-generating patient number per year and commercial price have an overwhelming impact on value generation. Commercial price is dependent on the market and reimbursement landscape and often out of scope in early development discussions. We have used external benchmarks based on ICER reports ($350,000 per dose per patient) in our study. 65,66 Given the importance of revenue-generating patients on pipeline value, it is best practice during early development for teams to clearly articulate a target medicine profile 67 –69 —containing the Oncology indication of interest and the target patient population, current/future standard of care at product approval, efficacy targets (e.g., overall response rate), safety profile (e.g., neurotoxicity, cytokine release syndrome), dosing and administration (lymphodepletion protocol, dose, in/out patient), COGS, and vein-to-vein time targets.
Revenue-generating patients for any indication are forecasts that teams develop by estimating disease/tumor incidence and discounting for various factors, such a proposed line of treatment, biomarker utilization, antigen expression, HLA allele frequency (for TCR) patient performance rate, geographical/market access rate, antigen class, and cell therapy market share. 37,55,56,60,70 –74 These forecasts are at best estimates based on competitive information available at the time and should be routinely refreshed as new clinical data emerge and standard-of-care benchmarks change. Additionally, while not specifically addressed in this work, teams should proactively consider the regulatory landscape (e.g., available accelerated pathways) early during asset development.
For nonclinically validated targets and supported by tumor antigen expression data, teams may look to conduct pilot studies in more than one tumor indication. Whether one or more target indications are incorporated in the early medicine profile, our modeling suggests that teams should focus development around either a single flagship tumor indication or a subset of tumors with suitable antigen levels that can together surpass the pipeline value generation threshold (>3,000 patients/year). This threshold patient number could be higher or lower depending on productivity (cost/asset) of an R&D organization, but computing and understanding the threshold allow teams to design development plans that focus on high value/high unmet need opportunities. It also enables the development of a cell therapy portfolio that instills the confidence required to continuously invest R&D dollars.
The application of our model to Oncology cell therapies for rare tumors (lower revenue-generating patients/year, <500–1,000/year) suggests that development costs need to be lowered to create pipeline value. When developing for rare tumors, the model prompts teams to consider innovative clinical trial methods (rare cancer registries, factorial designs, adaptive trials with rules for futility, Bayesian approaches) 75 –77 that minimize the total number of patients while maximizing the questions answered. We have computed model development costs to be $550 million. These costs include the assumption of externalized GMP manufacture at one vector and two cell sites (United States, European Union), 5–10 clinical sites for pilot and 30–50 clinical sites for pivotal studies. The model assumes 60 patients dosed in pilot study and 300 patients dosed in pivotal studies. Our calculations indicate that smaller clinical programs with smaller clinical and CMC footprint can reduce development costs by $150–200 million (data not shown), thus creating a path for successful pipeline value generation and a healthy eROI. In conclusion, the model can be used as a tool to design a clinical and CMC development plan that aligns with the commercial opportunity presented by the tumor indication of interest.
The computation of a threshold revenue-generating patient number per year for pipeline value enables teams to proactively plan the positioning of cell therapies in tumor treatment paradigm. Although highly dependent on tumor type, cell therapies may often enter the treatment paradigm in a metastatic or recurrent stage in late line settings 78 –80 where the unmet medical need is high and the target patient population is smaller. Teams must then design a development path which enables generation of efficacy data that allows cell therapies to move up to earlier lines of treatment thus accessing a larger patient pool. This may require investment in next-generation approaches that enhance recognition and killing of the tumor and/or augment the ability of T cells to counteract the immunosuppressive tumor microenvironment. 81,82
The pipeline value generation framework described in this publication can streamline decision making for multigeneration cell therapy development. Using the framework, teams can proactively develop a 5-year plus investment profile that correlates with clinical design and availability of efficacy data. Alternate pipeline value generation scenarios (eROI) can be developed based on proposed line of treatment for market entry and funding envelope required. Clear go/no-go decision criteria coupled with adequately powered clinical studies 83 can expedite product development and enable a clear choice among multiple cell therapy generations. This approach also creates a faster path to interrogate combination of cell therapy with other modalities (e.g., checkpoint inhibitors) 84,85 to enable better efficacy outcomes.
Figure 5 models the impact of time to market on eROI for combinations of cost of development and commercial COGS and illustrates that at cost of development and COGS values that are likely for Oncology cell therapies, short time to market and lower COGS (<$65,000 per dose) are critical to delivering pipeline value. Time to market is driven primarily by the length of clinical studies required to generate registration enabling data. Development teams should consider creative clinical designs such as basket trials for one target across multiple Oncology indications or simultaneous interrogation of multiple targets or multiple asset generations in the same indication to expedite the time to generation of a positive efficacy signal. 86 Science and risk-based approaches to accelerate CMC development should also be considered to reduce development time. 87 Some examples include using phase-appropriate (high-quality not GMP) raw material sourcing and testing to reduce cost and time without sacrificing quality in early clinical studies. 88 A phase-appropriate testing strategy 87 where reporting results on release specifications instead of stringent target range during early clinical studies and complementing characterization testing (correlating cell subfractions with their activation, proliferation, and exhaustion status) with release testing can significantly expedite CMC development. 45,89 Sponsors that have embedded Quality by Design principles will be able to rapidly incorporate process modifications during asset development reducing the risk of decrease to eROI. 90 This involves early documentation of vector and cell critical quality attributes (CQAs) and for any process, method, formulation, equipment or facility change during development, and risk assessing the impact of change on CQAs through bioanalytical testing to establish comparability. 87,91
The upcoming years will see a remarkable upsurge in the number of R&D programs developing cell and gene therapies 92 and exciting clinical data 93 –95 will establish cell therapies as a highly attractive pillar for creating pipeline value and addressing unmet patient need. It is imperative therefore to understand the conditions that will enable development teams to unlock the potential of cutting-edge innovations in this field. Our model suggests that for a given program, proactively planning the development time, cost, and supply chain footprint to align with the commercial opportunity will enable teams to make good decisions during tough scientific discussions and build a case for continued investment. Our approach enables a data-driven framework for portfolio decision making on an organization's internal assets and may also be used to evaluate external opportunities. Our approach may also be used to build a technology investment roadmap to lower cost and to create an organizational workforce plan required to deliver a cell therapy portfolio. Our experience indicates that expedited development of cell therapies will require close collaboration among disciplines (CMC, clinical, biology, regulatory, commercial) and a “non-siloed” organization that can work across boundaries to deliver short cycle time. 96 Governance and decision making for cell therapies need to be nimble 97 to preserve pipeline value and due to shortage of qualified personnel, organizations must work hard to attract, train, and retain talent. 98
Footnotes
Acknowledgments
The authors specially thank Damien O'Farrell, Assistant General Counsel GSK, for intellectual property review.
Author Disclosure
No competing financial interests exist.
Funding Information
No funding was received for this article.