
Abstract
The capsid protein purity of adeno-associated virus (AAV) is considered a critical quality attribute of AAV-based gene therapy products. However, the analytical methods currently available to monitor the viral capsid proteins, which are present in extremely low concentrations, have limited sensitivity and robustness, thus limiting their general applicability. As a result, there is an urgent need to develop robust separation methods with highly sensitive detection. In this article, we describe the first denaturation and fluorescence labeling procedure for AAV capsid proteins using the pyrylium dye Chromeo™ P503, enabling the establishment of the first capillary electrophoresis-sodium dodecyl sulfate (CE-SDS) method combined with laser-induced fluorescence (LIF) detection for AAV. Upon optimization using a quality-by-design approach, the newly developed method features a simple and robust one-step sample preparation workflow resulting in consistently labeled and denatured viral protein samples, which can subsequently be separated and quantified by CE-LIF. The method has been validated to be accurate and precise with a linear range of 50–150% of the nominal concentration of 2.0 × 10¹¹ vector genomes per mL (vg/mL). The detection limit and quantitation limit were established to be 8.0 × 10⁷ vg/mL (∼0.8 ng/mL) and 4.2 × 10⁸ vg/mL (∼4 ng/mL), respectively, representing the highest sensitivity achieved for AAV capsid protein quantitation reported to date and a linear dynamic range of 8.0 × 10⁷–3.0 × 10¹¹ vg/mL. A comparison of the CE-SDS LIF method with existing methods, such as CE-SDS ultraviolet and sodium dodecyl sulfate–polyacrylamide gel electrophoresis with SYPRO Ruby stain, indicated that the new method has superior resolution and a significant increase in signal intensity. Capsid protein purity analysis of multiple AAV serotypes, including AAV5, scAAVrh10, AAV2, and AAV6, has been demonstrated for the first time using the same method, indicating the newly developed AAV labeling procedure and CE-LIF analysis could serve as a Quality Control-friendly platform and best-in-class analytical method for the control of AAV capsid protein purity.
INTRODUCTION
The use of recombinant adeno-associated virus (rAAV) as a gene therapy delivery platform has become widely adopted. 1,2 The AAV capsid is composed of three viral protein (VP) subunits (VP1, VP2, and VP3) in a ratio of 1:1:10 totaling 60 monomers arranged in icosahedral symmetry, with an estimated size of 3.9 MDa. 3 The capsid protein purity is considered a critical quality attribute of a gene therapy product and this attribute is therefore included in the control strategy. Monitoring the capsid protein purity of AAV products requires highly sensitive protein quantitation methods since the protein concentration of AAV samples is low compared to other biologics such as monoclonal antibodies (mAbs).
Size-based electrophoretic separation is commonly used across the industry to monitor the purity of biologics and this method also lends itself well for monitoring AAV products due to the molecular size differences among VP1 (∼87 kDa), VP2 (∼72 kDa), and VP3 (∼62 kDa). 4 The AAV capsid proteins are first denatured to generate VP subunits, which are subsequently separated and quantitated. Sodium dodecyl sulfate–polyacrylamide gel electrophoresis (SDS-PAGE) combined with SYPRO Ruby staining is currently considered the “gold standard” and, although labor-intensive, the method is well-established and commonly used for monitoring the purity of many therapeutic proteins, including the AAV capsid. 5 –8 However, SDS-PAGE is not considered a Quality Control (QC)-friendly platform since it is semiquantitative, provides data in a nondigital format, and requires multiday processing. While the current gel image processing software can render an electropherogram from the gel image, the results cannot be quantitated with sufficient accuracy compared to other analytical platforms. 9
During the past decade, the biopharmaceutical industry has been transitioning from traditional SDS-PAGE gels to quantitative formats such as capillary gel electrophoresis (also known as capillary electrophoresis–sodium dodecyl sulfate [CE-SDS]) to replace SDS-PAGE. 10 –12 CE-SDS is now commonly used to determine the protein purity of therapeutic proteins, especially mAbs, due to the simplified sample preparation and direct ultraviolet (UV) detection. Both nonreducing and reducing conditions have been widely adopted to quantitate the main peak purity and the impurities in in-process intermediates as well as in drug substance and drug product samples. 13 –15
Despite the success of CE-SDS for the analysis of mAbs, the implementation of this technique for the analysis of AAV capsid proteins has been challenging due to the low protein concentration in AAV samples. With the genome titer for AAV products typically ranging from 1 × 10¹¹ to 1 × 10¹³ vector genomes per mL (vg/mL), the starting protein concentration is usually at the ng/μL level, which is 4–5 orders of magnitude lower than the typical concentration range encountered for mAbs (10–100 μg/μL). As a result, the commonly used UV-based detection methods are not sufficiently sensitive to analyze AAV samples unless the sample is concentrated before analysis pre-column, on column, or a combination of both. Only one previous report demonstrated that pre-concentration increased the UV signal intensity sufficiently to allow detection of VP1, VP2, and VP3 peaks above the quantitation limit (QL). 16 However, a major concern with pre-concentration is the requirement for excessive sample manipulation, for example, using centrifugal membrane filters and sample stacking in the capillary. These types of sample manipulation could result in sample loss due to adsorption onto the membrane filters or instability of the sample in the final buffer or at the final concentration level required to obtain sufficient signal intensity. Finally, the UV baseline of CE-SDS electropherograms is typically noisy due to the nonspecific absorbance from the gel matrix. This impacts the ability to accurately quantitate the low-intensity capsid protein peaks and has made it difficult to establish a UV-based method for AAV.
Compared to UV detection, laser-induced fluorescence (LIF) detection is significantly more sensitive and numerous publications describe the use of either covalently or noncovalently bound fluorescent dyes in combination with CE-SDS LIF to monitor the purity of a variety of proteins, including the successful implementation of CE-SDS LIF as a good manufacturing practices release method to determine the purity of mAbs. 17 –19 The reduction of background noise combined with the superior signal intensity of the protein-dye complex result in well-resolved electropherograms with favorable signal-to-noise (s/n) ratios, thus greatly enhancing the ability to analyze low-concentration protein samples and monitor low-level impurities. However, after years of effort, the use of CE-SDS LIF to analyze AAV gene therapy products has remained elusive, mostly due to the challenges encountered with the low concentration of the sample and the complex matrix background. In addition, the residual dye and toxic reagents commonly used to catalyze labeling reactions also significantly interfere with VP separation and detection and create additional safety concerns. As of today, the analytical challenge of being able to analyze AAV capsid protein purity with sufficient sensitivity remains unresolved.
In this article, we describe, for the first time, a new strategy consisting of stable and consistent fluorescent labeling of AAV capsid proteins using the pyrylium dye Chromeo™ P503 followed by CE-LIF separation and quantitation of the different capsid proteins. The newly established one-step sample preparation workflow for AAV consists of mixing the test sample with dye-containing sample buffer, heating it to simultaneously denature and label the protein, and transferring the cooled-down mixture to the CE instrument to perform the separation. The workflow does not require any sample pre-concentration, buffer exchange, separate labeling, and/or dye removal steps, nor does it include toxic reagents. To evaluate the improvement obtained using the LIF-based method relative to the existing methods established for AAV, several samples were analyzed using CE-SDS LIF, CE-SDS UV, and SDS-PAGE. The comparison indicates that the newly developed method has greatly improved accuracy, precision, and sensitivity compared to the other two methods and demonstrates significant potential for use as the next-generation capsid protein purity assay for monitoring AAV-based gene therapy products.
EXPERIMENTAL
Materials
Acidic wash solution (0.1 N HCl), basic wash solution (0.1 N NaOH), SDS-MW gel buffer (proprietary formulation), and SDS-MW sample buffer (100 mM Tris-HCl pH 9.0, 1% SDS) were purchased from Sciex (Framingham, MA). Ten percent (w/v) SDS solution was purchased from Bio-Rad Laboratories, Inc., (Richmond, CA). Dimethyl sulfoxide (DMSO), sodium bicarbonate, 1 M
Four AAV samples representing different serotypes, including rAAV5 (1.0 × 10¹³ vg/mL), scAAVrh10 (3.5 × 10¹² vg/mL), rAAV2 (9.0 × 10¹² vg/mL), and rAAV6 (1.3 × 10¹³ vg/mL), each containing ∼30–100 μg/mL VP content, were provided by Sanofi R&D (Framingham, MA). Degraded rAAV5 was prepared by incubating the material at 100°C in a water bath for 10 min. The samples were stored at −80°C and thawed immediately before initiating the analysis.
CE-SDS LIF sample preparation
Unless stated otherwise, 20 μL of 1.0 × 10¹² vg/mL AAV5 sample (or water for blank) was added to a 1.5 mL microcentrifuge tube containing 65 μL of 16.7 mM sodium bicarbonate buffer (pH 8.3), 5 μL of 1 M DTT, 5 μL of 10% SDS solution in water, and 5 μL of 1 mg/mL Chromeo P503 dissolved in DMSO. The solution was mixed by vortexing and incubated at 93°C for 8 min to denature the sample and conjugate the dye to the viral capsid proteins. The sample mixture was then allowed to cool down at room temperature, followed by a brief vortexing and centrifugation step. A volume of 90–95 μL of the final solution was transferred into a CE autosampler vial for injection.
CE-SDS LIF instrument setup
CE was performed using a Beckman Coulter PA800Plus CE system (Sciex) equipped with a 488 nm laser module. Detection was performed using a 600 nm bandpass filter with 80 nm full width at half maximum (Edmund Optics, Barrington, NJ). A preassembled capillary cartridge for CE-SDS applications (bare fused silica capillary of 50 μm inner diameter and 30.2 cm total length with 20.2 cm effective separation length) was used. Before starting a sample sequence, the capillary was rinsed sequentially with 0.1 N NaOH (10 min at 20 psi), 0.1 N HCl (5 min at 20 psi), water (2 min at 20 psi), and SDS-MW Gel Buffer (10 min at 70 psi). Before each sample injection, the capillary was rinsed sequentially with 0.1 N NaOH (3 min at 70 psi), 0.1 N HCl (1 min at 70 psi), water (1 min at 70 psi), and SDS-MW Gel Buffer (10 min at 70 psi). The samples were injected by applying a voltage of −10 kV for 20 s. Separation was performed by applying a voltage of −15 kV for 35 min, while maintaining a pressure of 20 psi on both ends of the capillary. At the end of each sample sequence, the capillary was rinsed sequentially with 0.1 N NaOH (10 min at 70 psi), 0.1 N HCl (5 min at 70 psi), water (2 min at 70 psi), and SDS-MW Gel Buffer (10 min at 70 psi).
CE-SDS UV procedure
CE with UV detection was performed using a photodiode array detector. The CE instrument, capillary cartridge, and instrument method were the same as described in the CE-SDS LIF section. When sample stacking was used, a water plug (0.4 min at 20 psi) was injected into the capillary before the electrokinetic sample injection. Three different sample preparation approaches were evaluated: (i) sample used “as is” without pre-concentration: 25 μL of 5.0 × 10¹² vg/mL AAV5 sample, 5 μL of BME, and 70 μL of SDS-MW sample buffer were added to a 1.5 mL microcentrifuge tube, mixed, and incubated at 95°C for 15 min. After cooling down and mixing, the solution was transferred to CE autosampler vials. (ii) Sample loaded using on-column stacking: 4.5 μL of 5.0 × 10¹² vg/mL AAV5 sample, 1.5 μL of BME, and 6 μL of 4% SDS were mixed in a 1.5 mL microcentrifuge tube and incubated at 95°C for 15 min. This solution was buffer exchanged twice to 0.5 mg/mL SDS and 5% BME using 10 kDa MWCO Amicon spin filters. 90 μL of water was subsequently added to the solution before transferring to CE autosampler vials. (iii) Sample pre-concentrated and loaded using on-column stacking: an AAV5 sample at 1.0 × 10¹³ vg/mL was first desalted and pre-concentrated 10-fold using 10 kDa MWCO Amicon spin filters. A volume of 5 μL of the concentrated AAV5 sample was mixed with 5 μL of 1% SDS and 1.5 μL of BME. After incubating the sample at 93°C for 8 min, 90 μL of water was added. The sample was mixed and transferred to CE autosampler vials.
SDS-PAGE with SYPRO Ruby stain
Samples were prepared in a 1.5 mL microcentrifuge tube by mixing 26 μL of 1.0 × 10¹² vg/mL AAV sample (for high load), 5.0 × 10¹¹ vg/mL AAV sample (for low load), or water (for blank) with 4 μL of 10 × sample reducing agent and 10 μL of 4 × LDS sample buffer. The mixture was incubated at 93°C for 8 min to denature the samples. The sample mixtures were then cooled down at room temperature followed by a brief vortexing and centrifugation step. A XCell SureLock™ Mini-Cell gel box was set up with a 4–12% Bis–tris gel and connected to a PowerEase® 500 Power Supply (ThermoFisher Scientific). 1 × MOPS SDS sample buffer with antioxidant (400 × dilution) was added to the upper buffer chamber and 1 × MOPS SDS sample buffer was added to the lower buffer chamber. The samples and controls were loaded onto the gels using a volume of 15 μL per well. The high-load or low-load sample was analyzed in triplicate. A constant voltage of 200 V was applied to the gel for 50 min. The gel was rinsed in fixing solution (50% methanol, 7% acetic acid, and 43% water) for a total of 60 min, and then stained overnight in SYPRO Ruby protein gel stain. The gel was rinsed in washing solution (10% methanol, 7% acetic acid, and 83% water) for 30 min, followed by 10 min of rinsing in water. The gel was then imaged on a Chemidoc™ MP gel imaging system (Bio-Rad Laboratories, Inc., Richmond, CA) with an image exposure time of 5 s. The resulting gel image was analyzed using the TotalLab™ gel analysis software (TotalLab Ltd., Newcastle, United Kingdom). Percent purity was calculated by dividing the band volume of VP1, VP2, and VP3 by the total band volume (sum of VP1/VP2/VP3 band volume and impurity band volume) and multiplying by 100%.
RESULTS AND DISCUSSION
Fluorescent dye selection
QC laboratories have historically used covalent dyes to ensure robust and consistent conjugation as well as adequate stability of the conjugated sample. Several dyes for modifying mAbs before analysis by CE-SDS have been reported previously, such as 5-carboxytetramethylrhodamine succinimidyl ester 17 and 3-(2-furoyl) quinoline-2-carboxaldehyde. 18,19 However, these dyes require either a dye cleaning step or the presence of toxic cyanide as part of the labeling reaction and this has been a major impediment to the implementation of this approach despite the sensitivity benefit from LIF.
In this work, we established a highly sensitive protein quantitation method for AAV samples by conjugating a high quantum yield pyrylium dye to the primary amines of the capsid proteins. Upon conjugation, the fluorophore undergoes a large spectral shift (>100 nm) toward shorter wavelengths and a dramatic increase in the quantum yield from <1% to 50%. These two characteristics allow detection of labeled proteins without a requirement to remove excess unconjugated dye. 20 –22 Stable covalent modification of the capsid proteins with the pyrylium dye is readily obtained at the temperature used to denature the sample before CE-SDS analysis. In addition, there is no requirement for the presence of cyanide in the labeling reaction allowing sample denaturation and labeling to be performed in a single step, thus significantly simplifying sample preparation. 23
Dye concentration
To optimize the fluorophore conjugation method, a quality-by-design approach was adopted. This included systematic identification of the critical method parameters through a risk assessment and subsequent optimization of the critical parameters using a design of experiment (DoE) approach. The dye-to-protein (D/P) ratio is considered one of the critical method attributes that directly impacts method specificity and robustness, and a univariate study was conducted to optimize the D/P ratio using two different labeling approaches. As the protein concentration is a limiting factor in AAV products, the dye amount was varied, while keeping the AAV concentration constant at 2.0 × 10¹¹ vg/mL. In the first approach, the label was added before the denaturation step, which is performed at 93°C for 8 min. In this case, the protein denaturation and labeling occur at the same time. In the second approach, the viral capsid proteins were first denatured at 93°C for 8 min without dye present. The dye was subsequently added, and the sample was incubated at 37°C for 1 h.
The results obtained are shown in Fig. 1 and indicate that the reaction temperature directly impacts the dye conjugation rate. The labeling reaction performed at the higher temperature (approach 1) quickly reached a plateau at a dye concentration of ∼0.05 μg/μL. Since the dye was dissolved in DMSO, adding more dye to the sample increased the DMSO concentration, which affected the stability of the sample resulting in a significant decrease of the total peak area at a dye concentration of 0.15 μg/μL. However, when a more concentrated dye solution was used to prepare the sample, the signal obtained was consistent with the plateau value reached at a dye concentration of 0.1 μg/mL. The results obtained for the second approach, where the labeling was performed at 37°C for 1 h, are shown in Fig. 1B. This procedure resulted in comparable electrophoretic profiles compared to the first labeling approach, although a higher dye amount was required to obtain equivalent labeling efficiency due to the lower incubation temperature. Moreover, under these conditions, the labeling reaction did not run to completion within the established incubation time and the signal continued to increase over time.

Optimization of sample preparation conditions and dye-to-protein ratio.
To improve the stability of the sample before and during analysis, the reaction was quenched by either adding excess hydroxylamine or changing the pH. However, this approach caused various artifacts in the electropherogram as the harsh quenching conditions resulted in protein degradation. Therefore, the first approach using a dye concentration of 0.05 μg/μL and an incubation condition of 93°C for 8 min was selected to allow one-step denaturation and labeling. With 0.05 μg/μL dye and 2.0 × 10¹¹ vg/mL sample in the working solution, the D/P ratio is estimated to be 25:1 (w/w), preventing baseline elevation that was observed at higher D/P ratios, which may potentially impact the detection and integration of VP fragments. At the optimum dye condition, all three VPs were baseline separated and could be readily quantified resulting in a stoichiometry of VP1:VP2:VP3 = 1.0:1.5:10.5 (Fig. 1C), and a consistent purity result regardless of changes in the D/P ratio. The slight difference between the measured and the expected stoichiometry is likely due to the presence of partial capsids as reported previously. 24 In addition to the three main peaks, the high resolution and flat baseline of the electropherogram allowed for the detection and quantification of several fragment impurities and VP variants (Fig. 1D).
Optimization of labeling conditions
Since protein denaturation and labeling are combined in a single step, it is important to optimize the reaction conditions to achieve reproducible fluorophore conjugation with minimal method-induced artifacts. Four key parameters with the potential to interact: incubation temperature (heat temperature; 90–95°C), incubation time (heat time; 6–12 min), sample buffer pH (7.6–9.0), and buffer type (bicarbonate vs. phosphate) were evaluated using a full factorial design with center point correction created using JMP software (Cary, NC). The results were fit with a model to predict the impact of changing the parameter across the evaluated range on the total peak area or purity (Fig. 2). The impact of increasing the heating temperature and time during sample preparation on protein degradation has been well documented 25,26 ; however, a high temperature is required to exceed the AAV5 melting temperature of ∼90°C. Our DoE results indicated that the total peak area increased when the sample was subjected to a higher temperature or a longer time due to the increased fluorophore conjugation rate. At the same time, the purity (sum of VP1–3 peak area divided by total peak area) decreased due to heat-induced fragmentation, but the change was minimal unless the sample was subjected to a prolonged heat time. Based on the DoE, it was determined that an incubation condition of 93°C/8 min resulted in robust denaturation of the AAV5 capsid proteins, while minimizing any method-induced artifacts. These parameters were therefore selected as the optimized incubation condition.
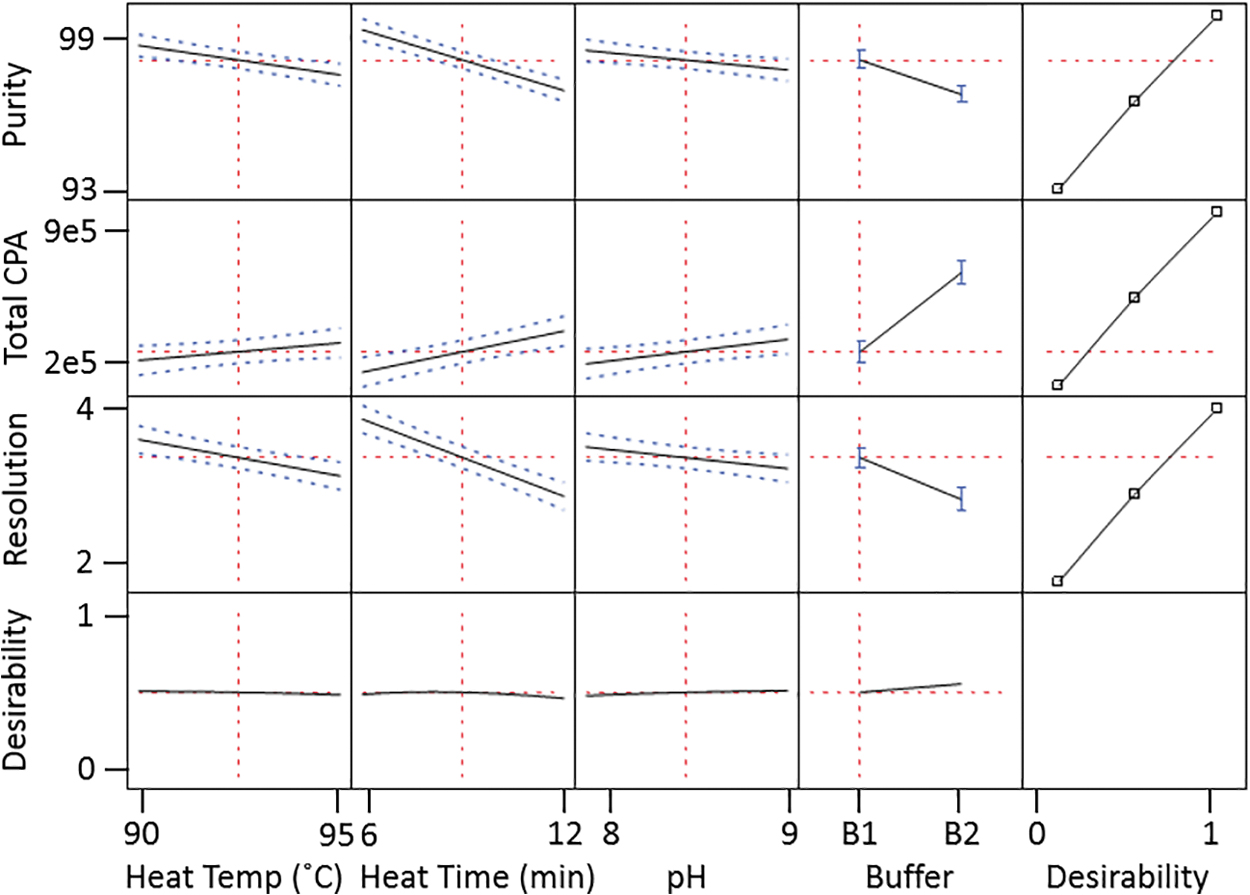
Optimizing denaturation condition through design-of-experiment.
The optimization of buffer type and pH was performed by evaluating the impact of these parameters on purity and total peak area, while simultaneously taking the requirements for the conjugation reaction into consideration. Since the pKa of the primary amine from lysine residues is >10, a slightly basic pH environment as well as an amine-free buffering system are required when using an amine-reactive fluorophore. Bicarbonate buffer at pH 8.3 was selected to allow for an effective labeling reaction, while maintaining high resolution and purity.
Method validation
The CE-SDS LIF method was validated following International Council for Harmonisation (ICH) guidelines. 27 Method linearity was evaluated at 50%, 75%, 100%, 125%, and 150% of the nominal concentration of 2.0 × 10¹¹ vg/mL using a constant dye concentration. Three determinations were obtained at each level and the linear fit was obtained by plotting the total peak area as a function of the vector genome concentration. Linear regression of the data points resulted in y = 2.5e−5 x + 4.8 × 10⁶ and r 2 = 0.9927, indicating good linearity for samples containing AAV5 levels ranging from 1.0 × 10¹¹ to 3.0 × 10¹¹ vg/mL, even though the dye to protein ratio varied across the range. Relative accuracy was evaluated by comparing the percent peak area of each of the VP1, VP2, and VP3 peaks at the 50%, 100%, and 150% levels to the mean percent peak areas of the corresponding peak at the nominal level (100%). The percent peak area of the three VP peaks at all three levels was determined to be within 98–104% of the results obtained for the nominal sample, indicating the method is accurate throughout its linear range. Although the validation of the method was performed within a limited range, it is important to note that the actual linear dynamic range of the method extends well beyond its validated linear range. When the established detection limit (DL) is taken into consideration, the actual linear dynamic range of the method covers nearly four orders of magnitude and ranges from 8.0 × 10⁷ to 3.0 × 10¹¹ vg/mL.
Intermediate precision of the method was assessed by having two different analysts perform two runs on two instruments using two capillary cartridges and two reagent sets. Each run consisted of six individually prepared test solutions at the nominal level. The results were analyzed by determining the relative standard deviation (%RSD) of the percent peak area of each of the VP1–3 peaks, %RSD of purity, and %RSD of total peak area for Run 1 (n = 6), Run 2 (n = 6), and Run 1 + 2 (n = 12). The results indicated that the %RSD for total purity is 0.2%, and the %RSD for the percent peak area of the capsid proteins (VP1–3) ranged from 0.1% to 2.2%, while the %RSD for the total peak area ranged from 1.2% to 2.0%. The variability of the total peak area was only evaluated within each run since fluorescence units cannot be directly compared between different instruments.
The practical DL and practical QL were established by evaluating selected impurity peaks present in the electropherograms of an AAV5 sample. Across the six individual determinations, the United States Pharmacopeia s/n ratio was 4.0–5.9 for the 15.1 min peak (practical DL) and 13.6–18.1 for the 15.5 min peak (practical QL). The %RSD of the absolute peak area and percent peak area of both peaks range from 1.3% to 2.2% (n = 6). Based on these results, the practical %DL was determined to be 0.04% peak area (8.0 × 10⁷ vg/mL or ∼0.8 ng/mL) and the practical QL was determined to be 0.21% peak area (4.2 × 10⁸ vg/mL or ∼4 ng/mL), indicating that the method is highly sensitive and capable of detecting and quantitating samples with capsid protein concentrations in the ng/mL range. Figure 3 illustrates the impurity profile obtained for an AAV5 sample.
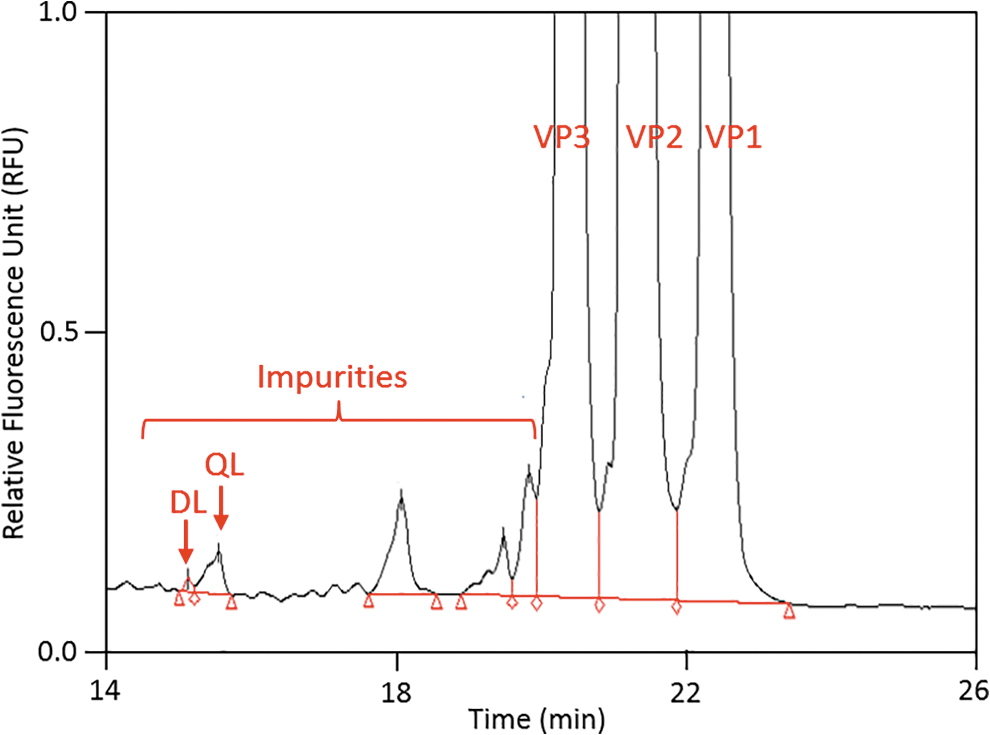
Expanded electropherogram illustrating the impurity levels. The practical DL and QL were evaluated based on impurities observed from the peak profile. QL, quantitation limit; DL, detection limit.
To evaluate the autosampler stability, six individually prepared samples were injected immediately after preparation and again after being stored in an autosampler at 15°C for 24 h. The purity and total peak area results were compared between the two injections on day 1 and 2. Consistent electropherograms were observed from both intraday and interday injections. After 1 day of storage, a minor decrease in peak height and a slight increase in the peak width were observed, although the change in purity was <0.1% with no detectable change in the peak profile. Since similar changes are commonly observed when mAb samples subjected to CE-SDS UV analysis are stored under similar conditions, it was concluded that both the covalently modified samples and the fluorescent label were stable for at least 24 h when stored in an autosampler maintained at 15°C.
Specificity of the method was assessed by confirming the absence of matrix interference of commonly used formulation buffers and surfactants. In addition, an evaluation of degraded samples indicated that the method is stability indicating (see Fig. 4 and section below).
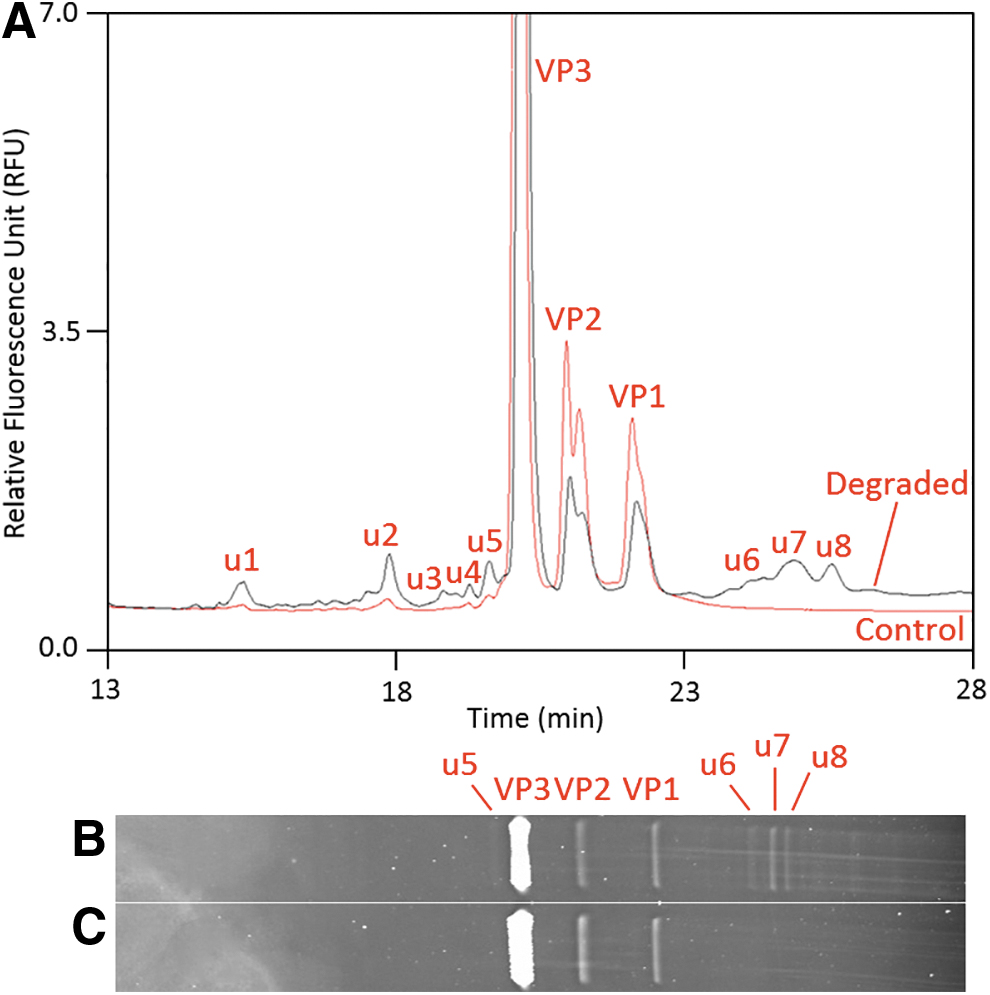
Comparison between CE-SDS LIF and SDS-PAGE with SYPRO Ruby stain.
Comparison between CE-SDS LIF and SDS-PAGE with SYPRO Ruby stain
SYPRO Ruby is a highly sensitive fluorescent stain that allows the detection of low-abundance proteins separated in polyacrylamide gels. This technique has been used to monitor the purity of AAV capsid proteins and is currently considered the industry standard. To compare the results between CE-SDS LIF and SDS-PAGE with SYPRO Ruby stain, both a degraded AAV5 sample and a nondegraded control were prepared and analyzed. As shown in Fig. 4A, the VP1, VP2, and VP3 peaks decreased and fragments as well as aggregates were observed in the degraded samples (labeled as u1–u8). The CE-SDS LIF results indicated that the purity of the control sample was 98.8% compared to 85.7% for the degraded sample. The same samples were analyzed by SDS-PAGE using a side-by-side comparison. Both low load (for quantitation) and high load (for maximum image signal) were analyzed, although only the image displaying the high-load samples is shown in Fig. 4 for ease of comparison. The gel image of the nondegraded sample only shows the three major VP bands, resulting in a purity of 100% (Fig. 4C). In contrast, additional impurities were observed in the degraded sample and although the three additional high molecular weight bands migrating above the VP1 band closely aligned with the CE-SDS LIF profile, a significant number of low molecular weight impurities migrating immediately below the VP3 band were only detected by CE-SDS LIF and were not visible in the gel image, suggesting that SDS-PAGE has limited capability for monitoring low molecular weight impurities (Fig. 4B). The purity of the degraded sample as determined by SDS-PAGE with densitometry was 88%.
A comparison of the two analytical platforms shows that, in general, the peak profiles for nondegraded and degraded samples are similar and that the calculated capsid protein purity values are consistent, although the SDS-PAGE appears to overestimate capsid protein purity due to its lack of sensitivity to detect low molecular weight species. Based on the comparison performed, it is evident that CE-SDS LIF not only shortens the assay time from days to hours but also generates higher sensitivity, better resolution, and more accurate quantitation compared to SDS-PAGE.
Comparison between CE-SDS LIF and UV detection
To assess the benefits of LIF detection versus UV detection, a side-by-side comparison was performed using AAV5. For UV detection, three different sample preparation strategies were used as described in the methods section to maximize peak intensity, and the results are shown in Fig. 5. Based on the results, it is evident that analyzing an AAV sample without performing a pre-concentration step does not provide adequate signal intensity. Although the VP1 and VP2 peaks are visible, the intensity is not sufficient for consistent quantitation of the peaks observed in the electropherogram. The desalted AAV sample, which was loaded into the capillary using on-column sample stacking, shows a significant increase in signal intensity. However, this sample preparation approach negatively impacts the resolution, making it difficult to identify and quantitate capsid protein variants. Figure 5A shows the electropherogram of a sample that has been subjected to both pre-concentration and on-column stacking, and the peak profile looks comparable to the CE-SDS LIF peak profile generated using representative AAV5 samples (Fig. 3). The baseline observed with UV detection shows significant curvature and noise compared to LIF detection. Compared to the CE-SDS UV method with a DL typically observed to be around 1 μg/mL of protein, the DL at 8.0 × 10⁷ vg/mL (∼0.8 ng/mL) established for the CE-SDS LIF method represents at least three orders of magnitude increase in sensitivity based on the s/n ratio.
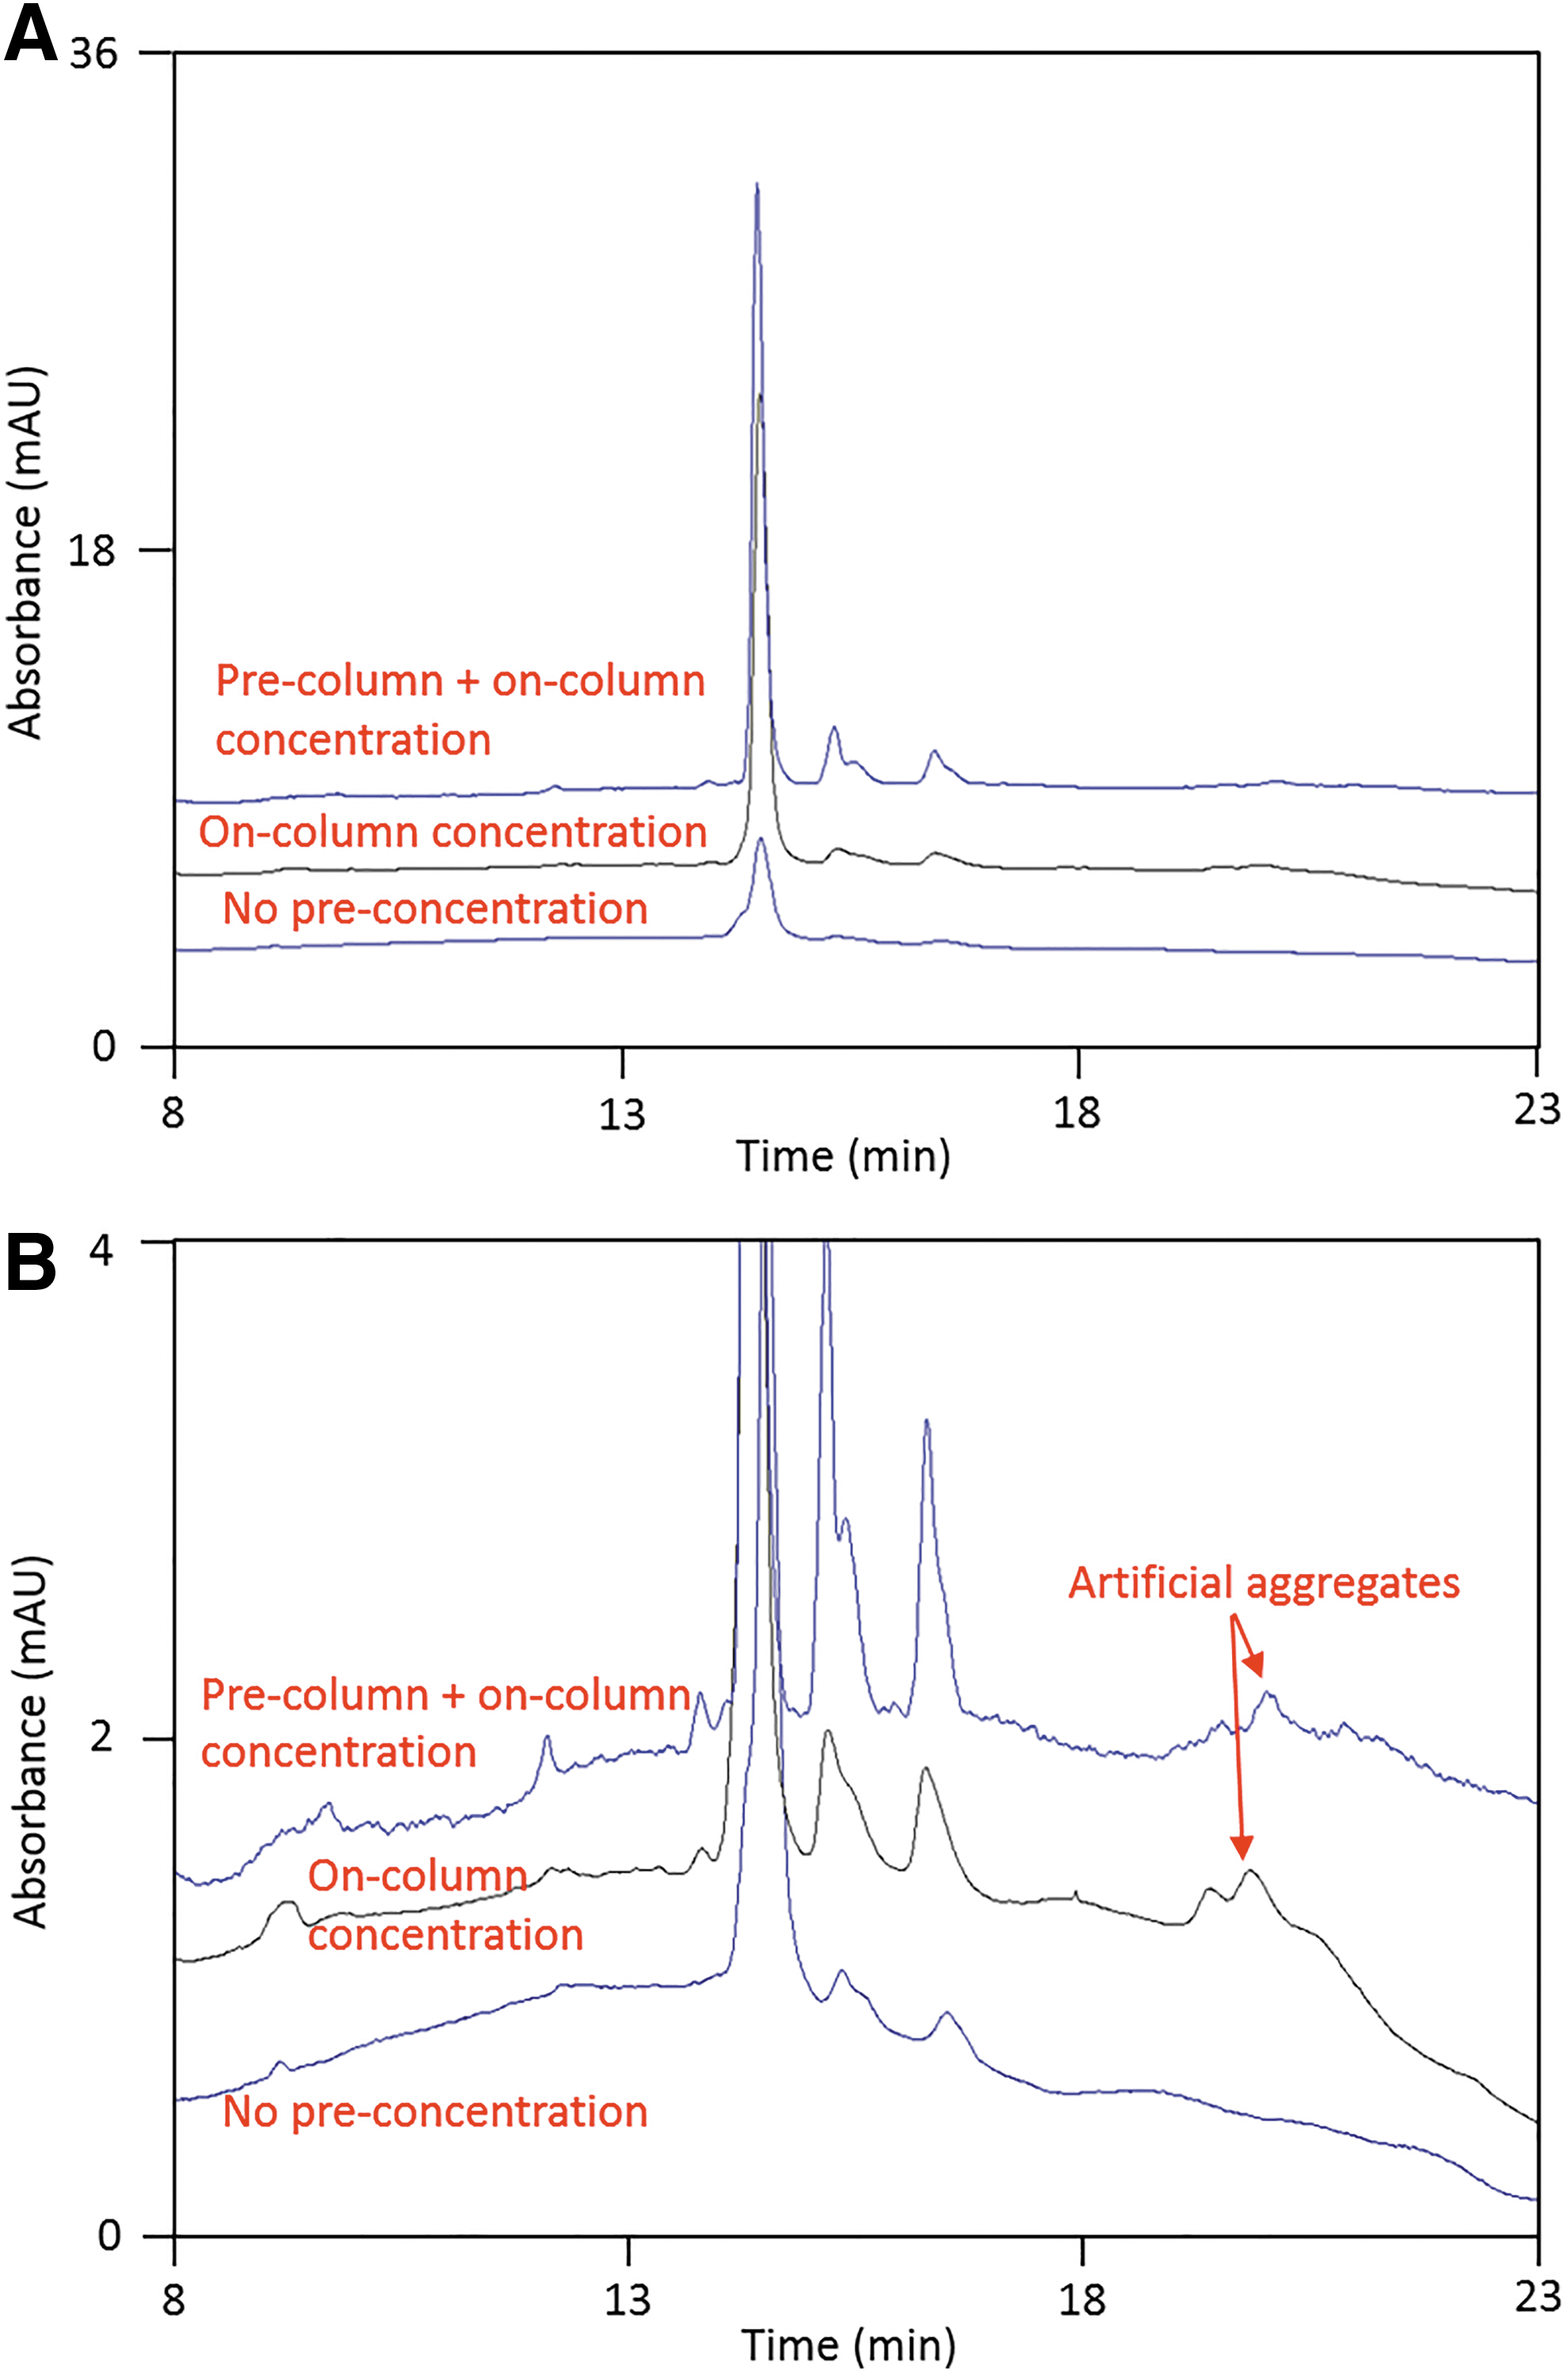
Analysis of AAV5 using CE-SDS UV.
The electropherograms from Fig. 5A are further expanded in Fig. 5B. One major issue from UV detection is the nonspecific absorption of the gel matrix, which causes baseline interference. 28 The interference of the gel matrix is significantly lower when fluorescence detection is used resulting in flat baselines as shown in Fig. 1D. Another finding from the expanded electropherograms is the presence of method-induced artifacts on the high molecular weight side. Three aggregate peaks, similar to those detected in degraded material using CE-LIF and SDS-PAGE in Fig. 4, were observed at around 20 min in the CE-SDS UV electropherograms of the un-degraded control sample. Since these peaks only appear after sample filtration and on-column stacking, it is likely that sample aggregation was caused by the sample preparation and/or loading procedure.
Based on the comparison performed between CE-SDS UV and CE-SDS LIF, it is concluded that, although the AAV5 capsid protein peak profiles are similar, CE-SDS LIF has a vastly improved signal intensity. While pre-column and on-column sample concentration could enhance the UV signal intensity, it was found to lead to the formation of method-induced aggregates and potential sample loss during filtration. Compared to UV, the LIF detection improves signal intensity by ∼4 orders of magnitude, resulting in significantly higher and sharper peaks, better resolution, flatter baselines, and minimizing the formation of method-induced impurities.
Applicability of CE-SDS LIF to determine capsid protein purity of different AAV serotypes
A variety of AAV serotypes have been adopted as gene therapy delivery vehicles depending on the desired target tissue and the intended therapeutic strategy. It is therefore important to establish a purity method that can be used as a platform to monitor the capsid protein purity from different AAV serotypes without requiring further serotype-specific method optimization. Although the established CE-SDS LIF method was validated using AAV5, additional serotypes, including AAVrh10, AAV2, and AAV6, were evaluated using the established method. Since the different AAV serotypes have different melting temperatures, ranging from 65°C to 70°C for AAV2 and up to ∼90°C for AAV5, 5,29 the sample denaturation temperature was adjusted based on the melting temperature reported for the different capsids. As illustrated in Fig. 6, all AAV serotypes evaluated showed clearly resolved VP1–3 peaks, including baseline separation of the truncated versions of the VP1–3 subunits and other impurities present in the samples. The truncated VP3 peak was detected in AAV2, AAV6, and AAVrh10 samples, while this peak is not present in AAV5. Instead, AAV5 samples contain split VP1 and VP2 peaks, although this is not observed in other serotypes. The presence of split VP1 and VP2 peaks was also observed in the CE-SDS UV results presented in this article (Fig. 5).

Overlay of electropherograms from four different AAV serotypes.
To determine the capsid protein purity of each sample, the percent area of each VP peak was determined, and the results are summarized in Table 1. The overall purity observed for the four different serotypes evaluated ranged from 98% to 99%, with the balance consisting of multiple small impurity peaks, which were detected due to the high sensitivity of the CE-SDS LIF method. The VP1–3 ratios for the different serotypes were found to vary slightly, ranging from VP1:VP2:VP3 = 1.0:1.3–1.5:8.6–10.5. While the VP expression and capsid assembly can be impacted by the manufacturing process, the final ratios determined by CE-SDS LIF were found to be close to the theoretically expected ratio of VP1:VP2:VP3 = 1:1:10. The consistency of the results obtained for the different serotypes highlights the capability of CE-SDS LIF as a platform method for determining the purity and VP ratios of different AAV serotypes.
Purity results from four different adeno-associated virus serotypes
ND, not detected; rAAV, recombinant adeno-associated virus; VP, viral protein.
CONCLUSIONS
This article describes, for the first time, the development and application of a novel CE-SDS LIF method using a pyrylium dye Chromeo P503 for monitoring AAV capsid protein purity. To allow for rapid adoption of this method in a regulated QC environment, it was designed and optimized to only require a one-step sample preparation, thus eliminating the need for sample pre-concentration, buffer exchange, or dye cleaning steps that have been known to cause sample loss and method-induced artifacts. The method was optimized using a quality-by-design approach and was validated according to the current ICH guidelines. Compared with existing AAV capsid protein purity methods (SDS-PAGE and CE-SDS UV), the newly developed AAV labeling and quantitation strategy have shortened the assay time from days to hours and significantly enhanced the ability to detect protein impurities or fragment peaks. The sensitivity of the new CE-SDS LIF method is estimated to be four orders of magnitude greater than the CE-SDS UV method and the sample preparation procedure does not create method-induced artifacts. In addition, for the first time, the CE-SDS LIF method has been successfully applied to determine the capsid protein purity and the capsid protein stoichiometry of the different AAV serotypes, indicating its suitability as a true platform for the analysis of different AAV products and serotypes. Based on its performance and robustness, the novel analytical platform described in this article is expected to become the new standard for determining the purity of AAV products.
Footnotes
ACKNOWLEDGMENTS
The authors would like to thank Michelle Joubert, Jarrod Dean, Dr. Francis Poulin, and Dr. Ying Xu for providing AAV samples. The authors would also like to acknowledge Hannah Maheno, Dr. Simon Godwin, and Mandy Hulbert for the critical discussions. Z.Z. thanks Dr. Mukesh Malik and James Dougherty from Sciex for hardware support.
AUTHOR DISCLOSURE
No competing financial interests exist.
FUNDING INFORMATION
The authors received no financial support for the research, authorship, and/or publication of this article.