
Abstract
Immune checkpoint inhibitors have advanced the treatment of melanoma. Nevertheless, a majority of patients are resistant, or develop resistance, to immune checkpoint blockade, which may be related to prevailing immune suppression by myeloid regulatory cells in the tumor microenvironment (TME). ORCA-010 is a novel oncolytic adenovirus that selectively replicates in, and lyses, cancer cells. We previously showed that ORCA-010 can activate melanoma-exposed conventional dendritic cells (cDCs). To study the effect of ORCA-010 on melanoma-conditioned macrophage development, we used an in vitro co-culture model of human monocytes with melanoma cell lines. We observed a selective survival and polarization of monocytes into M2-like macrophages (CD14+CD80−CD163+) in co-cultures with cell lines that expressed macrophage colony-stimulating factor. Oncolysis of these melanoma cell lines, effected by ORCA-010, activated the resulting macrophages and converted them to a more proinflammatory state, evidenced by higher levels of PD-L1, CD80, and CD86 and an enhanced capacity to prime allogenic T cells and induce a type-1 T cell response. To assess the effect of ORCA-010 on myeloid subset distribution and activation in vivo, ORCA-010 was intratumorally injected and tested for T cell activation and recruitment in the human adenovirus nonpermissive B16-OVA mouse melanoma model. While systemic PD-1 blockade in this model in itself did not modulate myeloid or T cell subset distribution and activation, when it was preceded by i.t. injection of ORCA-010, this induced an increased rate and activation state of CD8α+ cDC1, both in the TME and in the spleen. Observed increased rates of activated CD8+ T cells, expressing CD69 and PD-1, were related to both increased CD8α+ cDC1 rates and M1/M2 shifts in tumor and spleen. In conclusion, the myeloid modulatory properties of ORCA-010 in melanoma, resulting in recruitment and activation of T cells, could enhance the antitumor efficacy of PD-1 blockade.
INTRODUCTION
Melanoma is highly immunogenic, which explains its relative amenability to immunotherapy, but at the same time calls for powerful immune escape to allow melanoma tumors to grow and spread in the first place. 1,2 As a result, melanoma rapidly converts its tumor microenvironment (TME) into an immune suppressed state. This multifactorial suppression can also result in primary or acquired resistance to immune checkpoint blockade. 3,4 Tumor-associated M2-like macrophages (TAMs) are often the most abundant immune cell type in the tumor milieu and may play a dominant role in maintaining this immune suppressed and T cell-excluded microenvironment. 5 –8
Like all macrophages, TAMs found at the tumor site may develop either from recruited monocytes 9 or are tissue-resident macrophages and can acquire a phenotype positioned anywhere along the continuous spectrum from immune-suppressive M2 to T cell-stimulatory M1, depending on environmental cues. 10 –13 In vivo, the release of macrophage-colony stimulating factor (M-CSF), TGF-β, interleukin (IL)-6, and/or IL-10 by melanoma converts monocytes into CD163+ M2-like macrophages. 14 –16 These cells themselves release soluble factors that dampen dendritic cell (DC) responses, 17 and attract T regulatory (Treg) cells. 18 Through the release of IL-10, they ultimately exclude CD8+ T cells from their surroundings, 6,19 and support the tumor's progression. 20,21 On the opposite end of the continuous polarization spectrum, M1-like macrophages can release proinflammatory signals (IL-1β, IL-12, and tumor necrosis factor alpha [TNF-α]) and promote a CD8+ T cell-mediated antitumor response through antigen presentation and co-stimulation through CD80 and CD86. 5,22,23
Oncolytic adenoviruses (OAdVs) have entered clinical development and have shown favorable safety profiles; they are now being investigated as adjuvant therapies, alone or combined with chemotherapy or immunotherapy for melanoma, pancreatic cancer, and glioma (as recently reviewed 24 ). Their role extends beyond simply inducing oncolysis. By inducing immunogenic cell death (ICD), 25,26 danger-associated molecular patterns (DAMPs) and (neo-)antigens are released into the TME. 27 –29 The virus particles (VPs) themselves will also be taken up by antigen-presenting cells (APC), and serve as pathogen-associated molecular patterns (PAMPs), which are sensed by TLRs and induce activation of the APC, 30,31 although adenoviruses can also induce APC activation in a TLR-independent manner. 32 Together, these OAdV-induced triggers allow effective antitumor T cell responses to be launched. 28
The effect of OAdV on macrophages has been studied in glioma mouse models, 33,34 but has not been characterized for melanoma as far as we are aware. Using in vitro culture models, we, in this study, show the effect of the OAdVs ORCA-01035 on human monocyte-derived macrophages in the face of melanoma-induced suppression using an in-vitro co-culture model. We previously reported on the effects of ORCA-010 on the melanoma-conditioned differentiation of monocytes to dendritic cells (moDCs), in the presence of the moDC-inducing cytokines IL-4 and granulocyte-macrophage colony-stimulating factor (GM-CSF). 36 Here, we studied the effects of ORCA-010 on the unbiased melanoma-conditioned differentiation of monocytes. While the immature DCs and M2-like macrophages resulting from this melanoma conditioning are both immune-suppressive components of the TME, they are distinct cell populations with potentially different properties.
In addition, we have also studied the immune-modulating effects of ORCA-010 in the B16-OVA melanoma mouse model. Our data show the oncolysis-dependent activation of M2-like macrophages in human monocyte/melanoma co-cultures, as well as the direct proinflammatory effects of ORCA-010 in vivo. Based on these results, ORCA-010, with its potent oncolytic activity as well as local and systemic effects in vivo, could be an attractive candidate for overcoming resistance to immune checkpoint blockade in patients with melanoma.
MATERIALS AND METHODS
Cell lines
The human melanoma cell lines WM9, SK-MEL28, and MEL-57 were described previously. 36 –40 Their identities were confirmed by short tandem repeat analysis (Eurofins, The Netherlands). The cell lines, including the B16-OVA murine melanoma cell line, were maintained as described previously, 36,41 and were tested for mycoplasma.
Viruses
ORCA-010 (Ad5-Δ24-T1-RGD) 35 is derived from human adenovirus serotype 5 and carries the following genetic modifications: the Δ24 mutation in the E1A region providing cancer cell-selective replication, the T1 mutation in the E3/19K gene that promotes oncolysis, and insertion of an Arg-Gly-Asp (RGD) motif in the fiber knob that enhances infection efficiency. The multiplicity of infection (MOI) used in cultures was chosen to achieve 60% lysed melanoma cells by day 6 of culture, 36 that is, MOI 25-IU/cell for SK-MEL28 and MEL57, and MOI 100-IU/cell for WM9. Replication-deficient adenovirus serotype 5 with an RGD motif and expressing luciferase under a CMV promoter (Ad5-Luc-RGD) 42 was used at MOI 100-IU/cell. The OAdVs ONYX-01543 and Ad5-Δ24-RGD 44 are conditionally replicative, and carry an E1B-55K deletion mutation, or an E1A modification and RGD insertion, respectively.
Isolation of peripheral blood lymphocytes and monocytes
Peripheral blood mononuclear cells (PBMCs) were isolated from buffy coats from consenting healthy donors (Sanquin Blood Supply Services, The Netherlands) and from these, CD14+ monocytes were isolated by magnetic bead separation, as previously described. 36,45
Monocyte-derived macrophage polarization
Control macrophages (i.e., generated without melanoma cell lines) were derived by culturing CD14+ monocytes in complete RPMI medium (RPMI-1640 medium+Glutamine & L-HEPES; ThermoFisher, Waltham, MA), with fetal calf serum (10% FSC HyClone; GE, Boston, MA), penicillin-streptomycin-glutamine (1% P/S/G; ThermoFisher), and beta-2-mercaptoethanol (5.5 mM; ThermoFisher) supplemented with 0.1 μg/mL M-CSF (ImmunoTools, Germany), or GM-CSF (1,000 IU/mL; ImmunoTools), to develop into resting M2-like and M1-like macrophages, respectively. 46 To activate the M2-like macrophages, after 7 days of culture, 47 a cocktail of recombinant human IL-4 (0.02 μg/mL rhIL-4; R&D Systems, Minneapolis, MN) and rhIL-10 (0.01 μg/mL; eBioscience, ThermoFisher) was added. M1-like macrophages were activated with lipopolysaccharide (0.1 μg/mL LPS; Sigma Aldrich, St. Louis, MO) and interferon gamma (1,000 IU/mL IFNγ; R&D Systems) on day 7. Supernatants were collected after 24 h (day 8), and phenotyping was done by flow cytometry.
Melanoma cell lines were plated in 500 μL complete RPMI medium. ORCA-010 was added 24 h later, 4 h before the addition of 2 × 10e5 CD14+ monocytes, in a 1:10 melanoma-to-monocyte ratio. ORCA-010 was added to the melanoma cells 4 h before the monocytes were added, to maximize virus uptake by the tumor cells. One hundred microliters of supernatant was collected from the culture on days 3, 7, and 8, and replaced by the same amount of complete RPMI medium. Flow cytometry was performed on day 8 (see Fig. 1A for timeline).
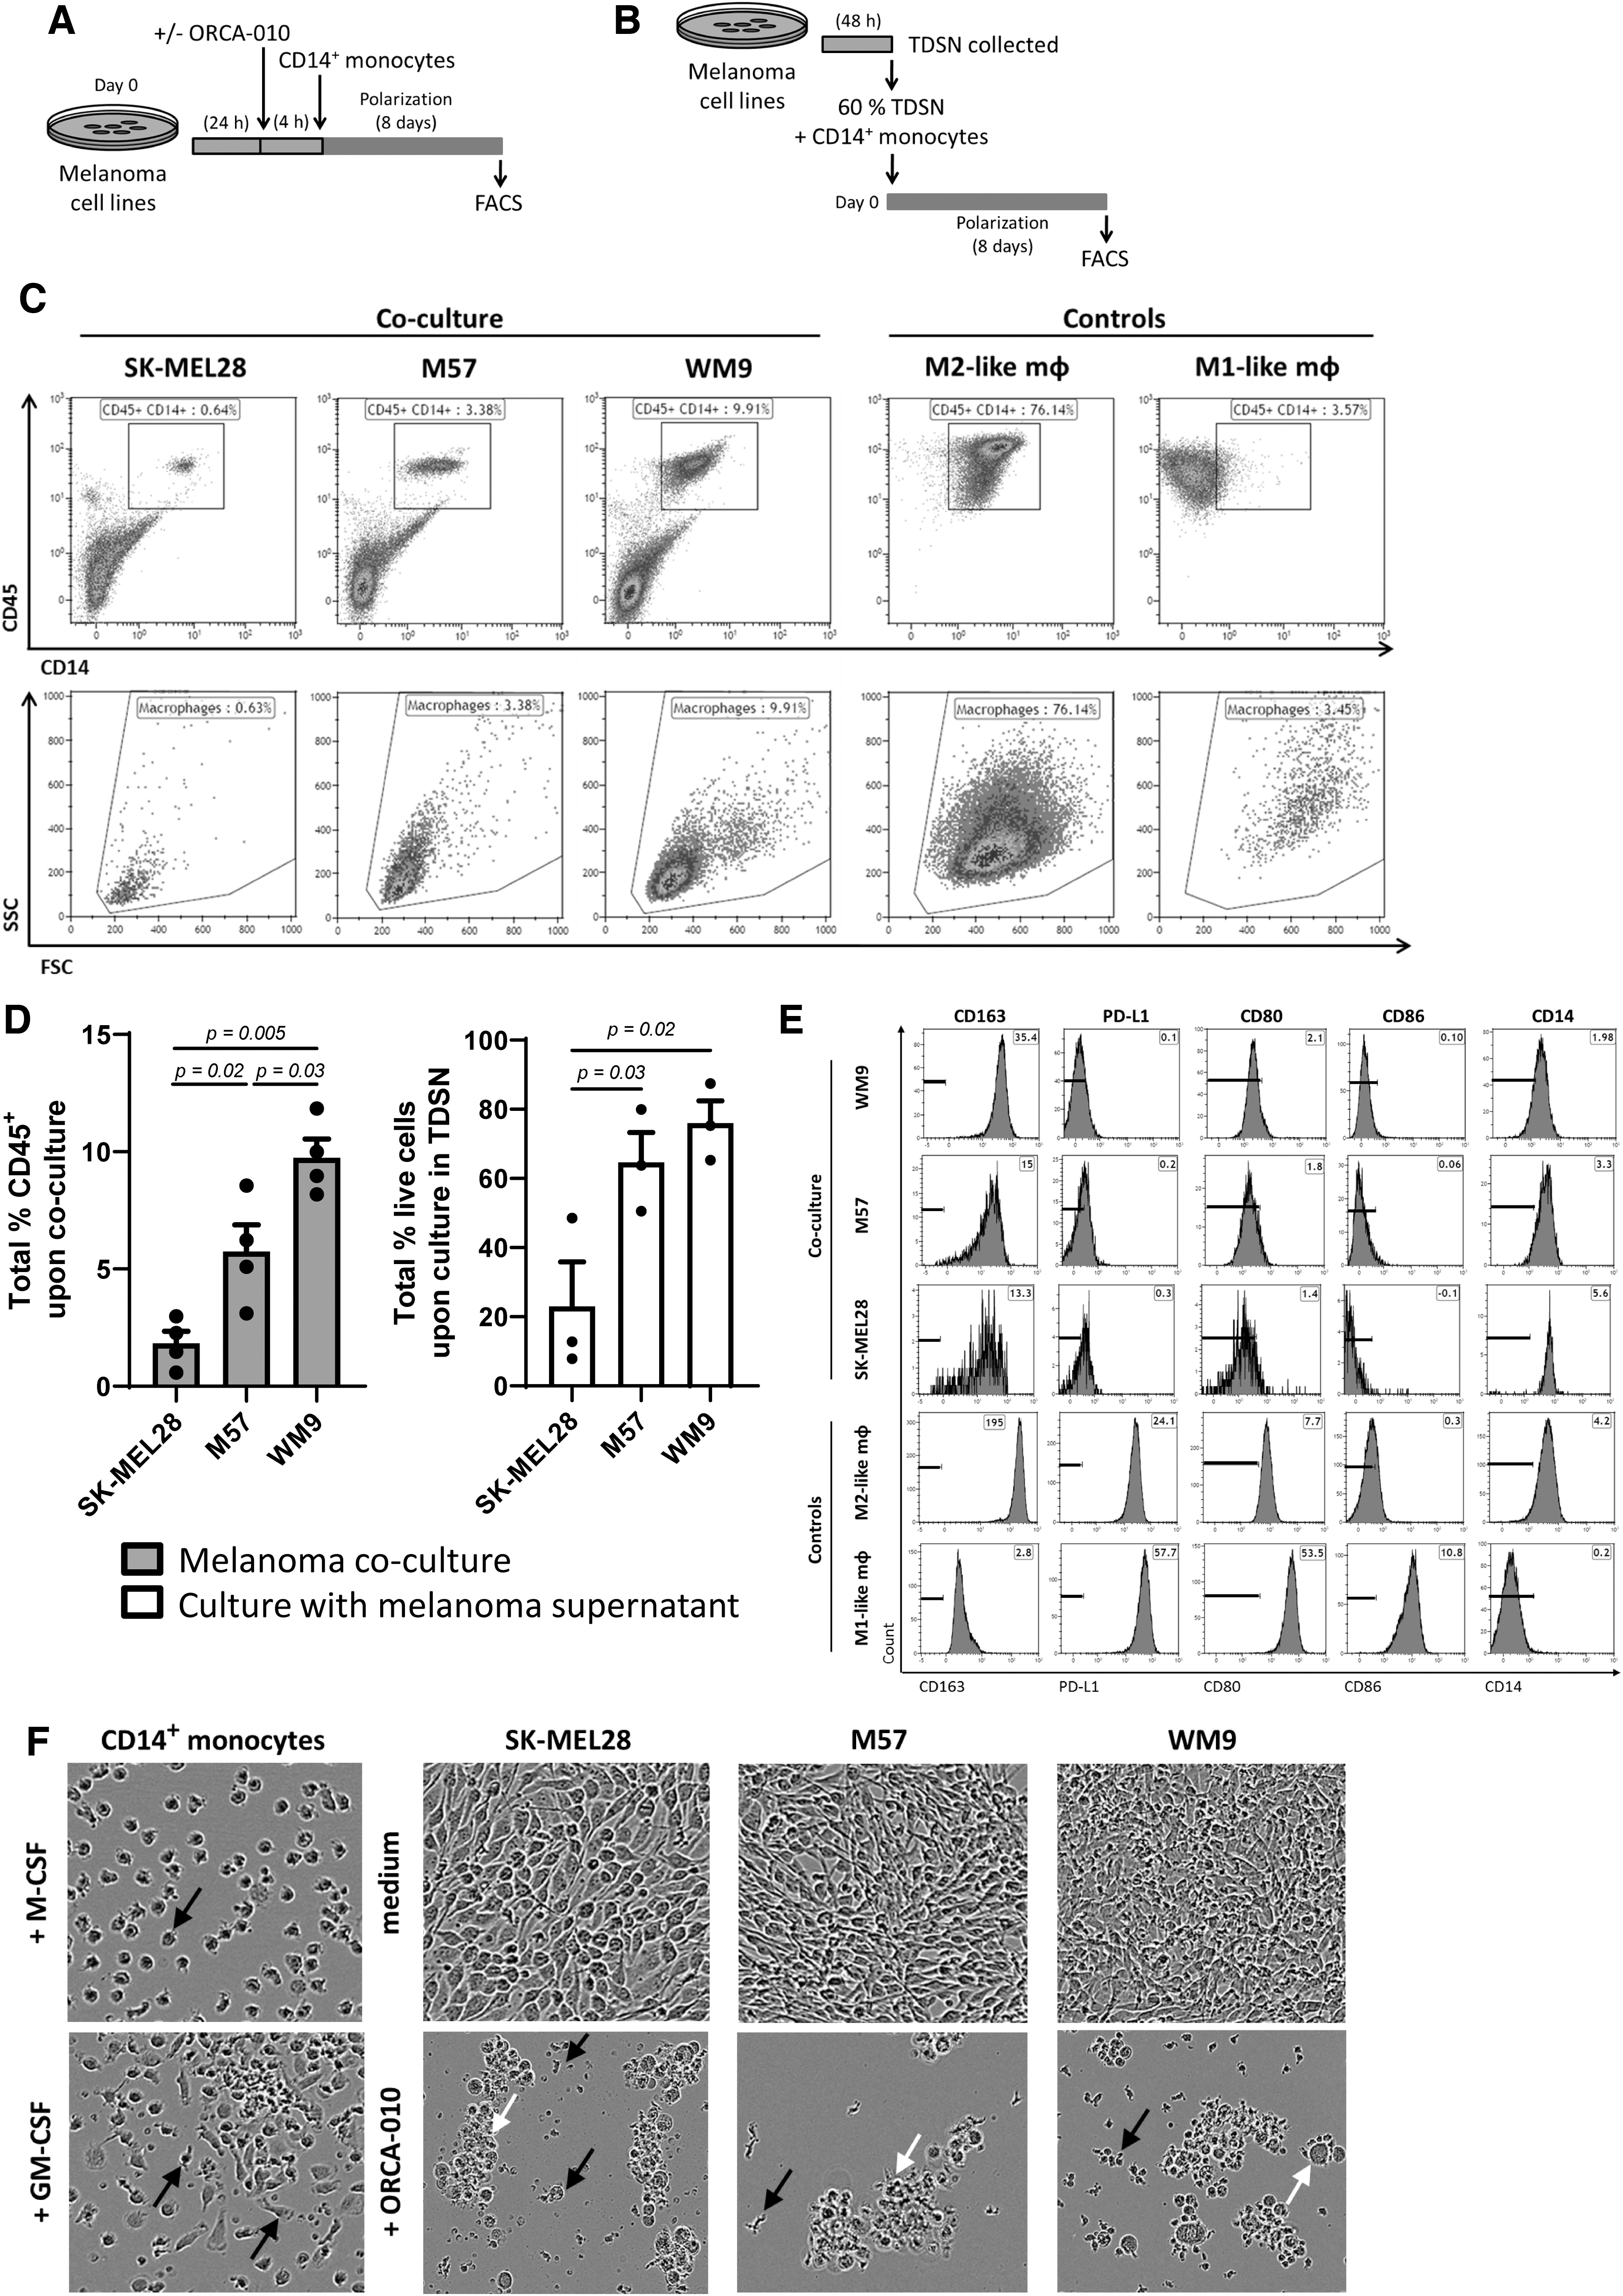
Suppression by melanoma cell lines, and oncolysis by ORCA-010. The phenotype of monocyte-derived macrophages was determined by culturing CD14+ monocytes (isolated from healthy donor PBMCs), with melanoma cell lines M57, WM9, and SK-MEL28 in vitro.
Alternatively, supernatants were collected from the melanoma cell lines after 48 h of culture and run through a 0.22 μm Millex-GV Syringe Filter Unit (Merck KGaA, Germany). The CD14+ monocytes were plated with 60% tumor-derived supernatant (TDSN) and 40% complete RPMI medium, and cultured for 8 days (Fig. 1B). Viability was determined by flow cytometry with 7-amino-actinomycin D (7-AAD) cell dye (Sigma, Ronkonkoma, NY), and the cells were phenotyped or assessed for their T cell priming capability as described below.
Mixed leukocyte reaction
On day 8 of the co-culture, the cells were harvested, and the macrophages were separated from the tumor cells by CD45 MACS according to the manufacturer's protocol (Miltenyi-Biotec, Germany). Purity (>90%) was checked by flow cytometry. Peripheral blood lymphocytes (PBLs) from healthy donor PBMCs depleted from monocytes by CD14 MACS were labeled with intracellular fluorescent dye 5,6-carboxyfluorescein diacetate succinimidyl ester (3 μM CFSE; Sigma Aldrich). CFSE-labeled PBLs (10e5 cells per well) were cultured in a 96-well round-bottom plate (Greiner Bio-One, Germany) in triplicate in a 10:1 ratio with macrophages (10,000 cells/well), in 200 μL complete RPMI medium. Positive control for T cell stimulation was CFSE-labeled PBLs stimulated at the start of culture with phytohemagglutinin (5 μg/mL PHA; Oxoid). The mixed leukocyte reaction (MLR) was cultured for 6 days, at which point, supernatants were collected and flow cytometry was performed to assess proliferation.
Flow cytometry
Macrophage cultures were washed and fixed with phosphate-buffered saline (PBS; Fresenius Kabi, The Netherlands) supplemented with bovine serum albumin (0.5 g BSA; ThermoFisher) and sodium azide (0.1%; Sigma Aldrich), and stained with the following anti-human antibodies: CD45 AF700 (clone HI30; Biolegend), CD14 FITC (clone MΦP9; BD Biosciences, San Diego, CA), CD163 PE (clone GHI/61; Sony Biotechnology, San Jose, CA), CD80 BV421 (clone 2D10; Biolegend), CD86 PCP-Cy5.5 (clone 2331 [FUN-1]; BD Pharmingen), PD-L1 APC (clone MIH1; eBioscience), and HLA-DR FITC (clone L243; BD Pharmingen).
T cells and macrophages from an MLR culture were fixed and stained with the following antibodies: CD14 PE-CF594 (clone Mφ-P9; BD Biosciences), CD3 BV421 (clone SK7; BD Horizon), CD4 AF700 (clone RPA-T4; BD Pharmingen), and CD8 APC (clone SK-1; BD Biosciences). Viability was determined with 7-AAD cell viability dye (Sigma). The samples were acquired on a Fortessa X20 flow cytometer (Becton-Dickinson, Franklin Lakes, NJ), and analyzed with Kaluza Analysis software 1.3 (Beckman Coulter Life Sciences, Indianapolis, IN).
For phenotypic analysis of the mouse immune populations (described below), tumors and spleens harvested on day 10 were processed into single-cell suspension and fluorescently labeled with the anti-mouse antibodies listed in Supplementary Table S1. The phenotypic definitions of the myeloid populations are listed in Supplementary Table S2, as described previously. 48 –55 Samples were acquired on the Sony SH800 cytometer (Sony Biotechnology), and analyzed with Kaluza analysis software 1.3 (Beckman Coulter Life Sciences).
To determine IFNγ secretion by ovalbumin (OVA)-reactive T cells, mouse splenocytes were thawed, passed through a 100 μm cell strainer (BD), and restimulated in vitro for 4–5 h with 1 μg/mL OVA-derived SIINFEKL peptide 56 (a kind gift of Prof. Yvette van Kooyk, Amsterdam UMC, The Netherlands) and 1:500 GolgiPlug™ protein transport inhibitor containing Brefeldin A (BD Biosciences). After washing, cells were stained for 20 min in 1:5,000 fixable viability dye eFluor™ 506 (eBioscience, San Diego, CA) diluted in PBS to detect dead cells, followed by an FcγII- and FcγIII-receptor blocking step using the 2.4G2 antibody (BD Biosciences). Following washing, the cells were stained with membrane anti-mouse antibodies (CD3 and CD8, see Supplementary Table S1). IFNγ FITC (Supplementary Table S1) was intracellularly stained in cells permeabilized with the eBioscience™ FoxP3/Transcription Factor Staining Buffer Set (ThermoFisher). Samples were acquired on the Fortessa X20 flow cytometer (Becton-Dickinson) and analyzed on Kaluza Analysis Software v1.3 (Beckman Coulter, Miami, FL).
Cytokine profiling
Supernatants collected from the in vitro cultures and MLR were analyzed for IL-6, IL-8, IL-10, IL-1b, TNF-α, and IL-12p70 using the human inflammatory cytometric bead array (CBA) kit (BD Biosciences), and for IL-2, IL-4, IL-6, IL-10, IFN-y, TNF-α, and IL17A using the human Th1/Th2/Th17 CBA kit (BD Biosciences), respectively. The samples were acquired on a Fortessa X20 flow cytometer (Becton-Dickinson), and analyzed with FCAP Array 3 software (BD Biosciences).
In vivo experiment design and treatments
Four- to 6-week-old C57BL/6 JOlaHsd immune-competent female mice (Envigo, Indianapolis, IN) were quarantined for 1 week, and housed in a Biosafety level II facility. All animal protocols were reviewed and approved by the experimental animal committee of the University of Helsinki (Finland) and the Provincial Government of Southern Finland. Mice were engrafted subcutaneously with 0.25 × 10⁶ B16-OVA cells in 100 μL RPMI-1640 medium in the left flank. The tumor growth was monitored daily until day 11 when tumors reached 3–4 mm in length. The mice were randomly distributed into four groups (n = 4 per group), namely PBS, ORCA-010, anti-PD-1, and ORCA-010 plus anti-PD-1, and treatments were initiated (day 0).
Tumors received 1 × 10⁹ ORCA-010 VP intratumorally (i.t.) in saline mixed with filter-sterilized dimethyl sulfoxide (12% v/v DMSO; Sigma) on days 0, 1, 3, 6, and 9. Groups treated with anti-mouse PD-1 InVivoMAb (7.23 mg/mL, clone RMPI-14; BioXCell, Lebanon, NH) were injected into the peritoneum (i.p.) on days 3, 6, and 9. The vehicle control group received saline with filter-sterilized DMSO i.t. and saline i.p. following the same schedule as the groups receiving therapy. A prime-boost treatment strategy was followed as described previously. 41 Health was monitored daily, and tumor volume was measured daily. Mice were anaesthetized with 2% isoflurane (Piramal Healthcare) for all treatments and tumor measurements. Tumor volume was calculated as 0.5 × (shortest diameter) 2 × longest diameter. To characterize the effect of ORCA-010 and PD-1 blockade on the immune response at the same time point, all mice were sacrificed 10 days after treatments began, and the tumor and spleen were collected, dissociated into single-cell suspension, and frozen at −80°C until further analysis. Euthanasia was performed before the experimental endpoint if mice had an ulcer (open wound) at the injection site, or if the tumor volume exceeded 18 mm. In the vehicle control group, one mouse was found dead in the cage on day 10, while in the combination group, one mouse was sacrificed on day 9 due to an ulcer on the tumor.
Transcriptional analysis
CD163 (gene ID: 9332) and CSF-1 (M-CSF; gene ID: 1435) transcript levels from the publicly available dataset “Tumor Skin Cutaneous Melanoma TCGA” (TCGA-470-rsem—tcgars; source ID: SKCM) were correlated using R2 software (R2: Genomics Analysis and Visualization Platform). This dataset was selected because of the high sample number. No further distinctions based on disease progression or metastasis were made.
Statistical analysis
All data were tested for significance with GraphPad Prism version 8 (San Diego, CA). Student's t-test was used for significance testing of in vitro experiments. One-way analysis of variance with Holm-Sidak's multiple comparisons test was used to determine significance of the in vivo mouse experiments. p-Values <0.05 were considered significant and are indicated in the graphs.
RESULTS
Melanoma-mediated survival and polarization of M2-like macrophages
The effect of human melanoma cell lines on human CD14+ monocytes was evaluated by both co-cultures with the melanoma cells (Fig. 1A) or culture with cell line-derived supernatants TDSN (Fig. 1B). In co-cultures and cultures with TDSN, the M57 and WM9 cell lines supported survival of CD45+CD14+ monocytes (which acquired macrophage-like scatter properties), whereas SK-MEL28 did not (Fig. 1C, D), demonstrating the presence of soluble melanoma-derived factors able to support monocyte survival. In co-cultures, the monocytes skewed to an M2-like phenotype (CD14+CD163+) with absent or low expression levels of the B7-family members CD80, CD86, and PD-L1 (Fig. 1E). With a round appearance, morphologically, they resembled more M2- than M1-like macrophages (Fig. 1F).
Of note, M-CSF- and GM-CSF-induced M2 and M1 monocyte-derived macrophages, activated by polarizing cytokine cocktails, were included in phenotypic and morphological assessments to denote two ends of the macrophage polarization spectrum. The onco-mutational status of the tested cell lines and their secretion levels of growth factors and cytokines were previously reported by us. 36 The three tested cell lines, in varying degrees, produced low levels of IL-10 and IL-6, but WM9 and M57 uniquely produced M-CSF, a potent growth and survival factor for M2-like macrophages. 11,16 The importance of M-CSF in this regard was confirmed by a strong correlation between the M2-related CD163 and M-CSF transcript levels in a TCGA data set of n = 470 melanoma samples (Supplementary Fig. S1). WM9, because of its metastatic origin, its BRAF and PTEN mutation status, 36 both related to immune suppression and T cell exclusion, 51,57 and its ability to secrete M-CSF, was chosen as the model cell line to further study the effects of ORCA-010-induced oncolysis in co-cultures with monocytes in vitro.
Oncolysis of melanoma cells by ORCA-010 activates macrophages, resulting in their increased capacity to prime type-1 T cells
Infection of WM9 melanoma cells with ORCA-010 over the course of 4 h at an MOI of 100, before addition of monocytes for a subsequent 8-day co-culture (Fig. 1A), did not prevent expression of the M2-associated markers CD14 and CD163 on the melanoma-conditioned macrophages (Fig. 2A, B), but it did lead to their increased forward and side scatter properties consistent with a more M1-like morphology (Fig. 2A). This was confirmed by significant upregulation of CD80, CD86, and PD-L1, similar to the expression profile of M1-macrophages (Fig. 2B, C). Of note, polychromatic staining showed that although CD80, CD86, and PD-L1 were upregulated by ORCA-010, CD163 was not downregulated on the same CD14+ cells: as such, macrophage activation was observed, rather than classic M2-to-M1 skewing.
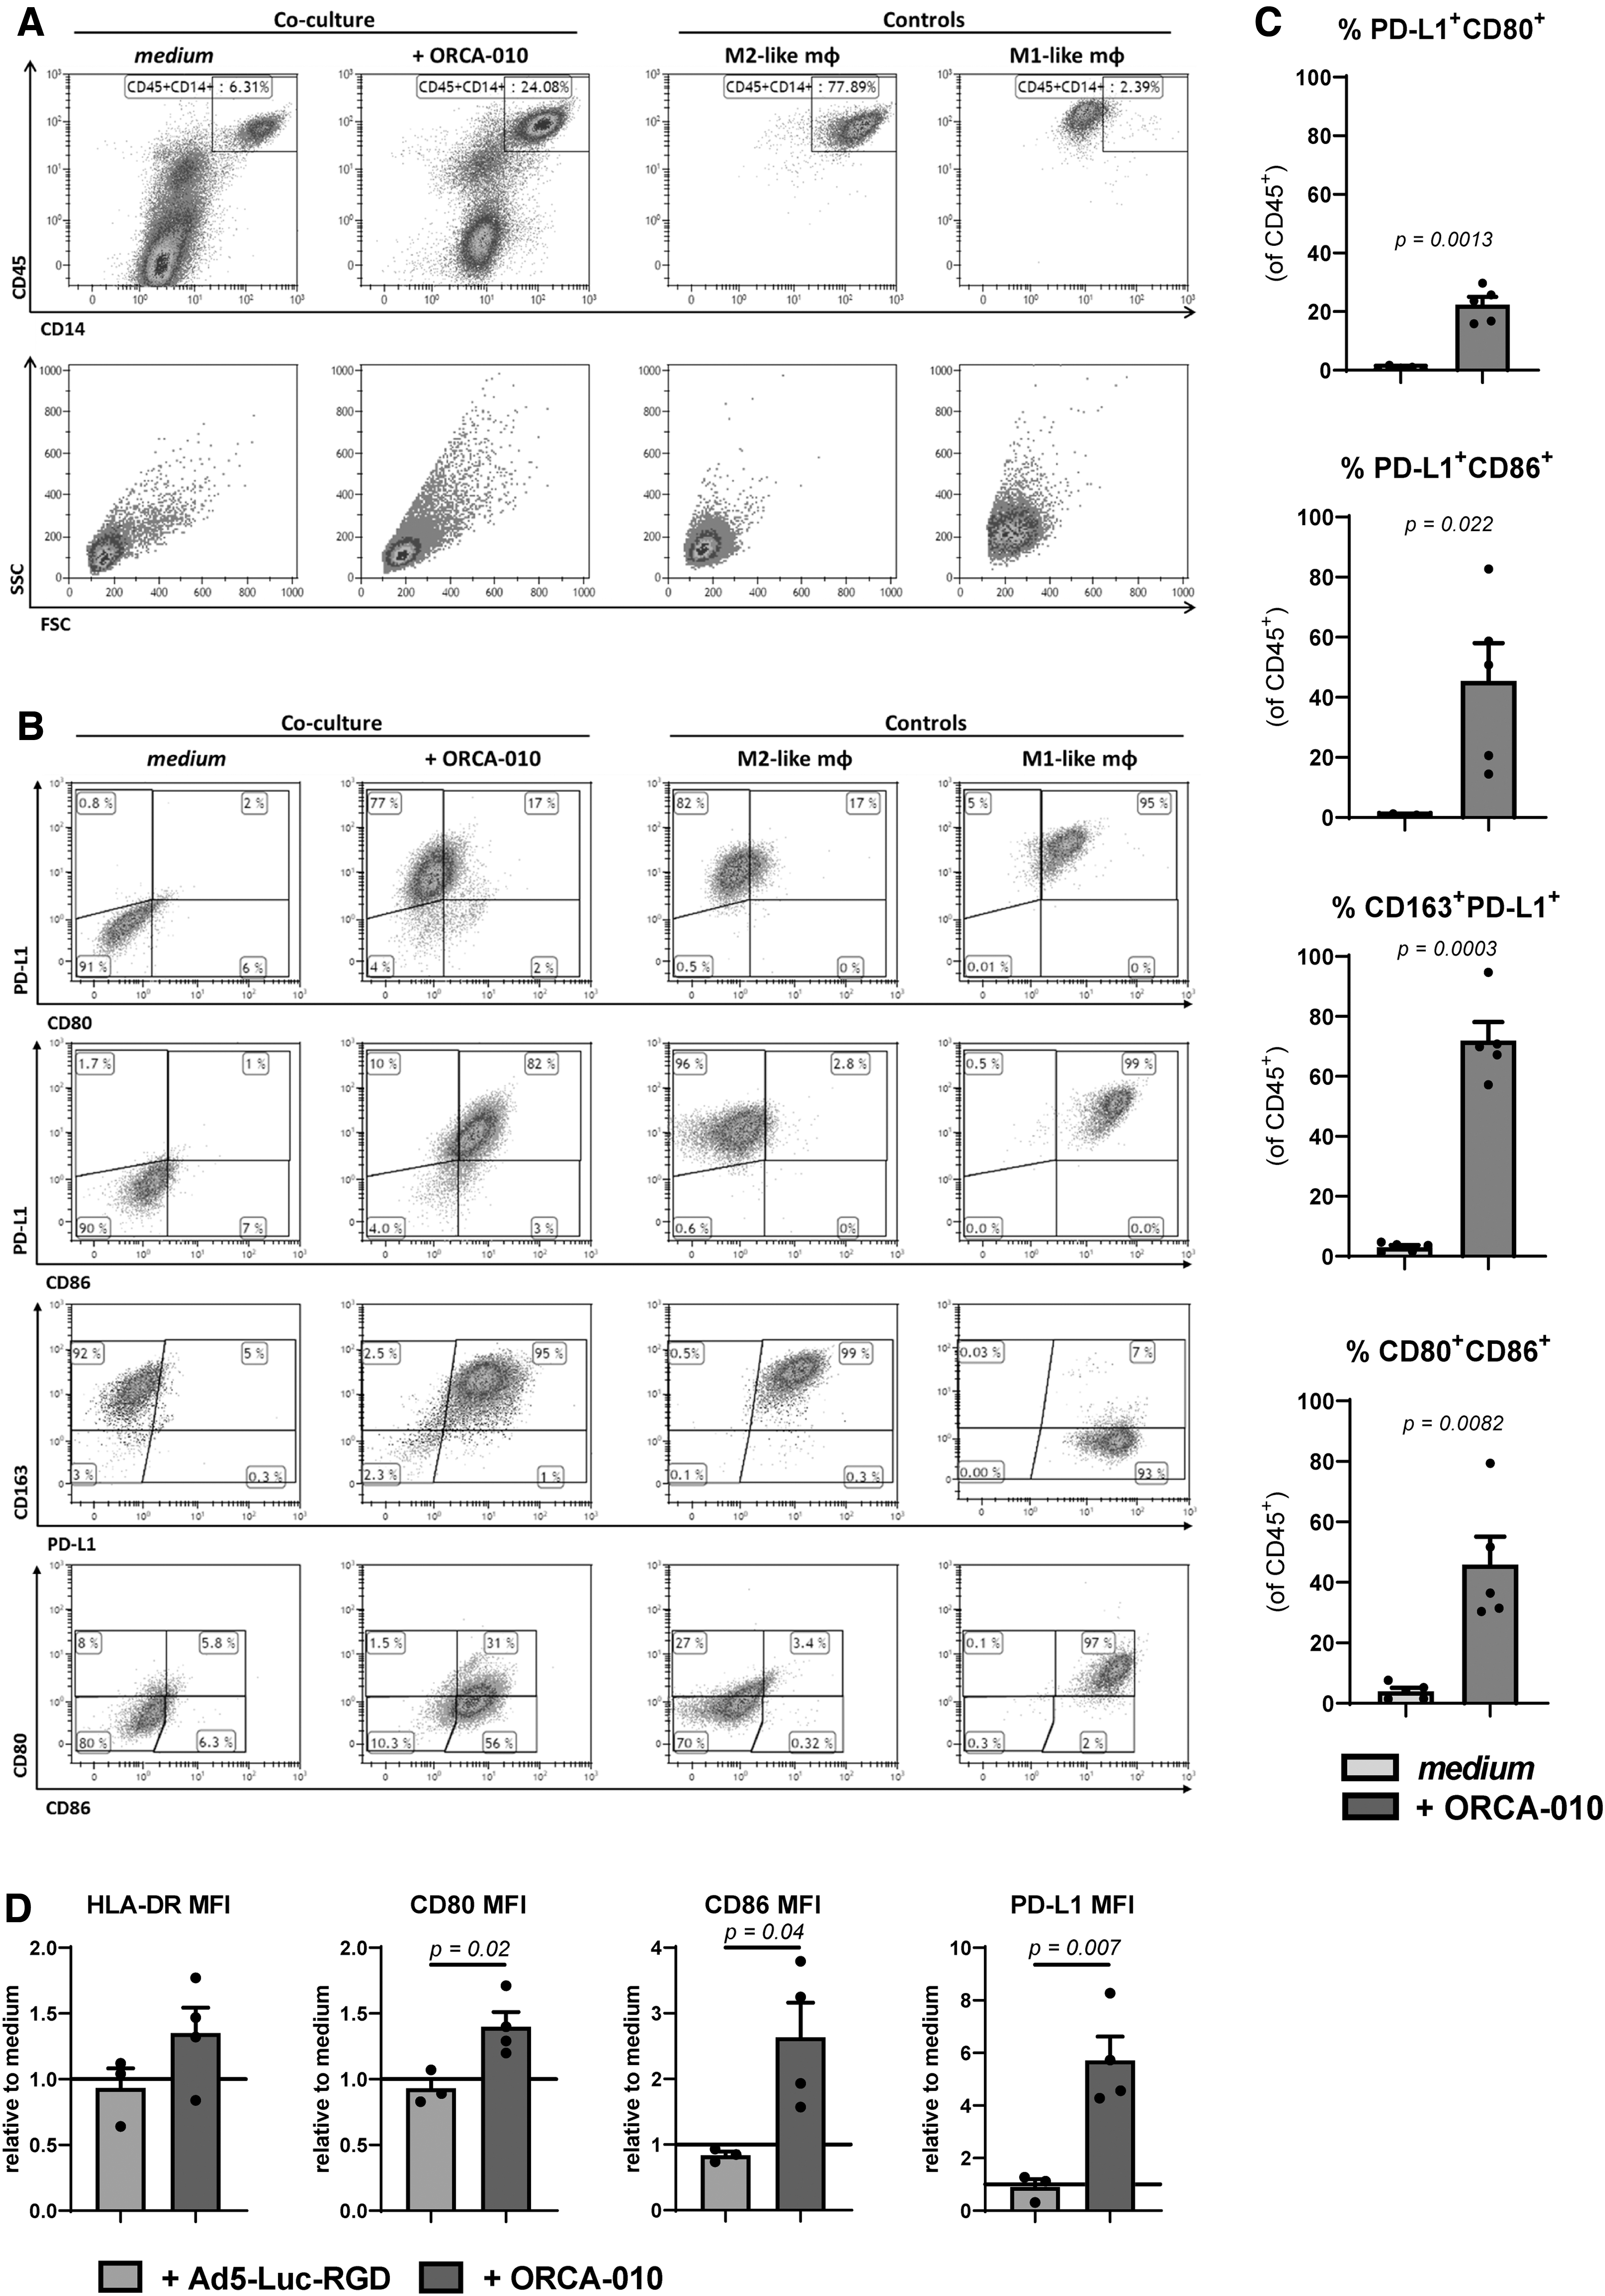
Oncolysis by ORCA-010 induces activated macrophages in a co-culture with WM9 melanoma cell line. After 8 days of co-culture with the WM9 melanoma cell line, the phenotype of the CD45+ monocyte population was determined by flow cytometry.
Similar observations for CD86 were made for the M57, and to a lesser extent, SK-MEL-28 cell lines (data not shown). A comparison with nonreplicative adenovirus (Ad5-Luc-RGD) showed this activation to be specific to the OAdV ORCA-010 (Fig. 2D), and was therefore, in this model, more likely related to DAMPs, released upon ORCA-010-induced oncolysis (Fig. 1F), than to adenovirus-derived PAMPs. Indeed, Ad5-Δ24-RGD, which, similar to ORCA-010, was able to induce oncolysis in WM9 melanoma cells, also induced upregulation of the B7 family members CD80, CD86, and PD-L1 on monocyte-derived macrophages, whereas ONYX-015, an adenovirus with attenuated oncolytic potential in comparison to Δ24-type viruses, which did not induce detectable oncolysis in WM9 melanoma cells, did not (Supplementary Fig. S2). Importantly, macrophages isolated from ORCA-010-infected WM9 co-cultures displayed a significantly improved ability over macrophages differentiated in untreated WM9 co-cultures to prime and activate both CD4+ and CD8+ T cells in a 6-day allogeneic MLR (Fig. 3A–C). These primed T cells generally secreted higher levels of the type-1 cytokines IFNγ, IL-2, and TNF-α (Fig. 3D). Significantly higher IFNγ:IL-10 and IFNγ:IL-4 (ns) ratios indeed confirmed type-1 effector T cell skewing.
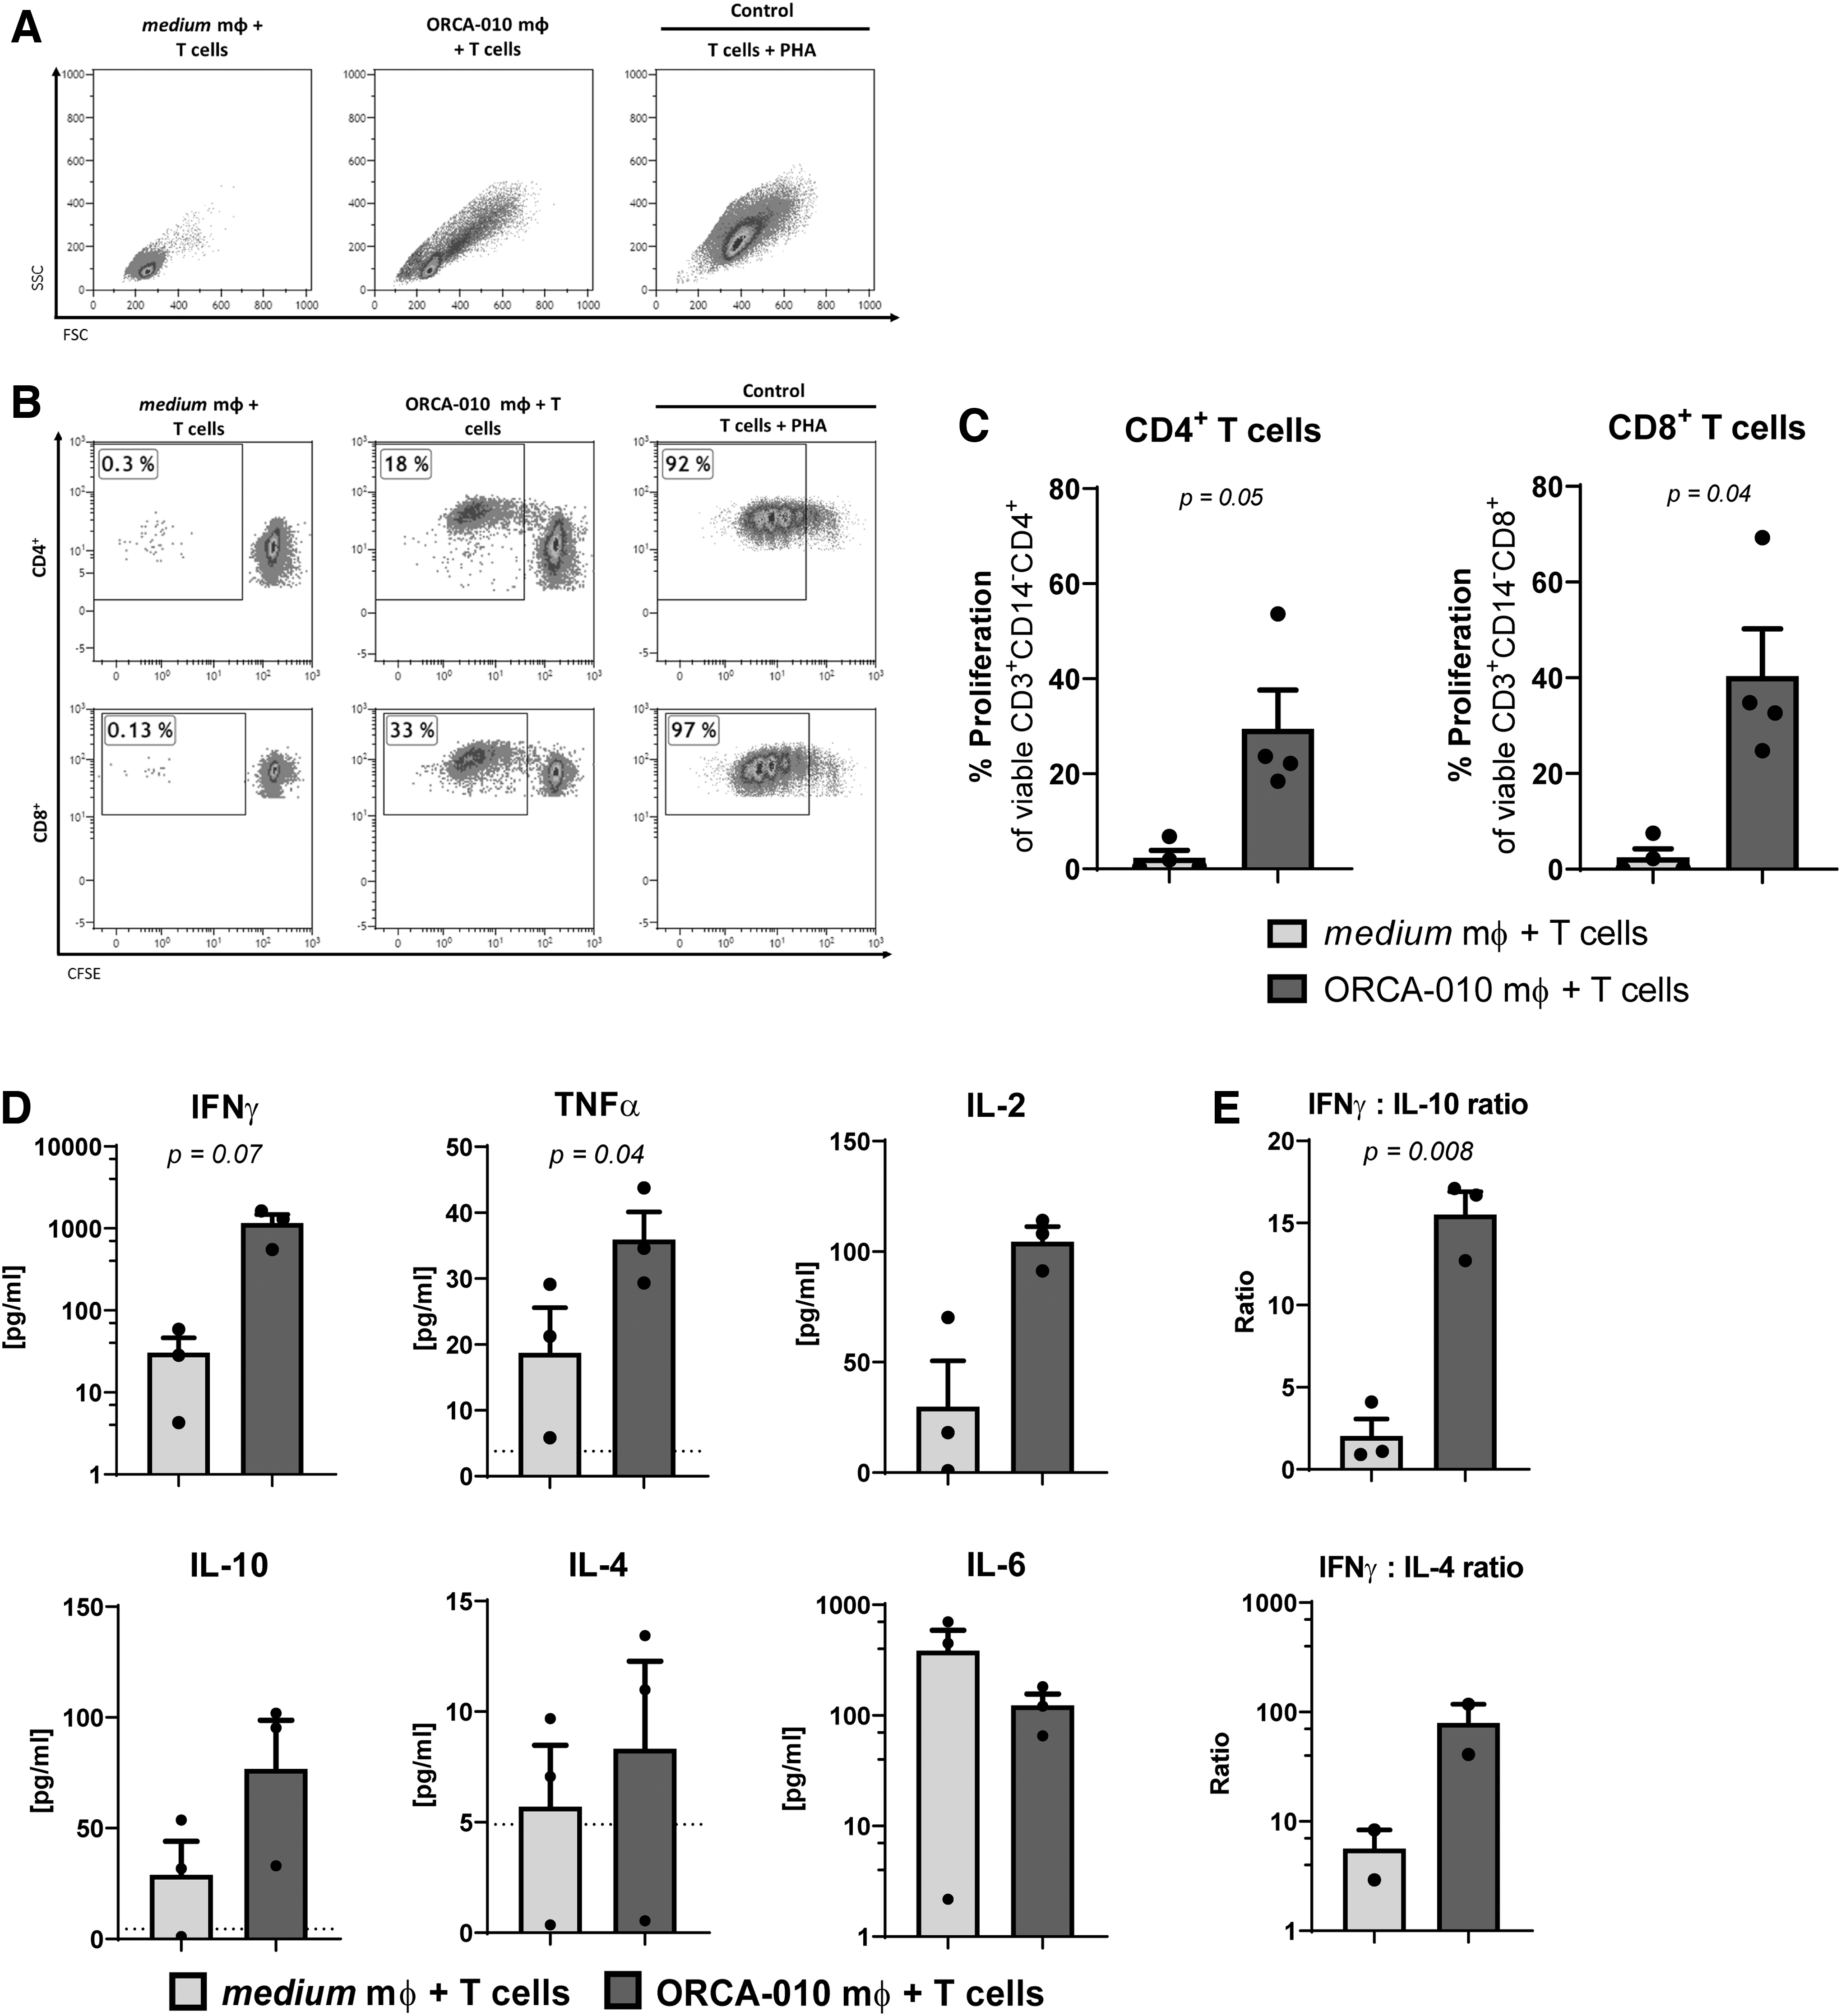
Activated macrophages from a WM9 co-culture with ORCA-010 can expand T cells in an allogeneic MLR and induce the secretion of Th1 cytokines. After 8 days, macrophages were sorted from co-cultures with melanoma cells based on CD45, and were subsequently cultured in a 1:10 target-to-effector ratio with CFSE-labeled, non-HLA-matched T cells for 6 days, upon which T cell proliferation was assessed by flow cytometry. Cytokines were quantified in 6-day MLR supernatants.
Intratumoral delivery of ORCA-010 combined with systemic PD-1 blockade promotes a systemic inflammatory response and increased CD8+ T cell infiltration
To assess the effects of ORCA-010 on the recruitment and activation of myeloid subsets and T cells in vivo, B16-OVA bearing syngeneic BL6 mice were treated intratumorally with ORCA-010, followed by systemic anti-PD-1 administration 41 (Fig. 4A). At the time of sacrifice (day 10), the mean tumor volume was the same for all groups (Fig. 4B), consistent with the fact that murine tumors are not permissive to OAdV replication and therefore will not undergo oncolysis. Myeloid and T cell subsets were assessed by flow cytometry in both tumors and spleens.
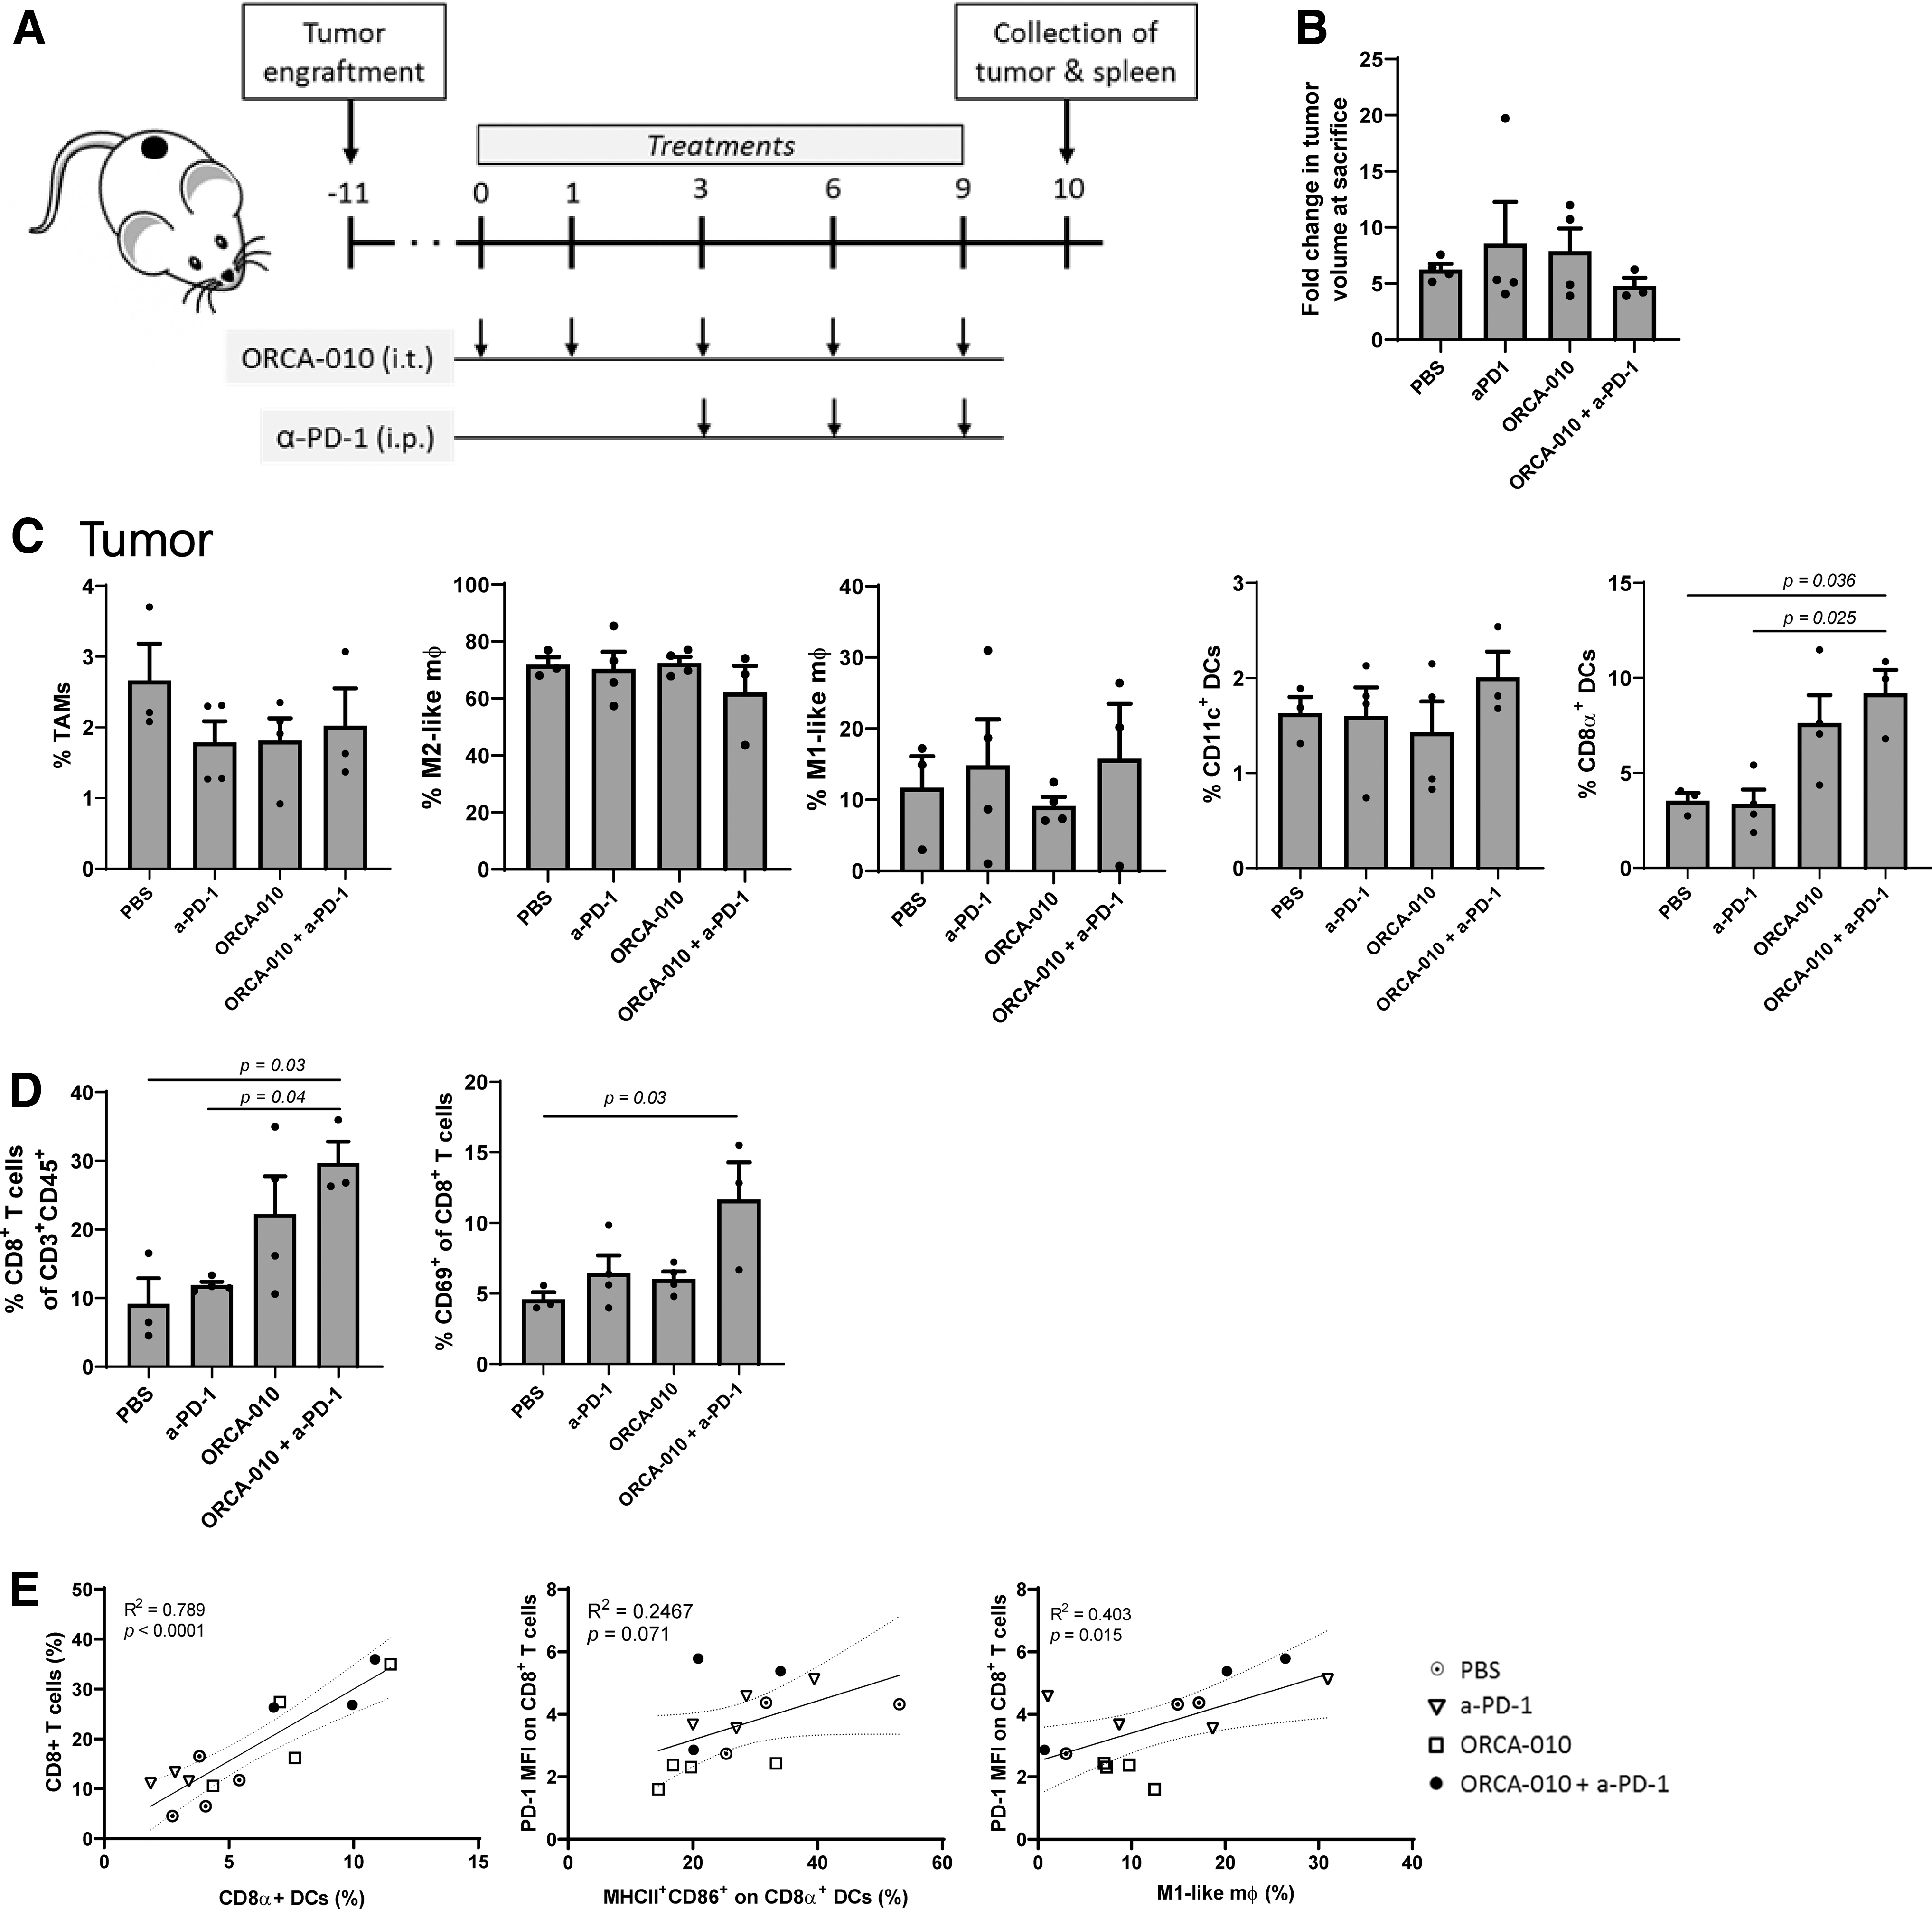
ORCA-010 and anti-PD-1 combination therapy induces T cell infiltration and activation in B16-OVA melanoma tumors.
In the tumor, no differences in frequencies of myeloid-derived suppressor cells (MDSC, data not shown) or TAMs were observed, nor any treatment-related shifts in M1-M2 phenotypes; rather, a significant increase was observed in CD8α+ conventional dendritic cell 1 (cDC1) upon combined ORCA-010 administration and PD-1 blockade (Fig. 4C). Combined ORCA-010 and PD-1 treatment also increased rates of tumor-infiltrating CD8+ T cells in an activated state as evidenced by their increased CD69 expression (Fig. 4D). Numbers of CD8+-infiltrating T cells were strongly correlated to tumor-associated CD8α+ cDC1, both of which were recruited upon i.t. ORCA-010 delivery (Fig. 4E, left panel). PD-1 expression levels on tumor-infiltrating CD8+ T cells, a sign of tumor specificity, 58,59 were related to both activation of CD8α+ cDC1 and M1-like macrophage content (Fig. 4E, right panels).
In the spleen, M2-like macrophages decreased, and CD11c+ cDC and CD8α+ cDC1 increased in response to ORCA-010 and anti-PD-1 combination treatment (Fig. 5A). This was accompanied by increases in both CD8+ and CD4+ T cells in a combination treatment-induced activation state, as evidenced by increases in PD-1 expression rates (Fig. 5B). Upon in vitro restimulation of splenocytes with the immunodominant OVA-derived epitope SIINFEKL, low-frequency OVA-reactive CD8+ T cells producing IFNγ were measurable by day 10 after intratumoral delivery, confirming the priming of tumor-specific T cells (Fig. 5C). CD8+ T cell rates in the spleen, like in the tumor, were correlated to CD8α+ cDC1 frequencies; the reduction in M2-like macrophages in combination-treated mice correlated with an increase in CD4+ T cell frequencies and PD-1 expression rates in CD8+ and CD4+CD69+ T cells (Fig. 5D).

Rates and activation state of immune cell subsets in the spleen of ORCA-010 and anti-PD-1-treated B16-OVA tumor-bearing mice. Phenotypic analysis of cells in the spleen of mice, 10 days after the start of treatment.
DISCUSSION
For patients with melanoma, combined immune checkpoint blockade with nivolumab (anti-PD-1) and ipilimumab (anti-CTLA-4) has improved the 5-year overall survival rate to levels exceeding 50%. 2 Despite this spectacular result, almost half of the patients either fail to respond or develop resistance to treatment. Oncolytic viruses are promising novel therapeutic agents that may help overcome this primary or acquired resistance. They can achieve in vivo immunization against cancer, through inducing the release of tumor (neo-)antigens in an immunogenic manner, while transforming the TME into a T cell-inflamed state. 5,7,60 Indeed, Ribas et al. clearly demonstrated this principle in patients with advanced melanoma, who received i.t. injections of the oncolytic virus T-VEC (a herpes simplex virus encoding GM-CSF), which, combined with PD-1 blockade, dramatically increased T cell infiltration, not only of injected but also of noninjected lesions. 61
Myeloid subsets have been recognized as holding the key to ensuring both efficient antitumor T cell priming and attracting effector T cells to the TME. It is therefore vital that oncolytic viruses ensure proper APC development and activation, even in the face of melanoma-associated immune suppression. In our in vitro culture model, we found that melanoma cell lines, without exogenously added cytokines, polarized monocytes into CD163+ M2-like macrophages, lacking expression of co-stimulatory markers. Soluble factors implicated in skewing monocytes to M2-like macrophages are M-CSF, IL-6, and IL-10, and are dependent on cross-talk in the TME. 62 –65 In our WM9-based model, M-CSF was the most likely culprit in this context. Of note, macrophages can acquire a composite M1/M2 phenotype on the continuous M1-M2 polarization spectrum 4 in response to various cues in their milieu. 11,22 Although macrophages in WM9 co-cultures did not downregulate CD14 or CD163 upon ORCA-010 infection of the melanoma cells, these macrophages did increase their expression of B7-family ligands (CD80, CD86, and PD-L1), activation markers that are commonly expressed by M1-like macrophages upon interferon- and TLR-mediated signaling. 66 Inflammatory cytokines secreted in the WM9 co-cultures measured on day 8 were not modulated by ORCA-010, which might have been related to consumption of released cytokines in the cultures (Supplementary Fig. S3), and the maintained expression of CD163 on the macrophages could be by continuous M-CSF stimulation in a closed co-culture system, 21,67 or by TLR-mediated activation of monocytes. 67,68
Eriksson et al. 69 demonstrated that CD40L-armed Ad5/35 could lower rates of CD11b+CD163+ M2-like cells after 5 days of co-culture with human monocytes. However, this was mostly due to the CD40L transgene as, in accordance with our findings, this shift was not observed with the unarmed Ad5/35. It was also the CD40L transgene that induced subsequent IL-12 release by the activated monocyte-derived macrophages. Similarly, in an in vivo pancreatic tumor model, the unarmed Ad5/35 oncolytic virus did not impact the M1/M2 ratio, but rather the murine CD40L-expressing virus induced M1-like macrophages. 69 As Ad5-Luc-RGD per se could not induce this activation, it is most likely that DAMPs, released upon ORCA-010-induced oncolysis, were responsible. Indeed, Heinio et al. 70 demonstrated that infection of SK-MEL28 with an OAdV resulted in the release of DAMPs (such as ATP) that activated moDCs. 26,71 This is in keeping with our own previous observation that oncolysis induced by ORCA-010 was responsible for the activation of melanoma-conditioned moDCs rather than PAMPs derived from the virus itself. 36
Strikingly, both in melanoma/monocyte co-cultures without differentiation-inducing cytokines presented herein and in co-cultures with DC differentiation-inducing cytokines, 36 the resulting APCs acquired a CD14+CD163+ M2-like phenotype, which ORCA-010 infection was unable to steer toward M1-like macrophage or CD1a+ moDC differentiation, respectively. However, in both instances, it did induce activation that resulted in an ability of the generated APCs to prime a type-1 T cell response.
In the B16-OVA mouse model, we investigated the immune response to combination therapy of ORCA-010 with PD-1 blockade. ORCA-010, like all OAdV, cannot replicate in murine B16-OVA tumors, 72 but it can infect B16-OVA cells. 73 The resulting antiviral immune response can prime antitumor immunity through epitope spreading, and promote the homing of immune effector cells into tumors through the expression of CCL5 and CXCL10. 74 –76 The in vivo myeloid-activating effects of ORCA-010 observed in the B16-OVA model may derive from a combination of T cell-induced death of virus-infected tumor cells, leading to the release of activating DAMPs, and direct binding/uptake of the virus, carrying PAMPs, by myeloid cells. 77 –79 Both TLR-dependent and TLR-independent signaling are activated in macrophages that phagocytose tumor cell debris and VP. 32 The intracellular sensing of dsDNA of ORCA-010 can also trigger IRF3 and NF-kB transcription factors, activating type-I interferon signaling and proinflammatory cytokine expression (IL-1β and TNF-α). 31,77,80 Consistent with this, i.t. delivery of ORCA-010 facilitated the recruitment of cross-presenting CD8α+ DCs (cDC1 like) and CD8+ T cells to the TME, both known to enable efficacious PD-1 blockade. 51
Indeed, in concert with PD-1 blockade, CD69+CD8+ T cell frequencies increased in the tumor. These could potentially develop into tissue-resident memory T cells. 81 –83 Functionally, CD69+CD8+ T cells can secrete IFNγ, 84 induced by the action of anti-PD-1. 74 Likely, as previously described by Spranger et al., 51 recruited cDC1 were responsible for CXCL10 expression, which would subsequently have attracted CD8+ T cells to the TME. This is supported by the observed perfect correlation between frequencies of both subsets in the tumor. Although we did not observe a reduction of M2-like macrophages at the tumor, we showed that M1-like macrophages correlated with PD-1 expression on CD8+ T cells. The failure to demonstrate macrophage modulation by ORCA-010 in the TME may have been due to its inability to induce oncolysis in the mouse model.
Interestingly, we did observe increased M1-like macrophage content in the spleen upon combined ORCA-010 and anti-PD-1 treatment and striking inverse correlations between M2 rates and frequencies of activated CD8+ and CD4+ T cells in the spleen, expressing PD-1, and CD69 and PD-1, respectively. Combination treatment also increased CD8α+ cDC1 rates in the spleen, which correlated with CD8+ T cell frequencies. For now, it remains unclear how i.t. injections of ORCA-010 led to these systemic myeloid subset-modulating effects, but conceivably, adenovirus-induced type-1 IFNs may have been responsible. 85,86
CONCLUSION
To conclude, ICD of melanoma cells by ORCA-010 activates human macrophages in vitro, functionally equipping them to prime and drive a type-1 T cell response. In the B16-OVA melanoma model, i.t. ORCA-010 injection combined with systemic PD-1 blockade mobilized and recruited cDC1 and attracted activated effector T cells to the TME. Interestingly, ORCA-010 and anti-PD-1 combination treatment induced an M2-like macrophage reduction in the spleen, which was accompanied by increased systemic frequencies of activated CD4+ and CD8+ T cells, expressing PD-1. Altogether, these data clearly support the intratumoral delivery of ORCA-010 to enhance PD-1 blockade efficacy in melanoma.
Footnotes
ACKNOWLEDGMENTS
The authors thank Trang Nguyen, Sinead M. Lougheed, Anita Stam, Dorian Stolk, Riikka Havunen, and the Biomedicum FACS Core Facility (University of Helsinki, Finland) for technical assistance.
AUTHORS' CONTRIBUTIONS
I.M. designed and performed research, analyzed and interpreted data, and wrote the article. M.L.G. performed research, and collected and analyzed data. V.W.v.B. designed research and interpreted data. D.C.A.Q., J.M.S., and V.C.C. provided technical support. W.D. and A.H. provided materials and designed research. R.v.d.V. and T.D.d.G. designed research, analyzed and interpreted data, and wrote the article. All authors read, edited, and approved the article.
AUTHOR DISCLOSURE
I.M. and W.D. have been, or are employed by ORCA Therapeutics. V.W.v.B. serves as CSO for ORCA Therapeutics. J.M.S. is an employee of TILT Biotherapeutics Ltd.. A.H. is shareholder in Targovax ASA and TILT Biotherapeutics Ltd.. T.D.d.G. has served as advisor for TILT Biotherapeutics Ltd.
FUNDING INFORMATION
This study was supported by the European Union's Horizon 2020 Marie Curie research and innovation program (grant agreement no. 643130, VIRION).
Supplementary Material
Supplementary Figure S1
Supplementary Figure S2
Supplementary Figure S3
Supplementary Table S1
Supplementary Table S2
References
Supplementary Material
Please find the following supplemental material available below.
For Open Access articles published under a Creative Commons License, all supplemental material carries the same license as the article it is associated with.
For non-Open Access articles published, all supplemental material carries a non-exclusive license, and permission requests for re-use of supplemental material or any part of supplemental material shall be sent directly to the copyright owner as specified in the copyright notice associated with the article.