
Abstract
To develop genetically engineered bone marrow mesenchymal stem cells (BMSCs) that carries a radiotherapy gene to target triple-negative breast cancer (TNBC) and to evaluate the efficacy of radiation damage within the tumor microenvironment. The early growth response protein1 (Egr1)-human sodium iodide symporter (hNIS) gene was transfected into BMSCs by lentiviral transfection and the expression levels were evaluated by quantitative reverse transcription polymerase chain reaction. Transwell and adipogenesis and osteogenesis assays were performed to determine the targeting properties and adipogenic and osteogenic characteristics of the transgenic stem cells. The uptake of radioiodine and the efflux characteristics of the transgenic stem cells were determined by iodine uptake experiments. 131I-SPECT imaging was used to determine the characteristics of targeting to TNBC and to quantify the iodine uptake of transgenic stem cells in vivo. The effects of 131I treatment on BMSCs were characterized using tumor growth, immune cell infiltration, and tumor invasion endpoints based on immunohistochemistry and flow cytometry analysis of tumor samples.
BMSCs-Egr1-hNIS cells abundantly express hNIS after radiation induction and are chemotactically attracted to TNBC tumors. Iodine uptake of BMSCs-Egr1-hNIS gradually increased with increasing induction concentrations and times. When the inductive concentration of 131I was >100 μCi/mL and lasted for 36 h, the rate of iodine uptake in cells increased. In vitro, the radioiodine quickly flowed out from cells within 20 min but in vivo, the rate of radioiodine loss was significantly slower and occurred over 24 h. After 131I therapy, tumor growth was inhibited, white blood cells infiltrated into tumor site and the levels of invasion-related cytokines significantly decreased. BMSCs-Egr1-hNIS-mediated 131I therapy can achieve precisely targeted radiotherapy to inhibit tumor growth, promote immune cell infiltration to the tumor sites, and reduce the invasiveness and metastasis characteristics of tumor cells.
INTRODUCTION
Breast cancer is the most common cancer in females and accounts for around 25% of all cancers and remains the main cause of cancer death. 1 Ten to twenty percent of breast cancer cases are triple-negative breast cancers (TNBC) that do not express ER, PR, and HER2, and are usually not sensitive to antihormone or monoclonal antibody therapy. Chemotherapy remains the main treatment for TNBC but its efficacy remains controversial. TNBC is the most aggressive subtype of the disease as it is highly invasive and has a poor prognosis.
A variety of soluble factors released by tumor cells mediate immune reprogramming and allow the recruitment of immunosuppressive cells that result in the failed activation of an antitumor immune response. Reconstruction of the extracellular matrix allows tumor cell migration and invasion. The tumor matrix septum is activated to support and maintain the survival of tumor cells. These factors work together to create a tumor microenvironment (TME) that is conducive to the selection of tumor cells that have mutation advantages that allow the escape of immune surveillance.
Radiotherapy is a promising modality that can be used to support immunotherapy, particularly in nonimmunogenic tumors. 2,3 Radiation can enhance immunotherapy response and reverse immune escape of tumor in an approach termed radioimmunotherapy. Radiation-induced damage leads to the expression of immune stimulation damage markers, which allows tumor cells to be recognized by their specific antigens. These interactions attract antigen-presenting cells into the TME to initiate the activation of effector cells that act to ultimately inactivate the tumor. 4
In nuclear medicine, human sodium iodide symporter (hNIS) gene-mediated 131I therapy has been extensively studied. The hNIS can transport radioactive iodine into cells and can be used as an approach for internal radiotherapy. The radiation-sensitive early growth response protein1 (Egr1) promoter is quickly activated after radiation exposure and regulates the expression of downstream target genes. Studies have initiated hNIS gene expression using the promoters of cytomegalovirus (CMV) and Egr1. Data have shown that when hNIS expression is under the control of the Egr1 promoter, cells have significantly higher hNIS expression after 131I stimulation compared with regulation under the CMV promoter and a nonirradiated group. 5,6
However, it does not conform to routine treatment procedures because the hNIS gene was directly transfected into tumor cells and then transplanted into animals in these studies. To overcome this limitation, we performed targeted gene delivery after stable gene transfection in vitro.
Bone marrow mesenchymal stem cells (BMSCs) are an ideal cell carrier for targeted therapy as they can be guided to the tumor site by a variety of cytokines secreted by tumor cells. 7 The use of autologous BMSCs can eliminate the risk of cell rejection and can be used for clinical applications in humans. Also, BMSCs can be easily isolated, can inherently regulate the immune response and are attracted to tumors by inflammatory cytokines. In this study, the tumor homing ability of BMSCs was used to deliver radiotherapy responsive genes and to achieve radiation injury within the TME of TNBCs.
MATERIALS AND METHODS
Cell lines, animal, and preparation of the recombinant lentivirus
BMSCs from Sprague Dawley rats (SD-BMSC) and MDA-MB-231 tumor cells were purchased from the stem cell bank of the Chinese Academy of Sciences. BALB/c nude mice were purchased from the Vitong Lihua Experimental Animal Technology Co., Ltd. (Zhejiang, China). Animal studies were approved by the local Ethics Committee (Ruijin Hospital, School of Medicine, Shanghai JiaoTong University, P.R. China.) and performed according to ethical principles for animal experimentation. Lentivirus (Lv)-Egr1-hNIS-CMV-green fluorescent protein (GFP)-puromycin (Puro) and Lv-Egr1-GFP-Puro carrying the antipuromycin gene were synthesized by the Shanghai XiTu Biotechnology Co., Ltd.
Sprague Dawley male rats of 3–4 w were put to death and soaked in 75% alcohol for 3 min. The femur was removed, the muscle stripped, and the two ends of femur were cut off. The bone marrow cavity was blown as fully as possible with a 5-mL syringe to blow off the bone marrow cells. The bone was then crushed with surgical forceps and the inner cavity portion of the bone was scraped with curved forceps. The cytosol was filtered through a 150-mesh nylon mesh sieve and the supernatant was removed by centrifugation for 5 min at 1,500 rpm, and all cells were inoculated into a 10-cm dish. The fluid is replaced every 48 h until full growth. During the experiment, the cells were passaged at a ratio of 1:2–1:3 for about 3–5 days.
Stable lentiviral transfection of BMSCs
BMSCs were seeded in 24-well plates and culture media containing different concentrations of puromycin (0, 2, 4, 6, 8, 10 μg/mL) were added to the dishes. The lowest screening concentration was defined as the puromycin dose, at which all cells were killed by the fourth day. BMSCs were seeded in six-well plates and incubated until the cells had become 70% confluent. The frozen lentivirus was stored at −80°C and thawed on ice before transfection. The accurate volumes of lentivirus solution and complete culture medium were calculated according to the multiplicity of infection (MOI) of 20 (MOI = lentivirus titer × volume/cell number).
Complete culture medium, virus solution, and 6 μg/mL of polybrene were added into the culture dishes and incubated for 24 h. Puromycin was added to the lentivirus-transfected BMSCs, the lowest killing concentration for 4 days to ensure the selection of transfected cells. The experimental and the control groups were defined as BMSCs-Egr1-hNIS and BMSCs-Egr1-NC, respectively.
Quantitative reverse transcription–polymerase chain reaction
Quantitative reverse transcription–polymerase chain reaction (qRT-PCR) was performed to validate the expression of hNIS. BMSCs-Egr1-hNIS and BMSCs-Egr1-NC were seeded in six-well plates and Na131I of 100 μCi/mL was added to each well to activate Egr1-hNIS. Total RNA was extracted and cDNA was synthesized by the TRIzol and InvitrogenRT Kit (Invitrogen, Carlsbad, CA). qRT-PCR was performed using SYBR Premix Ex Taq™II (TaKaRa Bio, Inc., Shiga, Japan) to detect the expression levels of the hNIS gene after radioiodine induction.
Western Blotting
BMSCs-Egr1-hNIS and BMSCs-Egr1-NC cells were seeded into a six-well plate and induced by 131I for 36 h. RIPA-Buffer, 1% benzo sulfonyl fluoride, and 1% diamine tetraacetic acid were added to extract the total protein from the cells. Western blotting analysis was carried out using SLC5A5 Monoclonal Antibody (FP5A) (1:200; Thermo Fisher, America) as the primary antibody and HRP-labeled goat anti-mouse IgG (H+L) (1:1,000; Beyotime Institute of Biotechnology) as the secondary antibody. β-actin (1:1,000; Beyotime Institute of Biotechnology) were used as an internal control.
Iodine uptake and outflow assay
Iodine uptake experiments were performed by seeding BMSC-Egr1-hNIS and BMSCs-Egr1-NC cells in 24-well plates. Different concentrations of Na131I (6.25, 12.5, 25, 50, 100, 200, 400 μCi/mL) and induction times (12, 24, 36, 48 h) were set up. After radioiodine induction, the solution was removed and thoroughly washed three times with phosphate-buffered saline (PBS). Around 0.5 mL of PBS containing 10 μM NaI and 0.1 μCi Na131I was added to each well and the cells were incubated for 30 min at 37°C. Around 1 mol/L of precooled NaOH solution was added to the cells, which were then left at room temperature for 20 min to lyse the cells. The cell lysate was transferred to a test tube with the cpm value measured using a γ counter.
In the iodine outflow experiments, BMSCs-Egr1-hNIS and BMSCs-Egr1-NC cells were seeded in a six-well plate and 100 μCi/mL of Na131I was added to each well to activate the Egr1-hNIS for 36 h. Around 0.5 mL of PBS was added to each well immediately after iodine uptake and the solution was removed by vacuum after 5, 10, 20, 30, 40, and 50 min. Around 1 mol/L of precooled NaOH solution was added to each well to lyse cells and the cpm values were detected using a γ counter.
Cell migration assay (Transwell assay)
MDA-MB-231 cells were seeded in 24-well plates at a density of 105 cells/well. BMSCs-Egr1-hNIS and BMSCs-Egr1-NC cells were seeded in the upper chamber and a blank control group without tumor cells was also set up. After incubation for 24 h, the upper cells were fixed with 4% paraformaldehyde for 30 min. The cells were stained with 0.1% Crystal Violet for 20 min and the nonmigrated cells in the upper chamber were gently removed off with cotton swabs. Cell migration was observed and the cells photographed using an optical microscope.
Adipogenic induction
BMSCs-Egr1-hNIS and BMSCs-Egr1-NC were placed in a six-well plate and the experiment was carried out when the cells had reached 100% confluency. Adipogenic differentiation medium A (containing insulin, 3-isobuty1-1-methylxanthine, rosiglitazone and dexamethasone) was added to each well for 3 days. Culture medium A was replaced with adipogenic differentiation medium B (containing insulin) for 24 h. The culture media were altered between types A and B three to five times (12–20 days) and then the cells were maintained in medium B for 4–7 days until the lipid droplets became large.
Finally, 4% paraformaldehyde solution was added to fix cells at room temperature for 30 min. One milliliter of Oil Red O dye working solution (Oil Red O storage solution: distilled water = 3:2) was used to stain cells for 30 min. The dyeing effect (lipid droplets in the cells were dyed pink) was observed under an optical microscope.
Osteogenic induction
BMSCs-Egr1-hNIS and BMSCs-Egr1-NC were seeded in six-well plates coated with 0.1% gelatin. When the cells reached 60–70% confluency, osteogenic differentiation medium was added to the plate. After induction for 2–4 weeks, the cells were fixed with 4% paraformaldehyde for 30 min and dyed with Alizarin Red solution at room temperature for 3–5 min. The osteogenic dyeing effect was observed under an optical microscope.
Tumor model and 131I therapy
MDA-MB-231 of 5 × 10⁶ cells were digested, centrifuged, and dispersed in 100 μL of PBS. The cell suspension was injected into the right subcutaneous armpit of 4–6 weeks BALB/c female nude mice. Experiments were initiated when the tumors reached a diameter of >8 mm.
5 × 10⁶ BMSCs-Egr1-hNIS and BMSCs-Egr1-NC were intravenously injected into mice. A typical therapy cycle was as follows: 24 h later when the stem cells had begun to target the tumor site, 100 μCi131I was used to induce the expression of hNIS by gavage. After 131I induction for 36 h, most of the BMSCs had reached the tumor and then 400 μCi131I was administered for therapy. The tumors received four cycles of therapy. Before every therapy, 0.25% KI was added to drinking water of nude mice to seal the thyroid gland, and water was changed to ordinary pure water during treatment.
131I-SPECT imaging
SPECT scanning was performed after 131I induced gene expression for 36 h. Before scanning, tumor-bearing nude mice were anesthetized with 2.5% Avertine at 40 times dilution at a dose of 100 μL/10 g. SPECT imaging was performed at 1, 3, 6, 9, 18, and 24 h after absorption. The anesthetized nude mice were placed on the operating table with the limbs extended and fixed with medical tape. The bodies of the mice were covered in the field of vision by adjusting the pinhole probe position. The parameters were set to start scanning and the images were stored for further analysis.
Immunohistochemistry analysis
Mice were euthanized and the tumors were removed and half of the tissue was soaked in 4% paraformaldehyde for 1 day. After dehydration and paraffin embedding, paraffin sections were dewaxed and hydrated. Antigens were retrieved and endogenous peroxidase was blocked.
Sections were sealed with 3% BSA at room temperature for 30 min and incubated with primary antibodies directed against mouse hNIS (slc5a5) (1:500), rabbit CD11c (1:200), CD11b (1:500), CD19 (1:200), IL-6 (1:500), Ki67 (1:500), TNF-α (1:200), and iNOS (1:1,000) overnight at 4°C. The corresponding secondary antibodies were added and incubated at room temperature for 1 h. DAB chromogenic solution was added to the histochemical circle and the positive tissue or cell structure was stained brownish yellow. The positive area of DAB was observed under an optical microscope (Pannoramic MIDI, 3D histech, Hungary).
Flow cytometry
Half of the tumor tissue was soaked in MACS Tissue Storage Solution (Miltenyi, Germany) and then was dissociated into single-cell suspensions using Tumor Dissociation Kit (Miltenyi, Germany) by gentle MACS Dissociator (Miltenyi, Germany). The cell concentration of single-cell suspensions was adjusted to 1–2 × 10⁶/mL in 1640 medium (Gibco, NYS) containing 10% fetal bovine serum and cells were stimulated by BFA-containing stimulant Cell Activation Cocktail (BioLegend, California) (2 μL added to 1 mL 1640 medium) for 6 h in an incubator (37°C, 5% CO2).
At the end of the culture, cells were collected and washed with 2 mL PBS twice. Cells were added with the live/dead dye Zumbe NIRTM (BioLegend) and incubated for 15 min with light avoidance. After washing with 2 mL PBS, cells were added with surface staining antibodies (PerCP-CD45; BioLegend) and incubated for 20 min without light. Then, nucleation-breaking membrane buffer (Thermo Fisher Scientific, MA) was used to break the nuclear membrane.
Afterward, samples were added with antibodies (purified-iNOS; Abcam, Shanghai; APC-Ki67; BioLegend) and incubated for 30 min at room temperature without light to get intranuclear staining. After washing with 1 × membrane-breaking solution, samples were added with AF488 fluorescent secondary antibody (Abcam) and incubated at room temperature without light for 30 min. Stained samples were washed and resuspended in 250 μL PBS. Samples were tested on Beckman CytoFLEX S and CytoExpert software was used for data analysis.
Statistical analysis
GraphPad prism 7.0 was used for data analysis. One-way analysis of variance was used to compare multiple groups of independent samples. When a statistical difference was observed, a nonparametric test was used to compare the differences between every two groups. p-Values of <0.05 indicated statistically significant findings (**** <0.0001, *** <0.001, ** <0.01, * < 0.05).
RESULTS
Lentiviral transfection and hNIS gene expression
The Egr1, hNIS, GFP, and puromycin resistance gene fragments were inserted into the lentiviral genome. The structure of the lentiviral vector is shown in Fig. 1A. After lentivirus transfection, GFP expression was observed in the cytoplasm by laser confocal microscope and confirmed successful transfection (Fig. 1B). The results of the puromycin screening assay showed that all BMSCs were killed on day 4 after transfection when the concentration of puromycin reached 4 μg/mL (Fig. 1C). This concentration was used to generate stable cell lines that were named BMSCs-Egr1-hNIS (experimental group) and BMSCs-Egr1-NC (negative control group).
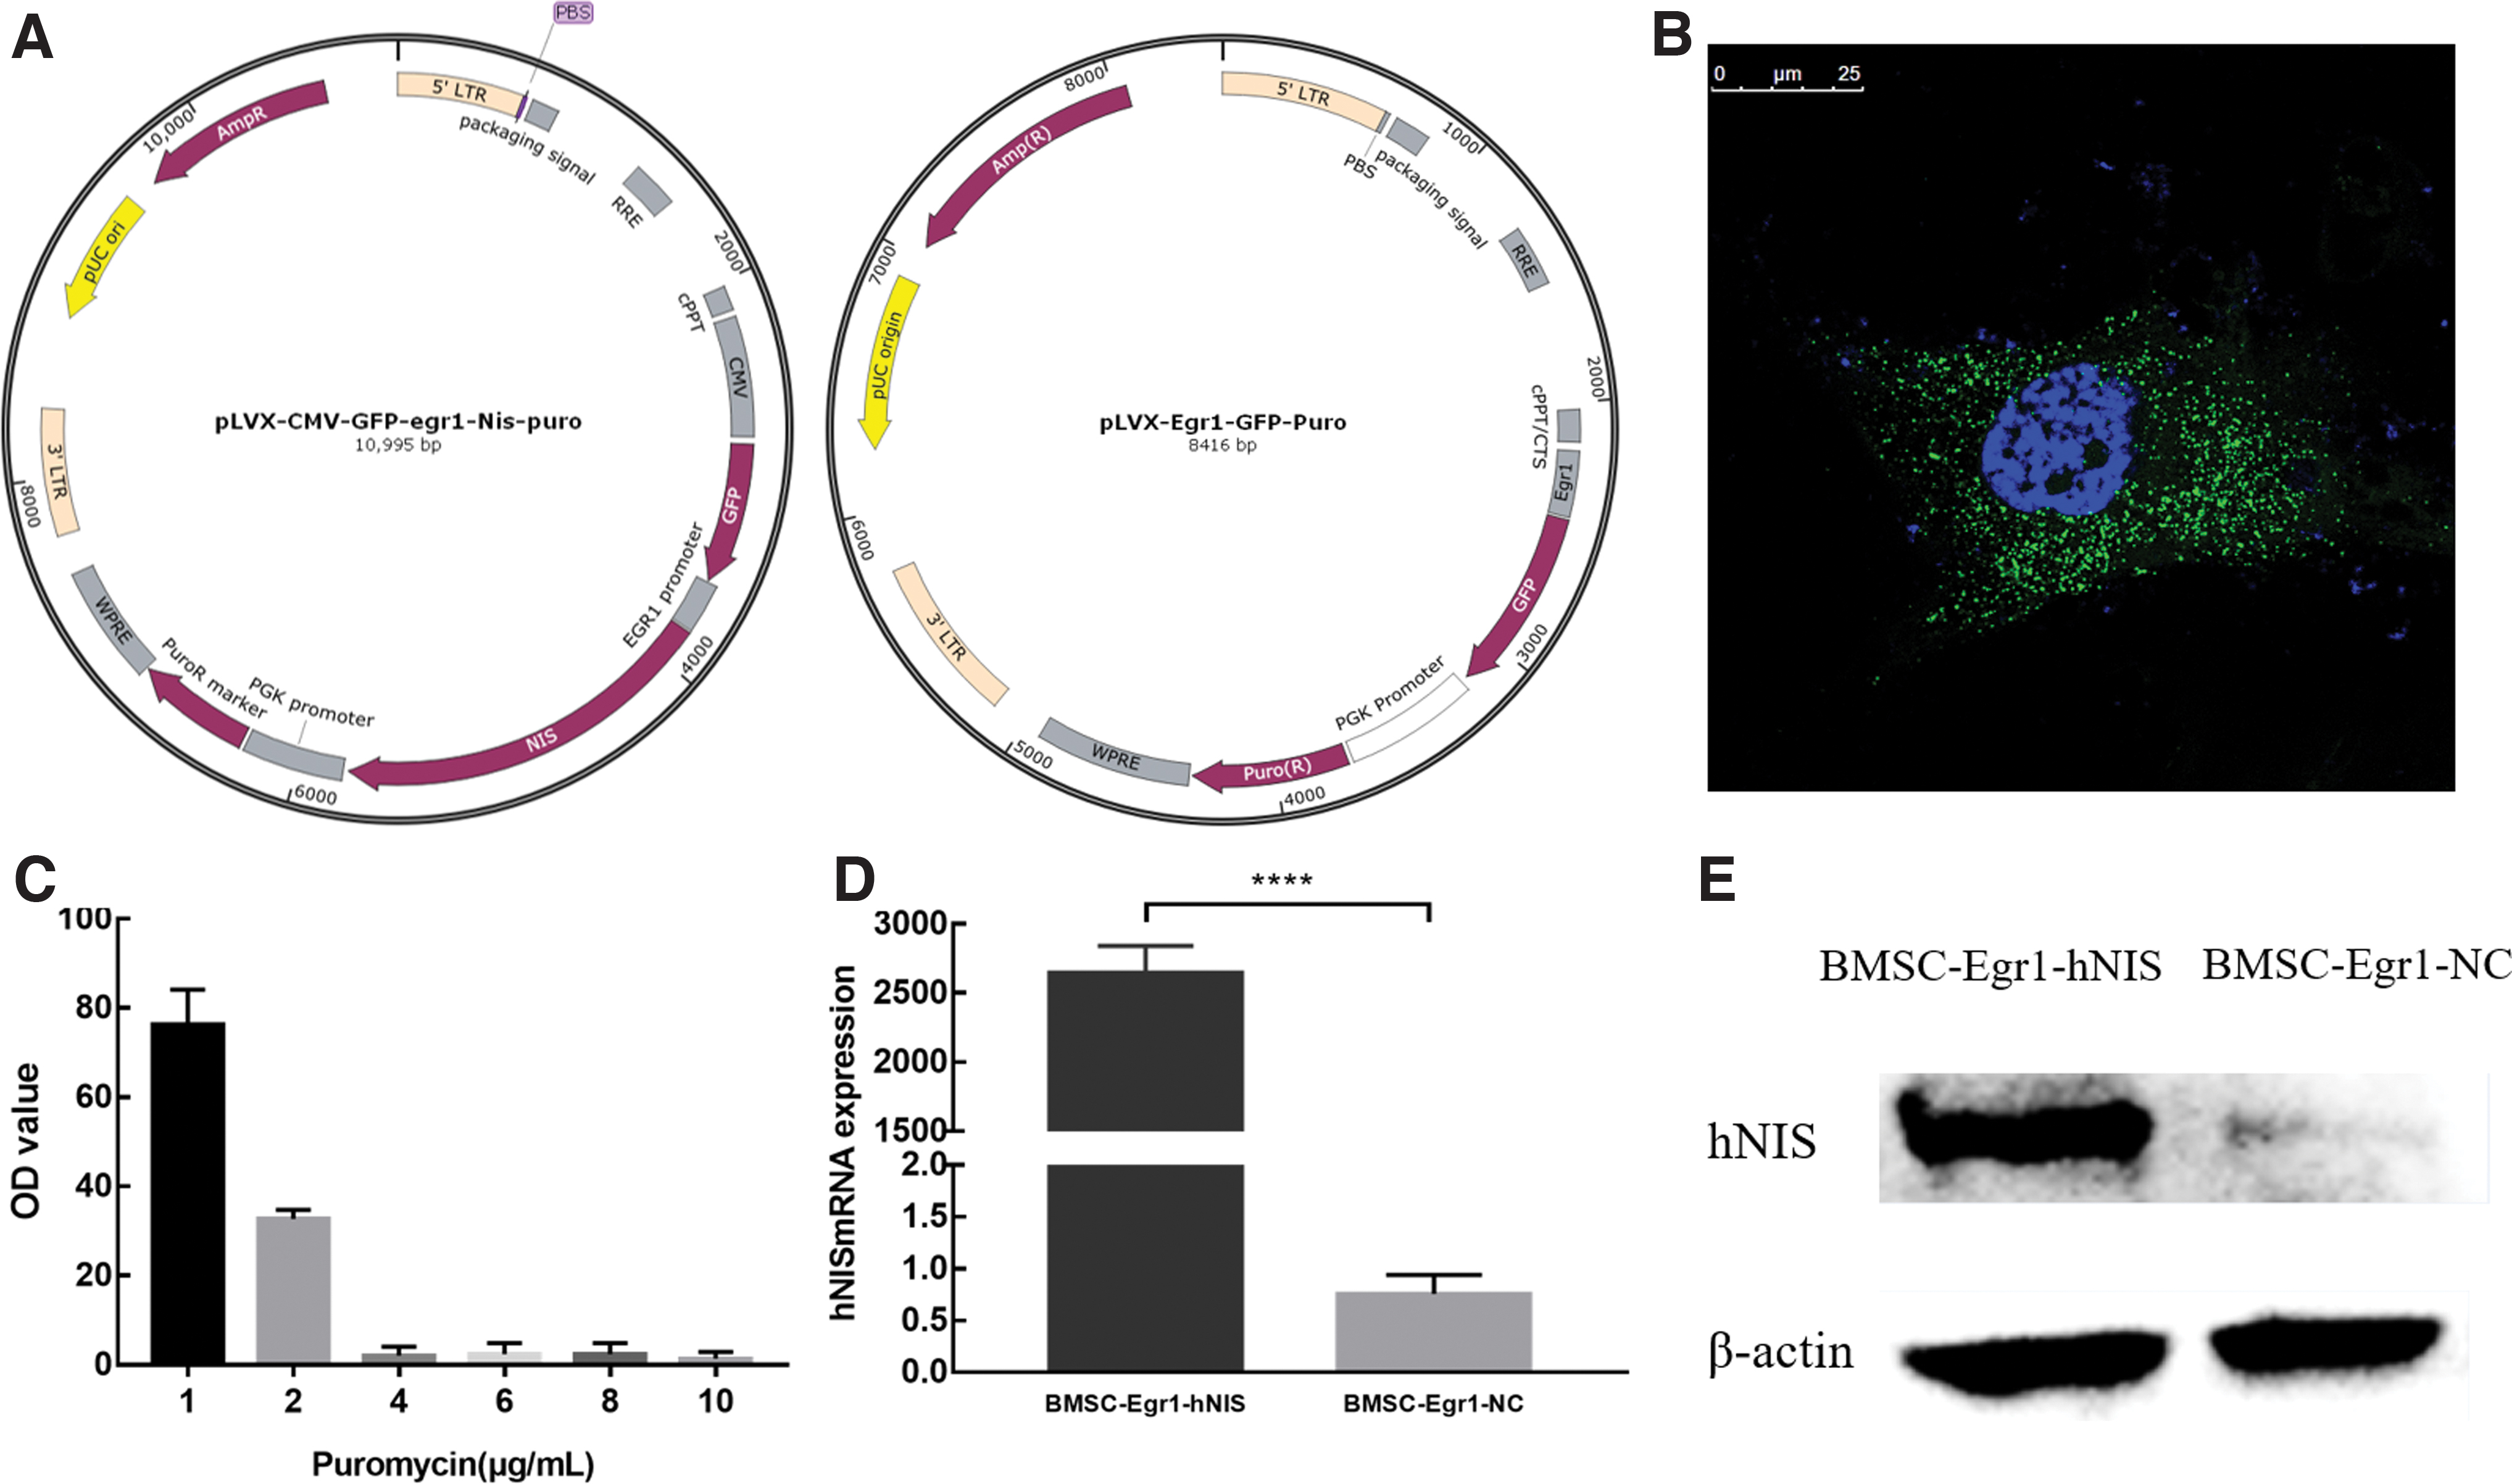
Lentiviral transfection and gene expression of hNIS.
The qRT-PCR (Fig. 1D) and western blotting (Fig. 1E) results confirmed that BMSCs-Egr1-hNIS cells expressed significantly higher levels of hNIS after radiation induction compared with the control group (p < 0.0001). These data confirmed the successful construction of a cell line that stably expressed the hNIS gene and synthetized hNIS protein. The increased levels of hNIS expression can be used to ultimately achieve applications through increases in radioiodine uptake.
Observations of iodine uptake and excretion
The iodine uptake assay results showed that the iodine uptake of BMSCs-Egr1-hNIS cells increased gradually with increasing concentrations of 131I and prolongation of 131I inductive times. The most significant difference between BMSCs-Egr1-hNIS and BMSCs-Egr1-NC was observed when the 131I concentration exceeded 100 μ Ci/mL (Fig. 2A) and lasted for 36 h (Fig. 2B). The in vitro cell efflux assay showed that radioiodine could not continuously remain in the cells and rapidly flowed out of the cells within 30 min (Fig. 2C).
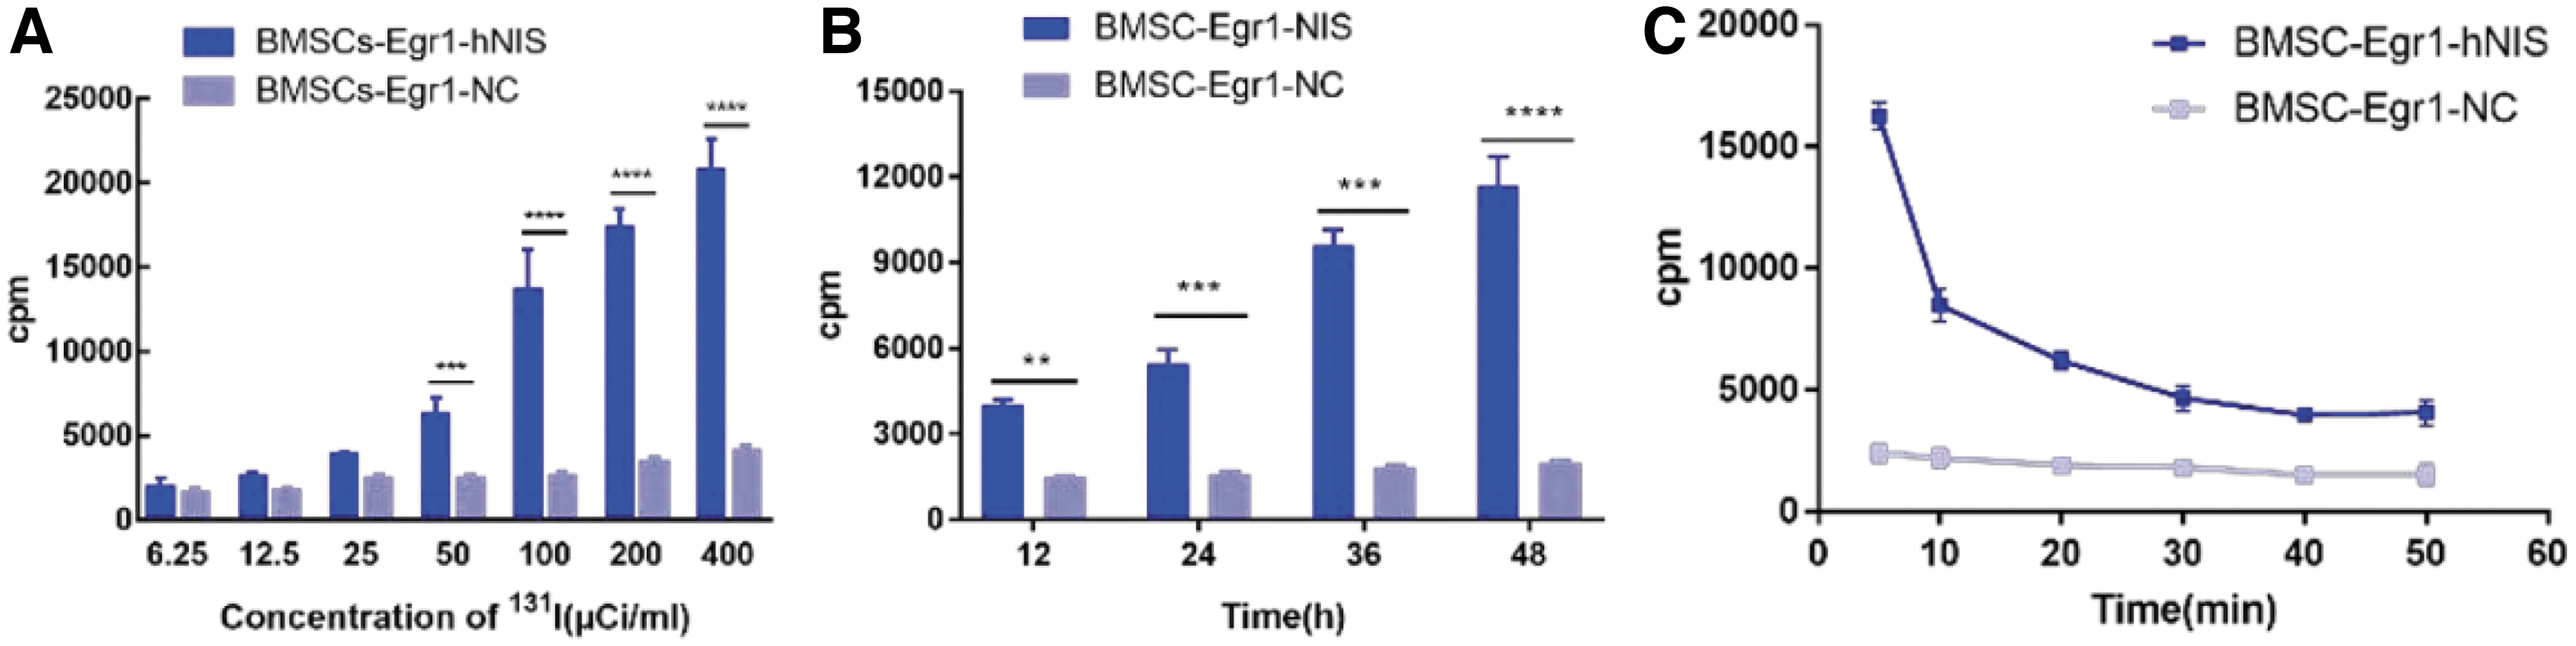
Observations of iodine uptake and excretion in transgenic stem cells.
Chemotaxis, adipogenic, and osteogenic characteristics
Further studies were performed to determine if the original characteristics of the stem cells were affected after lentiviral transfection. Transwell assays showed that BMSCs-Egr1-hNIS and BMSCs-Egr1-NC cells in vitro still had a chemotactic response to MDA-MB-231 cells, which was not significantly different from primary cells (Fig. 3A). In the adipogenic induction experiment, BMSCs-Egr1-hNIS and BMSCs-Egr1-NC cells were induced to produce a large number of lipid droplets indicating adipogenic differentiation (Fig. 3B). In the osteogenic induction experiment, a bone callus was observed in both BMSCs-Egr1-hNIS and BMSCs-Egr1-NC, indicating osteogenic differentiation had occurred (Fig. 3C).
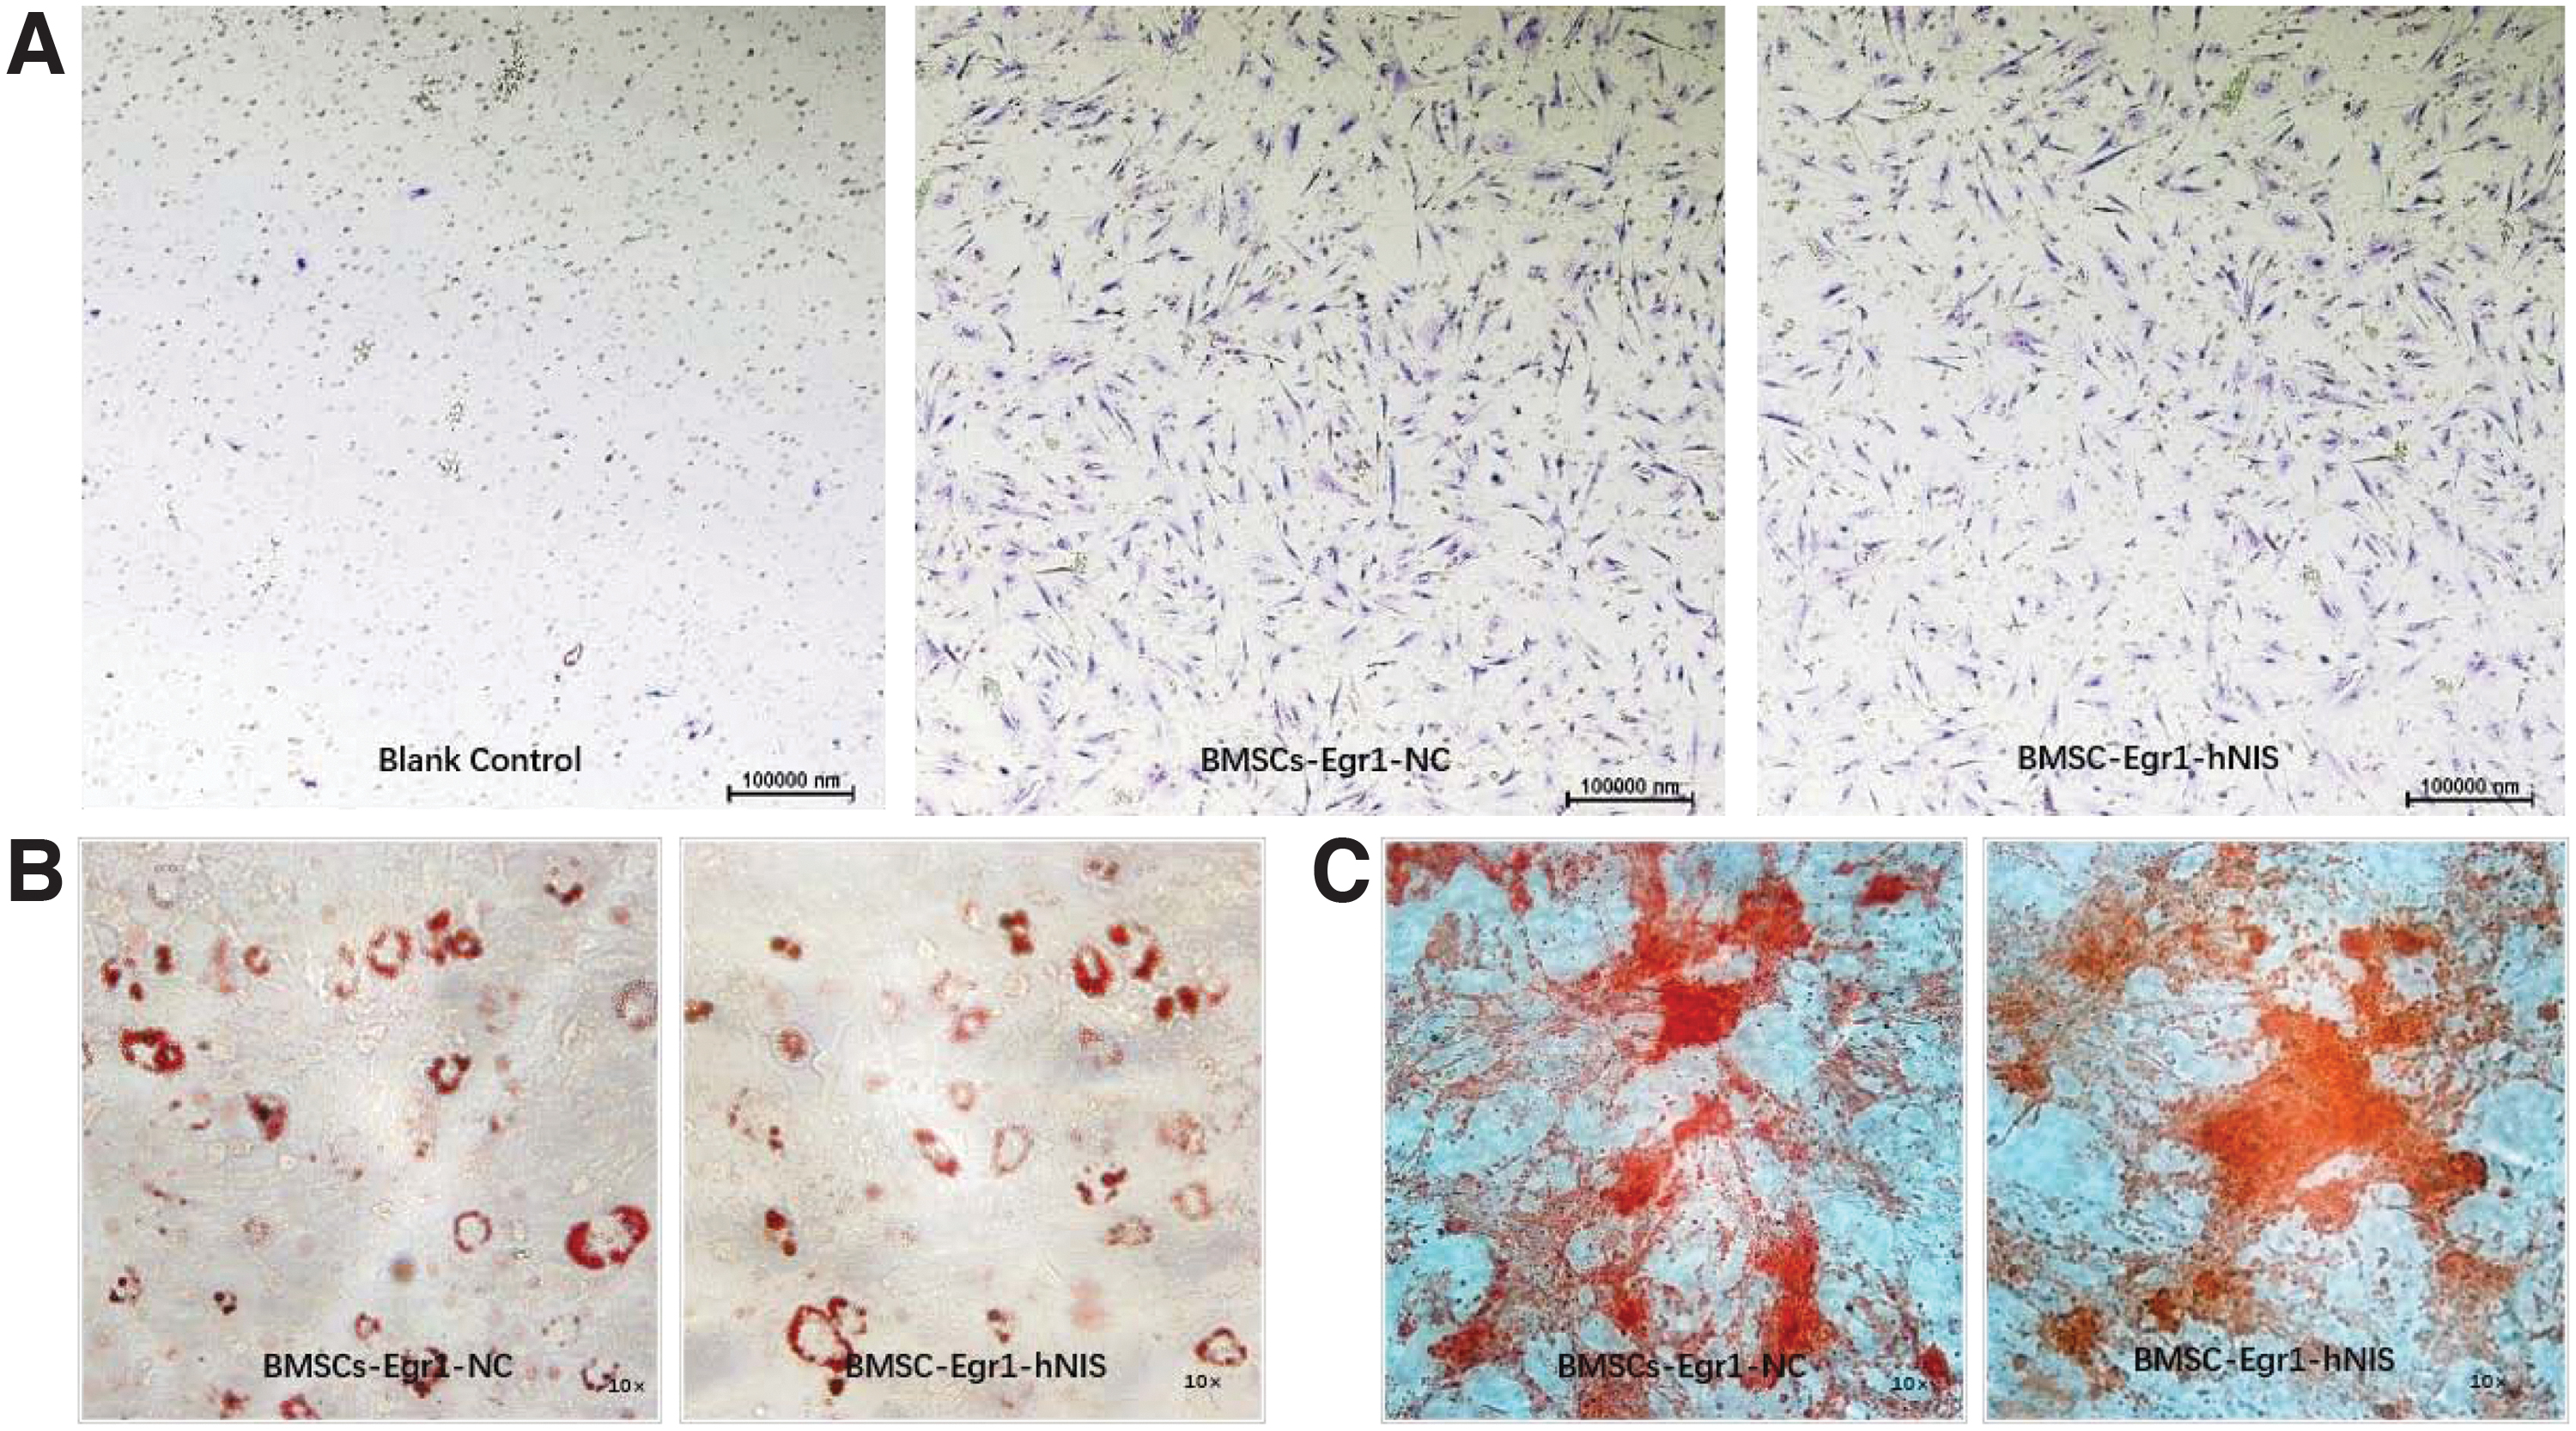
Characteristics of the BMSCs-Egr1-hNIS and BMSCs-Egr1-NC.
Verification of in vivo targeting ability and effect evaluation of gene-mediated 131I therapy
131I-SPECT imaging showed that the presence of the radioactive tracer in the thyroid and stomach of nude mice indicating the physiological biodistribution of 131I. Within the range of administered activities of 131I, low absorbed doses to normal tissues are delivered. 8 Thus, normal tissue dosimetry is not usually required. 9
In the BMSCs-Egr1-hNIS group, a large amount of radioactive tracer accumulated in the right axillary tumor of nude mice compared with the control group, which lasted for 24 h (BMSCs-Egr1-NC) (Fig. 4A). 131I-SPECT imaging of animal organs after dissection further confirmed the radioactive uptake within the tumor (Fig. 4B). The results of the immunohistochemistry analysis confirmed the expression of hNIS in MDA-MB-231 tumors in the experimental group demonstrating that BMSCs-Egr1-hNIS could target to TNBC (Fig. 4C).
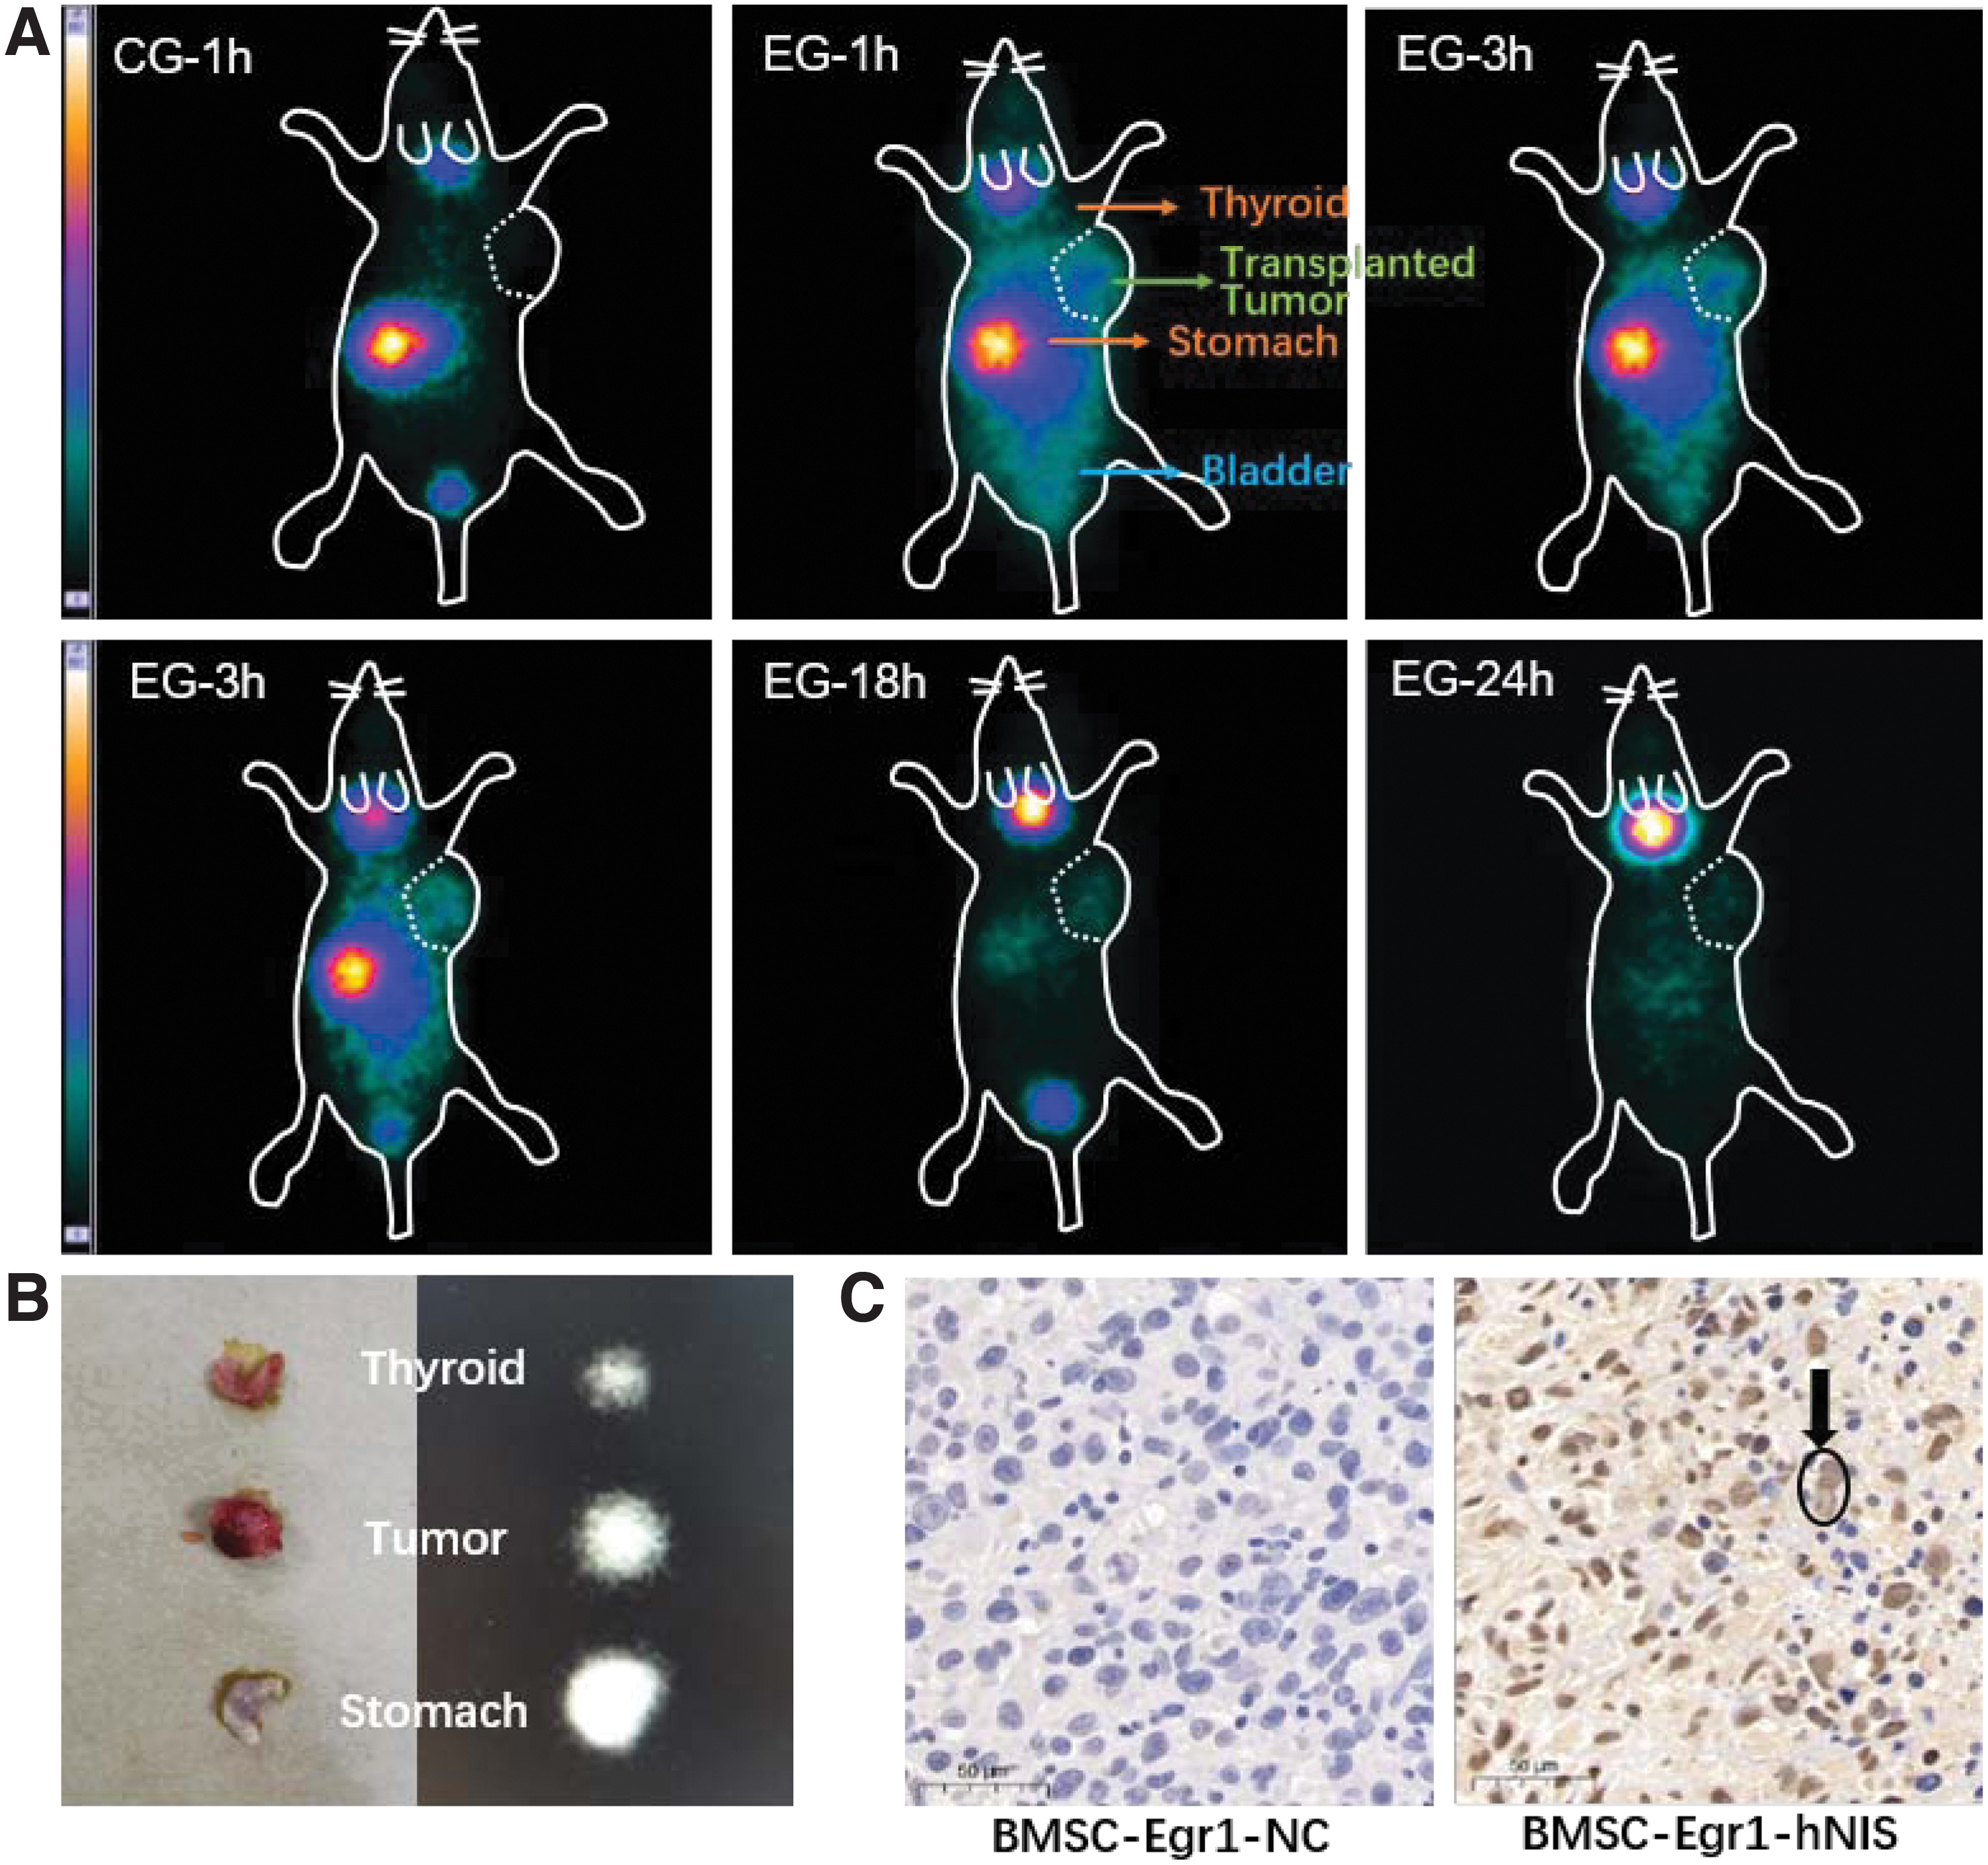
Verification of the in vivo targeting.
Combined with anatomical photos at the end of the treatment, we found that the rate of tumor proliferation in BMSCs-Egr1-hNIS therapy group was slower than the other three control groups (Fig. 5A). Meanwhile, the final average tumor growth volume in the BMSCs-Egr1-hNIS therapy group, BMSCs-Egr1-NC therapy group, BMSCs-Egr1-hNIS nontherapy group, and BMSCs-Egr1-NC nontherapy group was 427.79, 728.77, 895.44, and 722.78 mm3, respectively, and the differences have statistical significance (Fig. 5B).
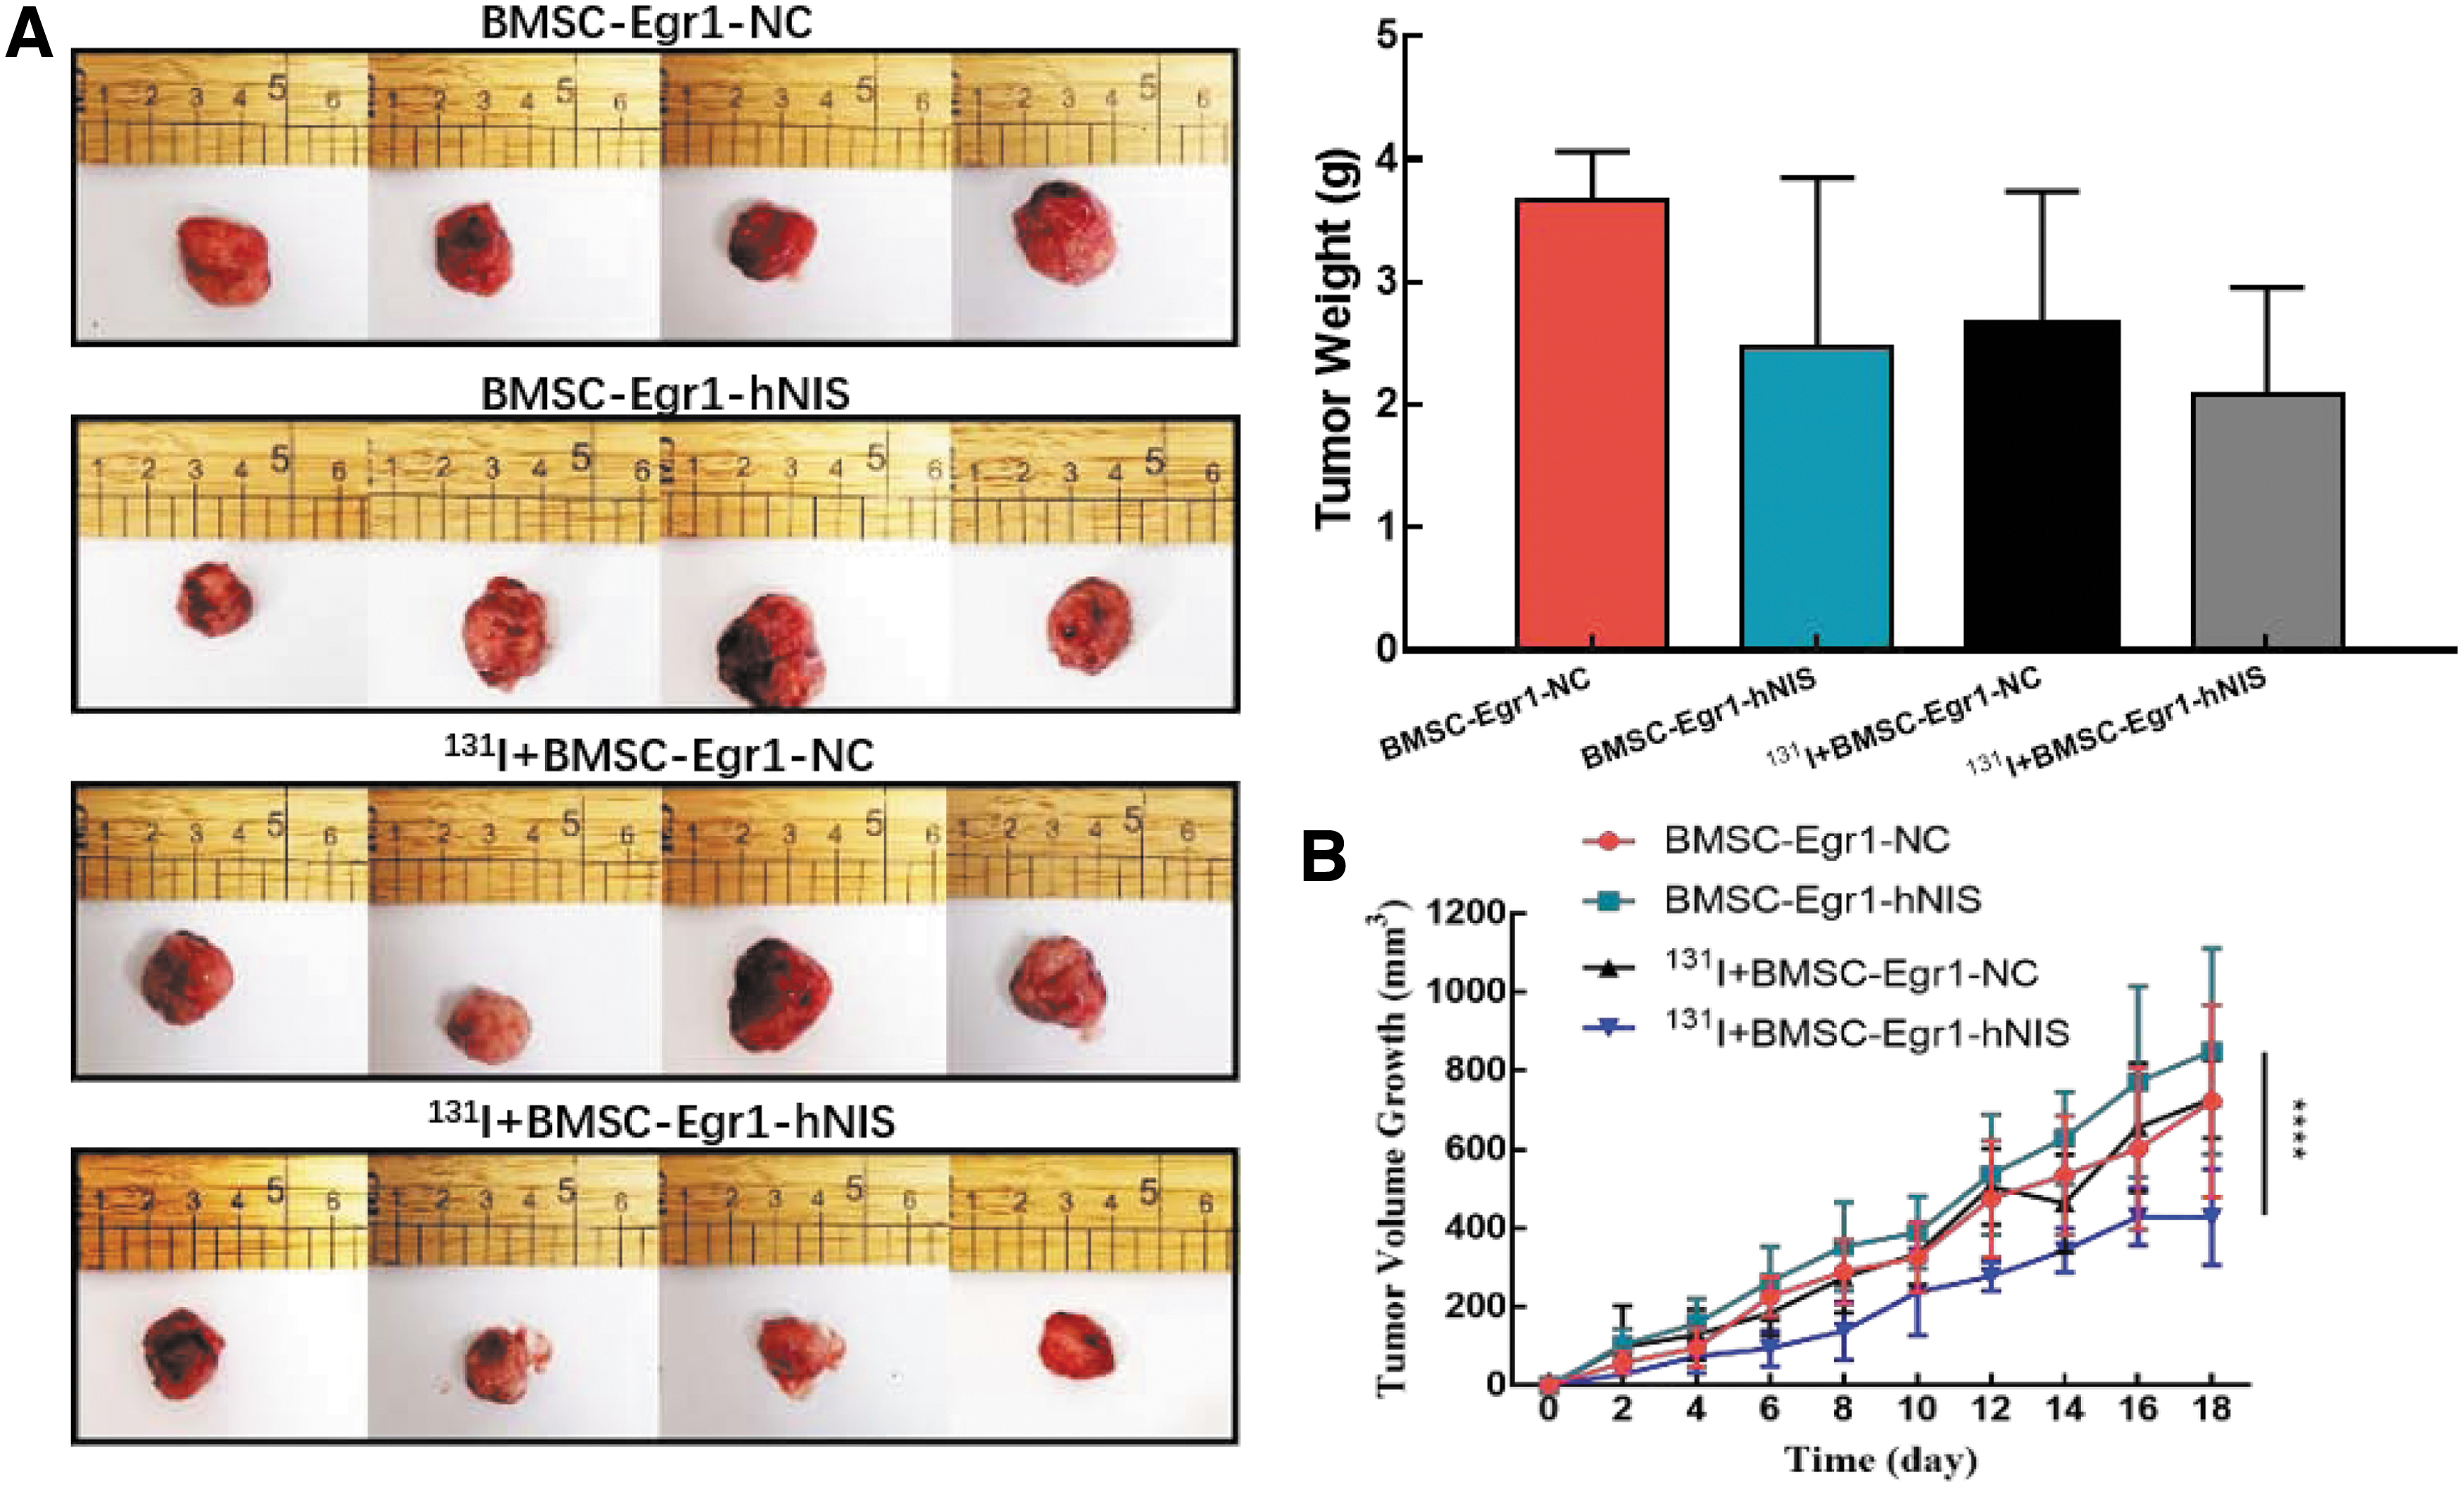
In vivo effect evaluation of gene-mediated 131I therapy.
Immunohistochemistry and flow cytometry analysis of TME after hNIS gene-mediated 131I therapy
After radiation therapy, immunohistochemistry and flow cytometry were used to analyze infiltration of immune cells, white blood cells (CD45+), expression of TNF-α, Ki67, and iNOS within the TME among different therapy groups. We can observe from the immunohistochemical results in Fig. 6 that a large number of CD11b- and CD19-positive cells were dispersed among the tumor cells in the BMSCs-Egr1-hNIS-mediated 131I therapy group indicating the accumulation of immune cells in the tumor after radiotherapy. Meanwhile, we can observe more expression of TNF-α (red arrow) and less expression of Ki67 and iNOS in the BMSCs-Egr1-hNIS-mediated 131I therapy group.
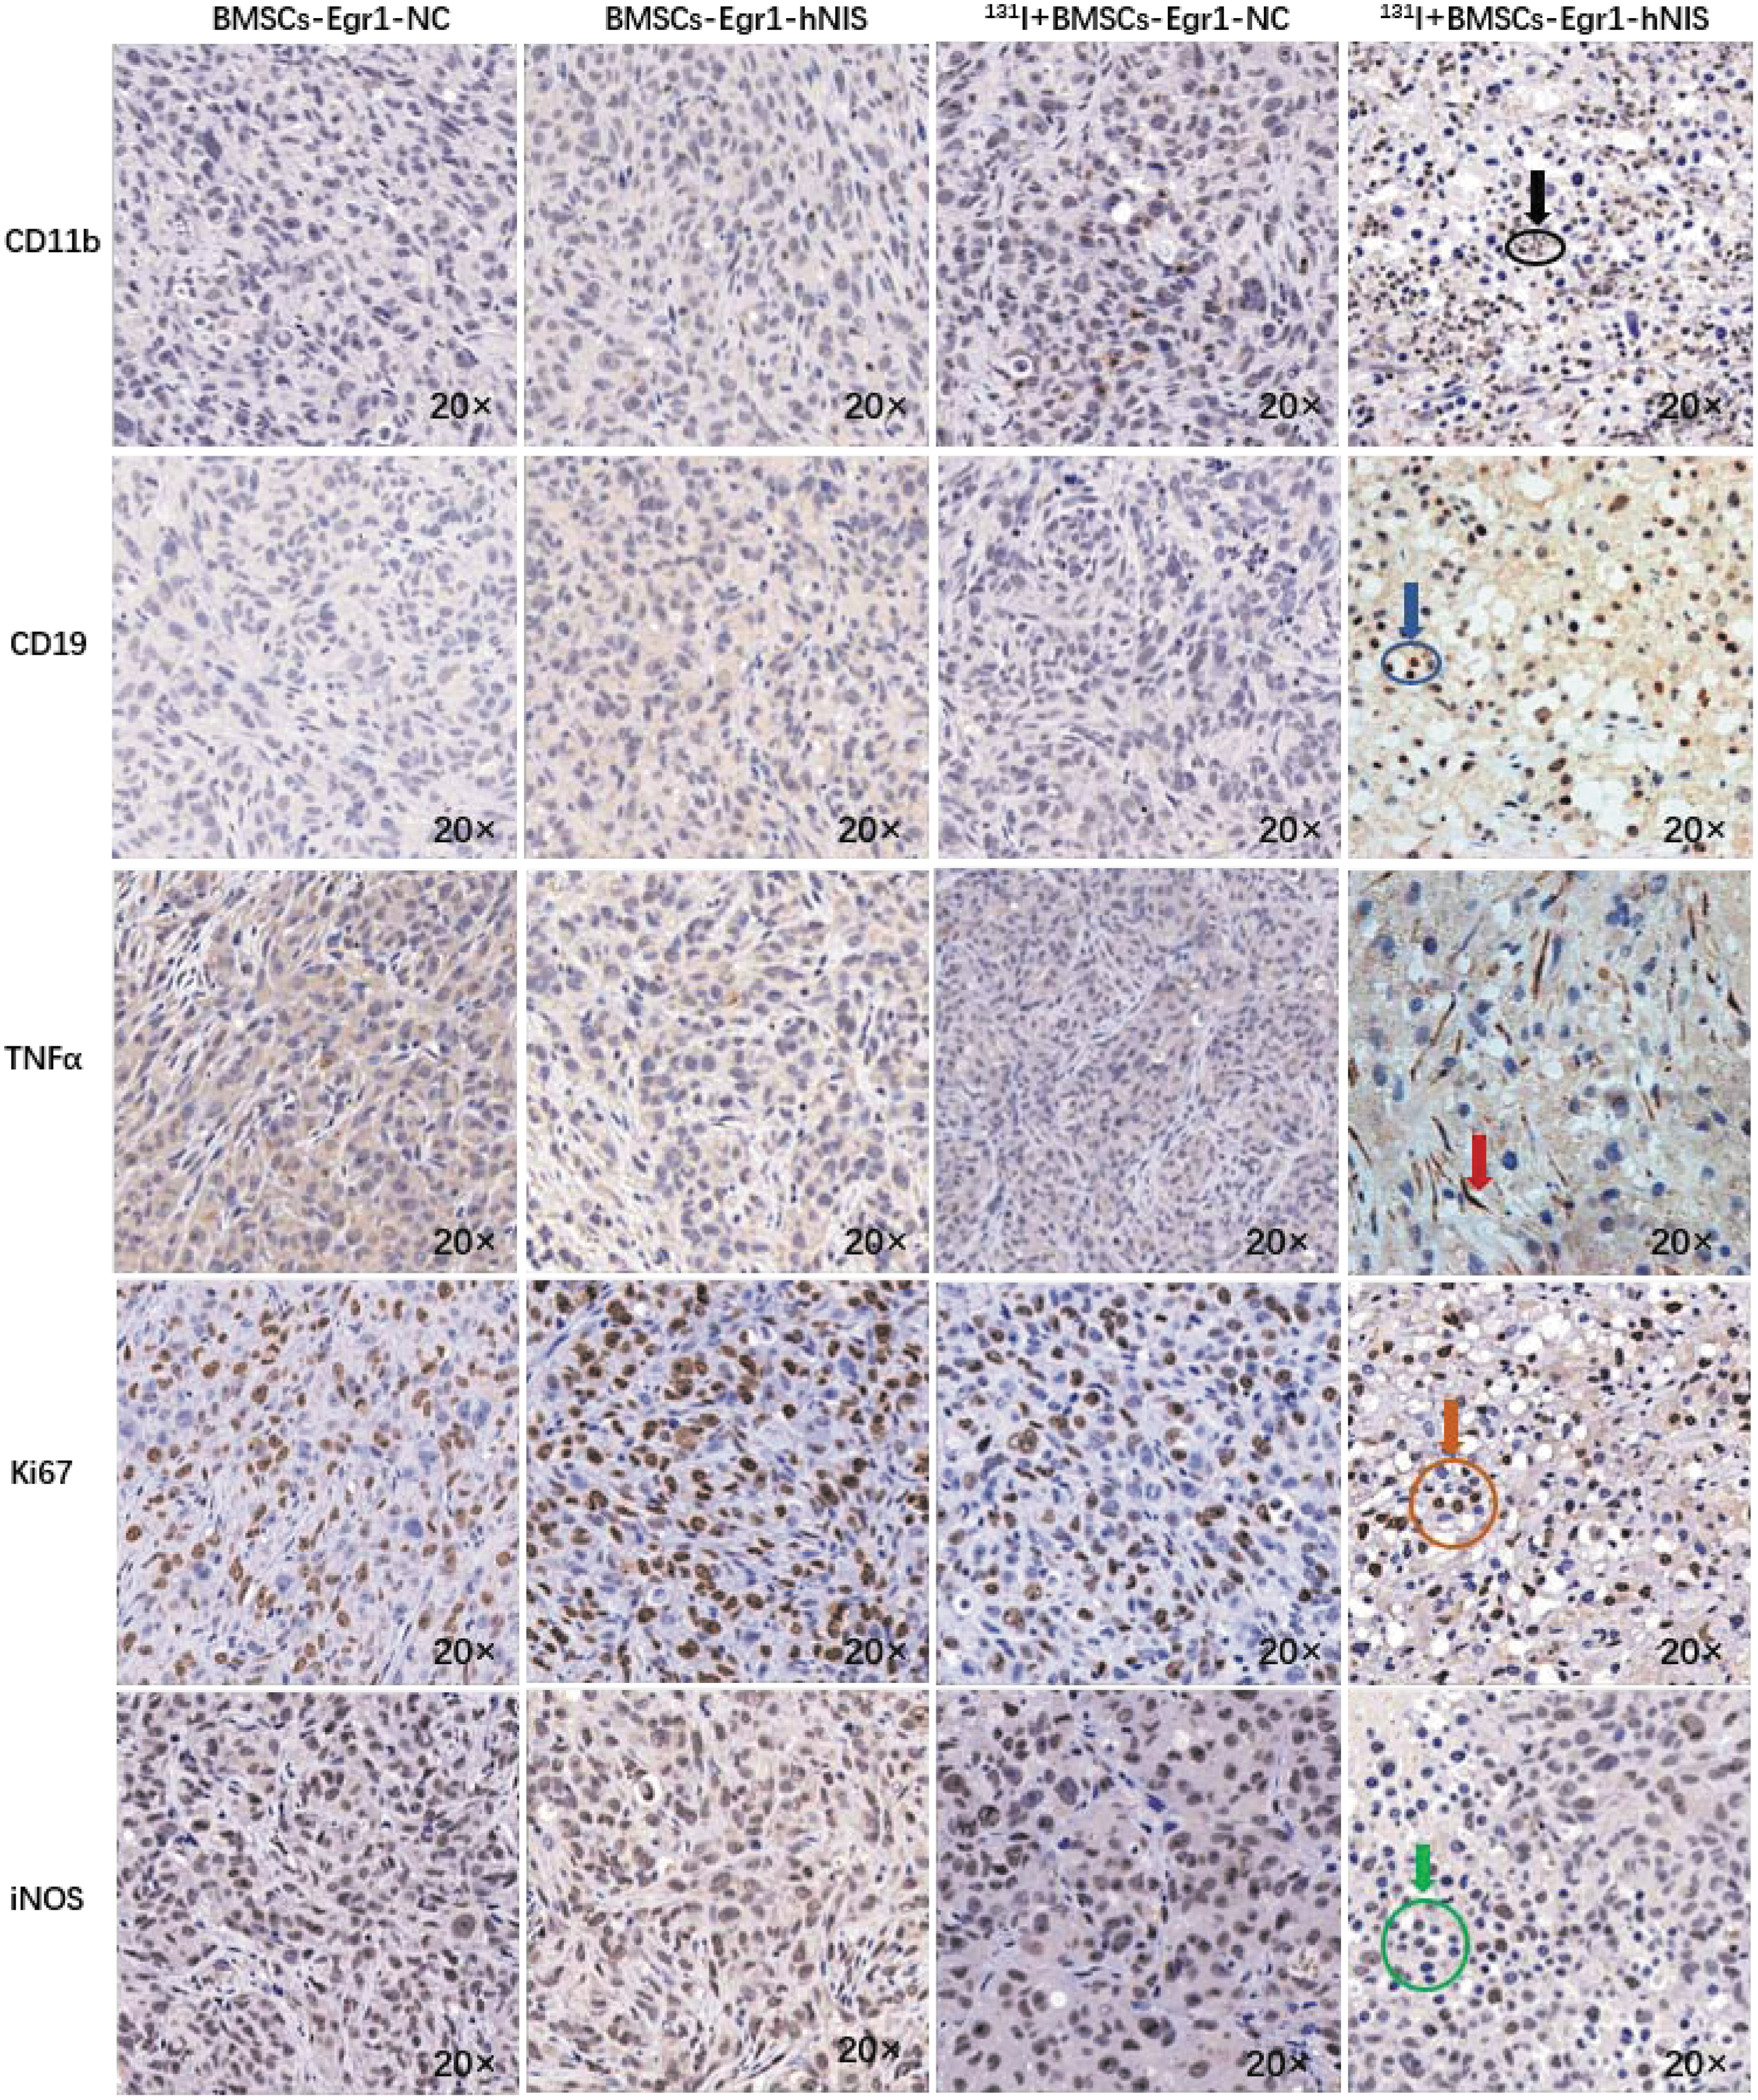
Immunohistochemistry was used to observe immune cells and cytokines in tumors among different therapy groups by using an optical microscope (20 × objective lens). The expression of CD11b (black arrow and ring), CD19 (blue arrow and ring), and TNF-α (red arrow) increased, but the expression of Ki67 (orange arrow and ring), iNOS (green arrow and ring), and iNOS reduced in the 131I+ BMSCs-Egr1-hNIS group. Color images are available online.
It can be seen from the quantitative analysis results of flow experiment (Fig. 7) that the distribution of CD45-positive cells (white blood cells), the expression of TNF-α in BMSCs-Egr1-hNIS-mediated 131I therapy group was obviously more than BMSCs-Egr1-NC-mediated 131I therapy group, BMSCs-Egr1-hNIS, and BMSCs-Egr1-NC without 131I therapy groups. Conversely, the expression of Ki67 and iNOS in BMSCs-Egr1-hNIS-mediated 131I therapy group was obviously less than the other three groups.
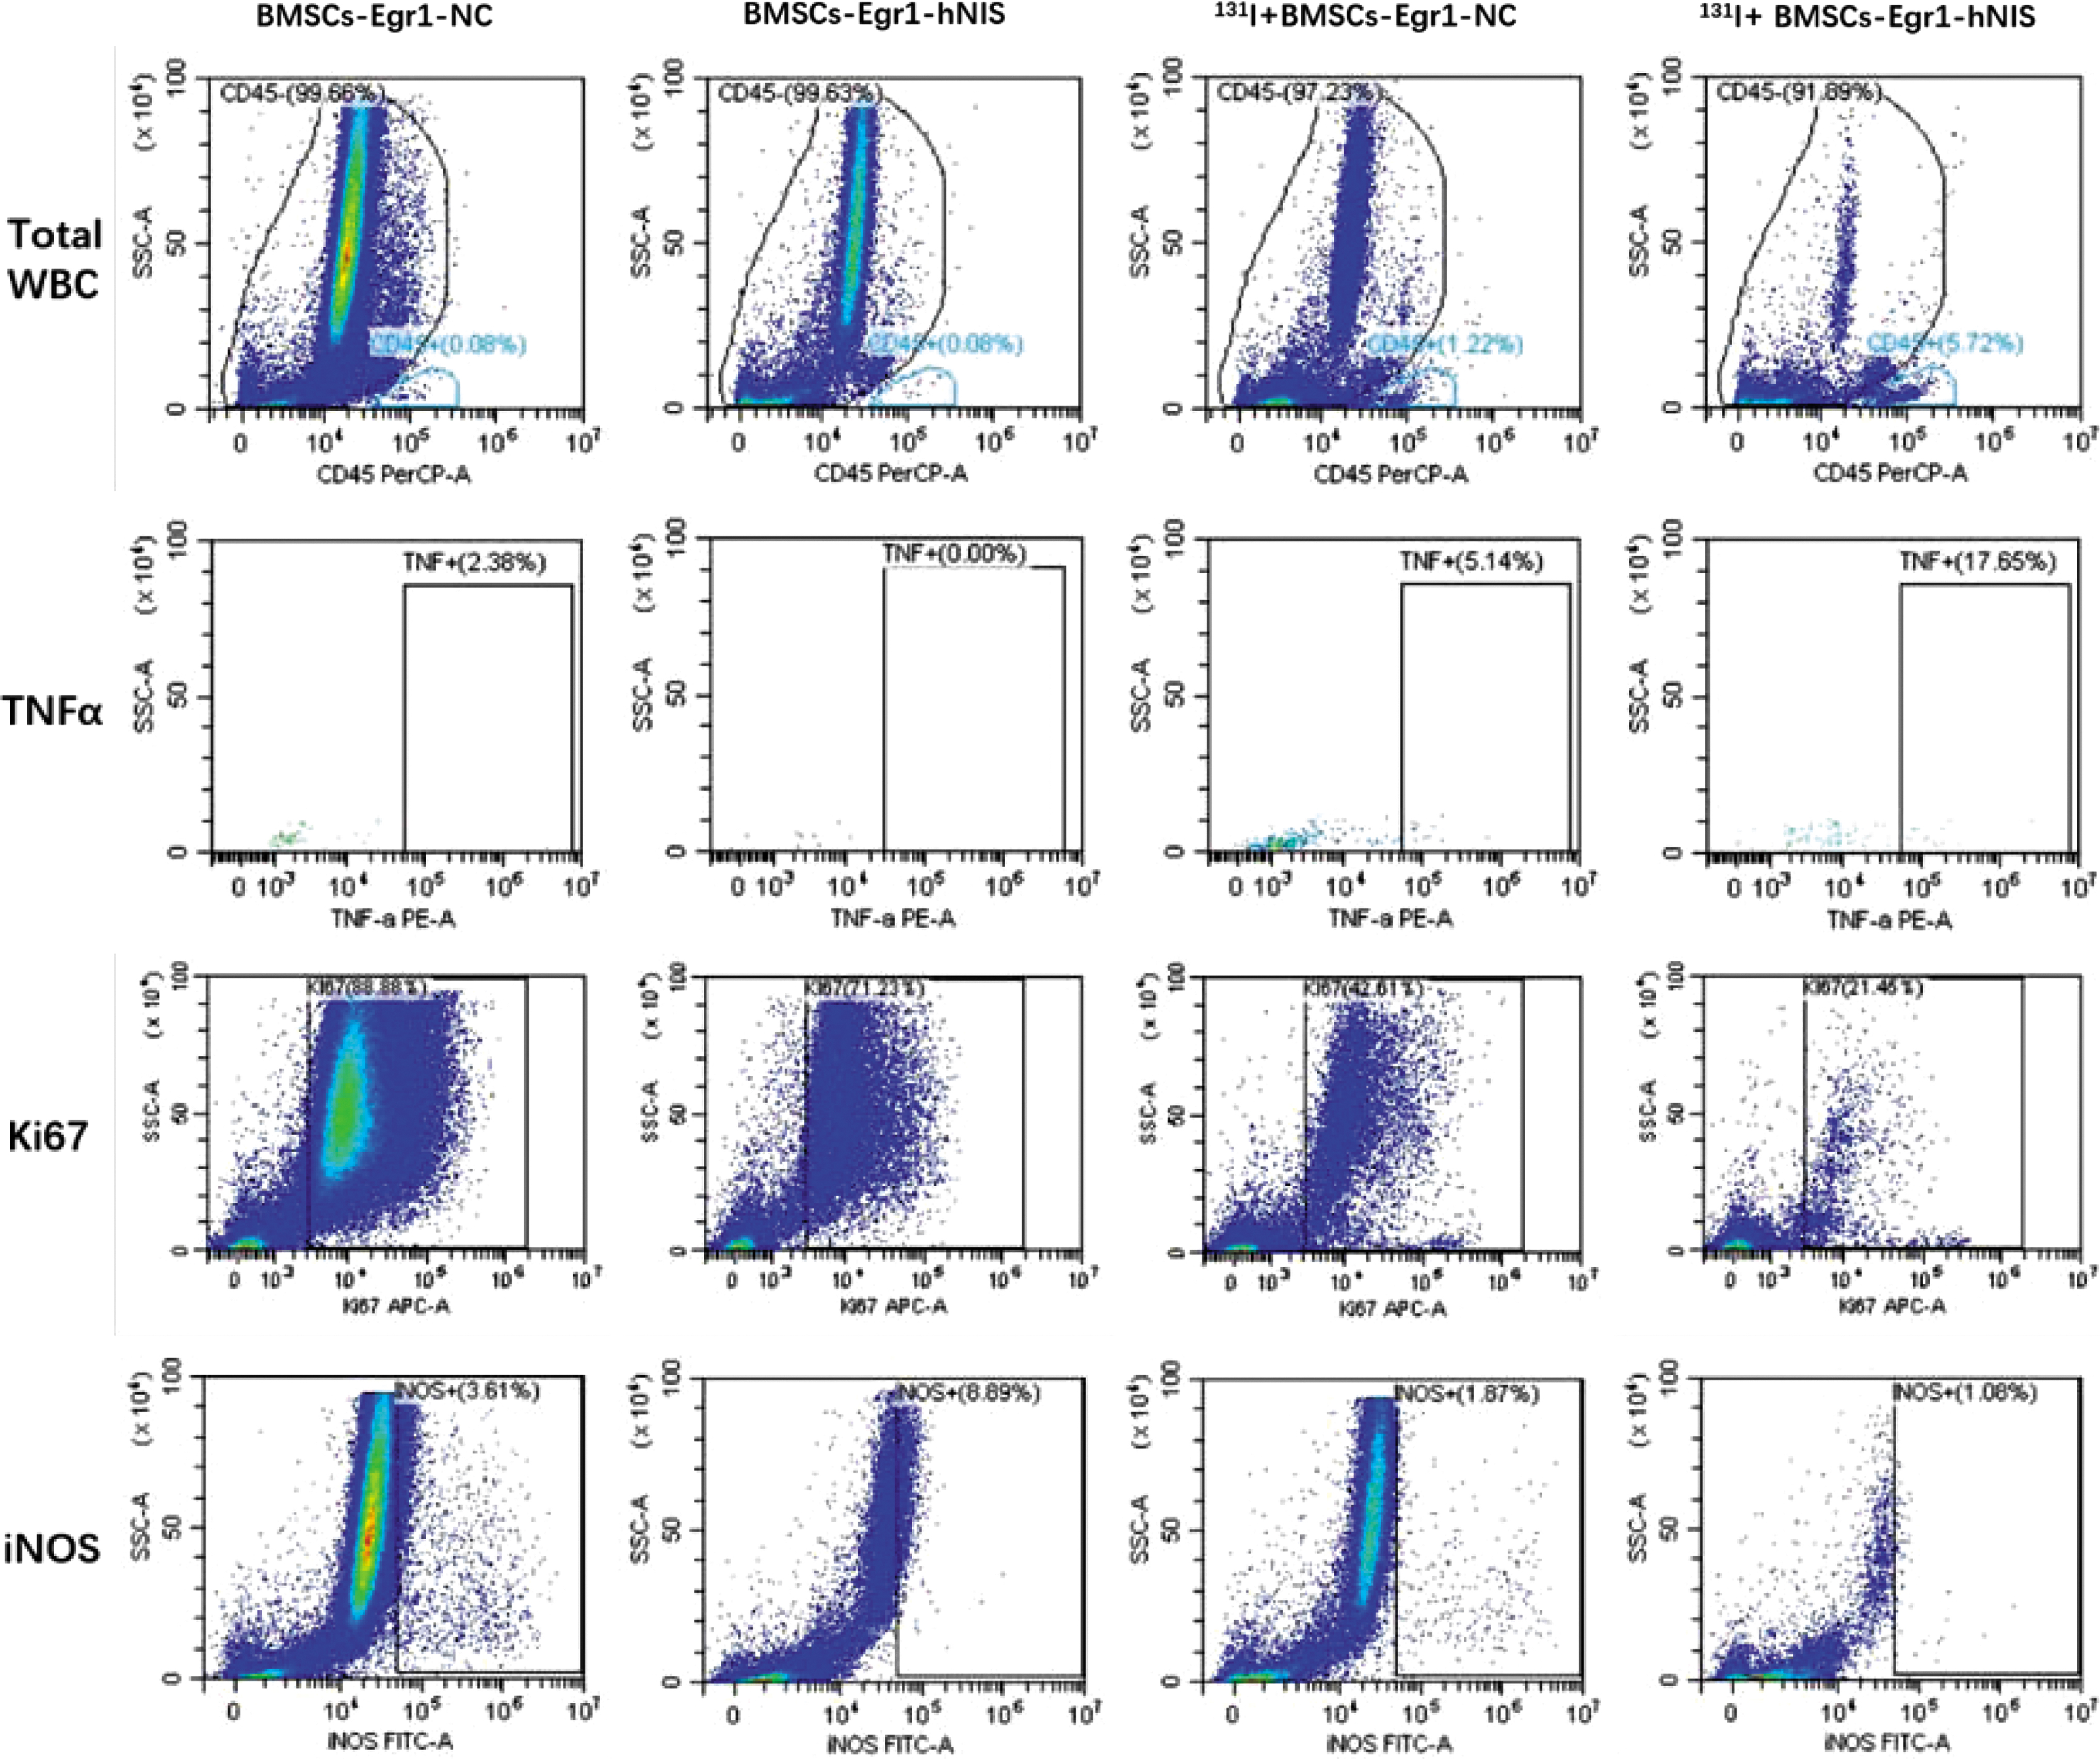
Flow cytometry was used to analyze the infiltration of white blood cells and cytokines in tumors among different therapy groups. The expression of CD45+ cells, TNF-α, increased, while the expression of Ki67 and iNOS decreased in the 131I+BMSCs-Egr1-hNIS group (red boxes). Color images are available online.
DISCUSSION
BMSCs can be used as a delivery vehicle in cancer gene therapy for several reasons. BMSCs are relatively easy to isolate 10 and can be readily cultured in vitro to amplify cell populations for more than 50 generations without the loss of cellular phenotype. 11
BMSCs can migrate to the tumor site 12 and have low immunogenicity and a low rate of inherent mutation rates due to the lack of or low expression levels of MHCI and II molecules, and costimulatory molecules. 13 Sato et al. 14 injected EGFR-MSCs into C57BL/6 athymic mice and found that no tumors developed within 100 days indicating that MSCs are nontumorigenic. 15 MSCs can be located in the lung, bone marrow, lymphoid organs, and tumors following intravenous, 16 intraarterial, 17 or peritumoral administration. 18 Karp and Leng Teo 19 defined MSCs homing as the ability of “MSCs to stay in tissue blood vessels and then migrate on endothelial cells.”
Egr1 is a radiation-sensitive promoter that is activated by radiation exposure to promote the expression of downstream genes at higher levels than the frequently used CMV promoter. 5 In this study, BMSCs-Egr1-hNIS cells were established as stably expressing target gene cells to observe the effects of Egr1-hNIS-mediated 131I therapy.
We showed that the expression of hNIS in BMSCs-Egr1-hNIS cells was 2,500 times higher than in the control group after radioactive activation. Iodine uptake in BMSCs-Egr1-hNIS cells increased gradually with increasing concentrations of 131I and prolonged induction times. The differences between the BMSCs-Egr1-hNIS and BMSCs-Egr1-NC groups were most obvious at concentrations >100 μCi/mL and lasted for more than 36 h. After transfection with the therapeutic gene, no obvious influences were observed in stem cell migration to MDA-MB-231 cells and osteogenic and adipogenic differentiation.
Tumor cells continuously secrete cytokines, chemokines, and other inflammatory mediators within the TME. The factors may become ligands for MSC receptors, such as growth factor receptors, toll-like receptors, and chemokine receptors, on the surface of the MSC membrane. 20
Previous study has shown that BMSCs concentrated in the lung within 24 h after intravenous injection gradually home to the tumor area from 24 h to 5 days. 21 In this study, 131I was used to activate Egr1 in promoting downstream hNIS expression 24 h after intravenous injection of stem cells. Thirty-six hours later, when a sufficient number of stem cells expressing hNIS had accumulated in the tumor area, micro 131I-SPECT scanning was performed to observe the radioactive uptake of tumor within 24 h. Immunohistochemical results showed that BMSCs-Egr1-hNIS cells expressing hNIS (brown cells) were distributed among the MDA-MB-231 tumor. The observations further confirmed that BMSCs-Egr1-hNIS could target TNBC and demonstrate this approach as a potential in vivo strategy for the monitoring of radionuclide imaging and gene therapy.
In vitro, we observed that intracellular radioactive iodine rapidly flowed out of cells within 30 min. However, in vivo, we observed that radioiodine can be stored in tumors for 24 h for iodine cycle and reuptake of cells. Spitzweg et al. 22 showed that radioiodine therapy in prostate cancer cells after exogenous NIS gene transfection is effective even without iodic organization. This can be attributed to the fact that targeting radioisotope therapy is related to at least two bystander effects, including cross-emission by adjacent radioactive cells and the formation of reactive oxygen species. 23
After 131I therapy, we observed that the growth of tumor was significantly inhibited in 131I+BMSC-Egr1-hNIS group compared with 131I+BMSC-Egr1-NC therapy group, BMSC-Egr1-NC group, and BMSC-Egr1-hNIS group. The experimental results confirmed that BMSC-Egr1-hNIS-mediated 131I therapy can inhibit the growth of TNBC. In addition to the above factors, radiotherapy can also be enhanced by influencing the TME. Ki67 is a cell proliferation-related protein that is expressed in highly proliferative TNBC tumors. TNF-α is an inflammatory cytokine that inhibits tumor cell growth. 24 After BMSC-Egr1-hNIS-mediated 131I treatment, Ki67 expression in tumor was reduced and TNF-α expression in the tumor was increased indicating inhibited tumor cell proliferation.
CD45 molecule is expressed on all white blood cells and is called a common leukocyte antigen. CD11b is mainly expressed in non-T cells in the spleen and CD4+T cell subsets in the lymph nodes. CD19 is an important membrane antigen expressed on B cells that is involved in the proliferation, differentiation, activation, and antibody production of B cells. In this study, we found that CD45-positive, CD11b-positive, and CD19-positive cells accumulated in BMSC-Egr1-hNIS-mediated 131I therapy group and obviously more than the other three positive and negative control groups, which signified that BMSC-Egr1-hNIS-mediated 131I treatment can promote white blood cells, including lymphocyte to infiltrate into tumors and enhance the inflammatory response and immune phagocytosis of tumor cells.
In TNBC, iNOS expression is related to higher tumor stage, increased invasion, and poor prognosis. 25,26 iNOS inhibition can reduce TNBC cell proliferation, self-renewal, and cell migration. 27 In this study, we also found that the expression of iNOS in BMSC-Egr1-hNIS-mediated 131I therapy group decreased significantly compared with the other three positive and negative control groups. Therefore, we can draw the preliminary conclusion that the radiation injury can also decrease the invasion and migration ability of TNBC.
CONCLUSIONS
BMSC-mediated Egr1-hNIS gene therapy can achieve tumor-targeted radiation therapy. BMSC-Egr1-hNIS-mediated 131I radioactive therapy promotes the aggregation of white blood cells at the tumor site and has the potential to reduce the aggressiveness and distant metastasis of TNBC cells.
Footnotes
AUTHOR DISCLOSURE
No competing financial interests exist.
FUNDING INFORMATION
This study was supported by the National Nature Science Foundation of China (81671715, 81501499), Shanghai Municipal Key Clinical Specialty (No. shslczdzk03403).