
Abstract
Pompe disease is an autosomal recessive lysosomal storage disorder caused by deficiency of acid α-glucosidase (GAA), resulting in skeletal muscle weakness and cardiomyopathy. Muscle weakness progresses despite currently available therapy, which has prompted the development of gene therapy with adeno-associated virus (AAV) type 2 vectors cross-packaged as AAV8 (2/8). Preclinical studies of gene therapy demonstrated that the minimum effective dose (MED) for biochemical correction with AAV2/8-LSPhGAA was ∼2 × 10¹¹ vector genomes (vg)/kg body weight. The current study examined the transduction of AAV2/8-LSPeGFP vector in adult GAA-KO mice with Pompe disease, and correlated that degree of transduction with the biochemical correction achieved by the same dose of AAV2/8-LSPhGAA. The MED was found to be ∼2 × 10¹¹ vg/kg, with all hepatocytes variably transducing at this dose. At this dose, liver GAA significantly increased, while liver glycogen significantly decreased. The 2 × 10¹¹ vg/kg dose was sufficient to significantly decrease diaphragm glycogen.
However, the heart, diaphragm, and quadriceps all required a fourfold higher dose to achieve correction of GAA deficiency in association with significant clearance of stored glycogen, which correlated with increased serum GAA activity. These data indicate that AAV2/8-LSPeGFP transduced all hepatocytes when the 2 × 10¹¹ vg/kg dose was administered, which correlated with partial biochemical correction from the equivalent dose of AAV2/8-LSPhGAA. Altogether, these data support the conclusion that substantial transduction of the liver is required to achieve biochemical correction from AAV2/8-LSPhGAA.
BACKGROUND
Pompe disease is an autosomal recessive lysosomal storage disorder caused by deficiency of acid α-glucosidase (GAA), resulting in skeletal muscle weakness and cardiomyopathy. The degree of GAA deficiency correlates with clinical outcomes, with severe deficiency causing infantile-onset Pompe disease (IOPD) that in absence of successful treatment results in cardiorespiratory failure due to progressive cardiomyopathy and respiratory muscle weakness. 1
Enzyme replacement therapy (ERT) was granted marketing approval by the Food and Drug Administration (FDA) for the treatment of Pompe disease in 2006. Despite beneficial effects, including prolonged survival and ventilator-free survival, ERT provokes an immune response consisting of high anti-rhGAA IgG antibody titers that decreased efficacy in many patients with IOPD. 2 –5
Patients with late-onset Pompe disease (LOPD) on ERT experienced initial improvements in the 6-minute walk test (6MWT) and forced vital capacity (FVC) performance, followed by a plateau in 6MWT and gradual decline in FVC over the following years. 1 Additionally, some patients have experienced residual symptoms and early mortality despite compliance with ERT. 6,7 Even in patients responding well to ERT treatment, residual motor weakness remains. 8 A few treated patients with LOPD have developed severe respiratory muscle weakness and asphixiation. 1
Many experiments have shown gene therapy to be an efficacious alternative to ERT, preventing antibody formation, inducing immune tolerance to GAA, and achieving biochemical correction in murine GAA-KO mouse models following adeno-associated virus (AAV) vector administration. 9,10 However, antibody responses to therapeutic proteins, including GAA in Pompe disease, have impaired the efficacy of gene therapy or ERT in lysosomal storage disorders. 2,9,11 –13
AAV2/8-LSPhGAA expresses GAA only in the liver, establishing immune tolerance to human GAA and increasing the efficacy of ERT in combination with gene therapy, or of gene therapy as a standalone. 14,15 Furthermore, the efficacy of a low dose of vector-mediated gene therapy is comparable to that of long-term ERT, making gene therapy a cost-effective, sustainable solution for lysosomal storage disorders like Pompe disease. 16 –19
Preclinical studies of gene therapy with AAV vectors demonstrated that the minimum effective dose (MED) of AAV2/8-LSPhGAA was ∼2 × 10¹¹ vector genomes (vg) per kg of body weight. 20 The present study sought to correlate the proportion of hepatocytes transduced by AAV2/8-LSPeGFP to the MED of AAV2/8-LSPhGAA to achieve biochemical correction, evaluating low vector dosages.
Methods
Experimental design
The AAV vector was prepared as described and administered intravenously to GAA-KO mice with a C57BL/6 background. 21,22 Mice were treated with tail vein injection of AAV2/8-LSPeGFP or AAV2/8-LSPhGAA in varied doses on day 1. GAA-KO mice were injected with PBS as a negative control for vector administration. AAV2/8-LSPeGFP treatment groups consisted of 4–7 mice per group: PBS (n = 7), 5 × 10⁹ (n = 4), 1 × 10¹⁰ (n = 5), 2 × 10¹⁰ (n = 4), 5 × 10¹⁰ (n = 5), 1 × 10¹¹ (n = 4), 2 × 10¹¹ (n = 5), and 8 × 10¹¹ (n = 5).
AAV2/8-LSPhGAA treatment groups consisted of 3–7 mice per group: PBS (n = 7), 5 × 10⁹ (n = 5), 1 × 10¹⁰ (n = 3), 2 × 10¹⁰ (n = 5), 5 × 10¹⁰ (n = 5), 1 × 10¹¹ (n = 5), 2 × 10¹¹ (n = 5), and 8 × 10¹¹ (n = 5). Only male mice were used to obtain clear cross-group comparisons and avoid sex-dependent decreases in efficacy of gene therapy observed in female mice. 22
Age-matched GAA-KO mice were housed in groups of 3 to 5, and mice from different groups were co-housed when possible. All mouse groups were euthanized for tissue analysis at 8 weeks following vector administration. All animal procedures were done in accordance with the Duke University Institutional Animal Care and Use Committee-approved guidelines.
Green fluorescent protein imaging and quantification
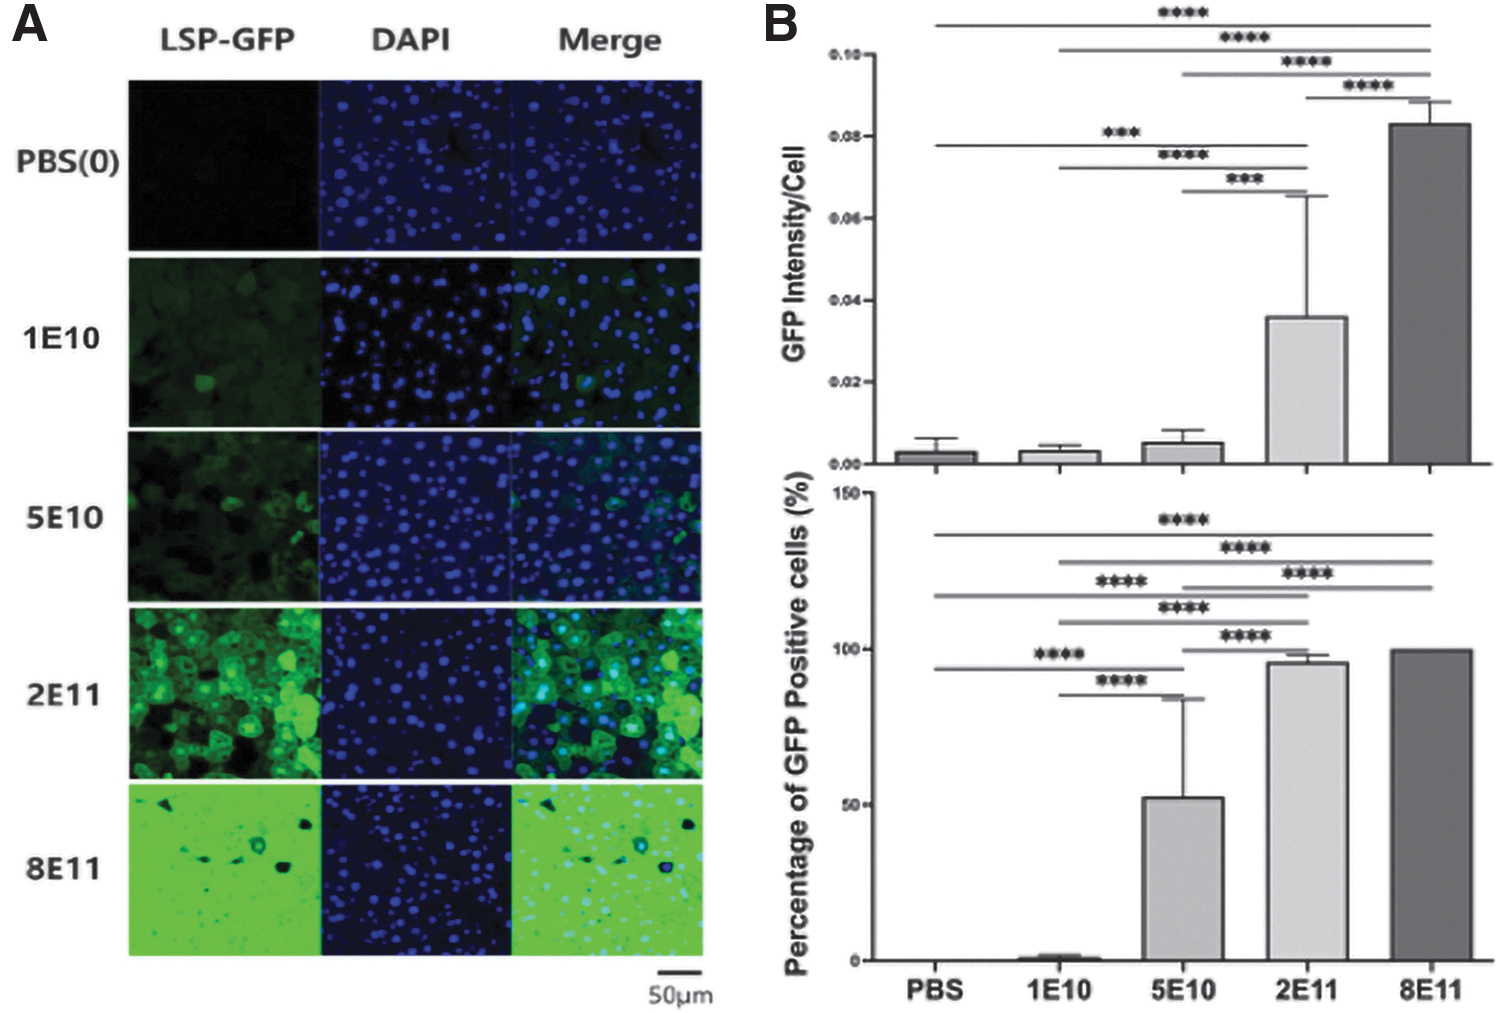
Approximately 100 mg of the left lobe of liver was fixed in 3% glutaraldehyde for 24 h, then incubated with 30% sucrose solution for 48 h, and then flash frozen with optimum cutting temperature compound (OCT). Frozen sections (5 μm thickness) were mounted on glass slides (three per slide, one slide per mouse, four mice per group). OCT was removed by washing with PBS buffer, and 4′,6-diamidino-2-phenylindole (DAPI) solution was applied before mounting the cover glass. Green fluorescent protein (GFP) and DAPI images were obtained by measuring with BZ-X710 (KEYENCE Corp of America, Itasca, IL). The measured image size was 1,920 × 1,440 with the objective lens of 20 × 0.75/1.00 mm.
The exposure time of measurement was determined after watching several images, 1/20 s for GFP and 1/25 s for DAPI, as the intensity of image depends on the exposure time. Each image was divided into 16 sections, and GFP-positive cells and DAPI-positive cells were counted for each section. Four images were analyzed in each group, and the percentage of GFP-positive cells were calculated by dividing by the number of DAPI-positive cells. The calculation of intensity was calculated using the ImageJ program. Intensity of GFP was analyzed by the standard method without any further changes. GFP intensity per cell data was obtained by dividing the intensity measurement by GFP intensity.
Endpoint data collection and analysis
GAA activity and glycogen content were analyzed as described. 22 Rotarod and wire hang testing occurred as described before treatment and 8 weeks following treatment as described. 23 GAA and glycogen content were analyzed through GAA activity assays, glycogen content assays, and total protein assays as described. 15 Antibodies against rhGAA and AAV8 were quantified with ELISA as described, with the adaptation that AAV8 was used to coat the plate for the anti-AAV8 ELISA. 20 Glcα1-6Glcα1-4Glcα1-4Glc (Glc4), termed Hex4 when detected by the method used, 24 was quantified in a single “spot” urine sample. Multiple comparisons were assessed with a one-way analysis of variance ANOVA and Sidak's multiple comparisons test using Prism software (GraphPad, La Jolla, CA), using an alpha of 0.05.
RESULTS
GAA-KO mice administered either AAV2/8-LSPeGFP, 25 AAV2/8-LSPhGAA, 15 or PBS at 2–3 months of age. Rotarod and wire hang measures were performed at baseline and 8 weeks postadministration of vector. The liver was analyzed for various dosages of AAV2/8-LSPeGFP, with 8 × 10¹¹ vg/kg producing the highest transduction (Fig. 1A). Approximately 50% transduction in liver was observed for the 5 × 10¹⁰ vg/kg dose, and 100% transduction was observed for the 10-fold higher dose of 2 × 10¹¹ vg/kg (Fig. 1B). Intensity of GFP was highest for 8 × 10¹¹ vg/kg followed by 2 × 10¹¹ vg/kg. Following AAV2/8-LSPhGAA administration, the GAA activity in the liver was significantly increased by either the 2 × 10¹¹ or 8 × 10¹¹ vg/kg doses (p < 0.0001), and the 8 × 10¹¹ vg/kg dose produced significantly higher GAA activity (p < 0.05) when compared with all other groups (Fig. 2A).
GFP detection following AAV2/8-LSPhGAA administration at varied dosages. Liver was analyzed for various dosages of AAV2/8-LSPhGAA

Liver biochemical correction, and plasma GAA. Liver GAA and glycogen content
Similarly, liver glycogen was significantly decreased for the 8 × 10¹¹ vg/kg dose in comparison with all other groups other than the 2 × 10¹¹ vg/kg dose (Fig. 2A). Plasma GAA activity was significantly increased for the 8 × 10¹¹ vg/kg group when compared with several lower doses (p < 0.01; Fig. 2B), whereas plasma GAA quantified in acarbose solution to suppress neutral glucosidase activity demonstrated significantly increased activity for the 8 × 10¹¹ vg/kg group, in comparison with all other groups (Fig. 2B).
Heart and select muscle tissues were examined to determine biochemical correction following AAV2/8-LSPeGFP administration. GAA activity in the heart was significantly increased by the 8 × 10¹¹ vg/kg group, in comparison with all groups other than WT control (Fig. 3A; p < 0.001). Heart glycogen content was significantly decreased by 8 × 10¹¹ vg/kg, lowering to levels equivalent to WT control mice (Fig. 3A; p < 0.001). While diaphragm GAA was only significantly increased by 8 × 10¹¹ vg/kg as compared with all other groups (p < 0.01; Fig. 3B), the 1 × 10¹⁰ and 2 × 10¹¹ vg/kg doses significantly decreased the diaphragm's glycogen content, in comparison to the placebo group (p < 0.01; Fig. 3B).

Heart and muscle biochemical correction following AAV2/8-LSPhGAA administration. Heart GAA and glycogen content
While diaphragm glycogen content was significantly decreased for the 1 × 10¹⁰ vg/kg dose, this correlated with transduction of only 1% of hepatocytes (Fig. 1) and represents an outlier. GAA activity was significantly increased (p < 0.05; Fig. 3C) and glycogen content was significantly decreased (p < 0.001; Fig. 3C) in the quadriceps for the 8 × 10¹¹ vg/kg dose only, consistent with the resistance of skeletal muscle to biochemical correction in Pompe disease. 18
Antibody responses to GAA have correlated with decreased benefits from gene therapy in Pompe disease. 14,20,26 –28 Immune tolerance to human recombinant GAA and AAV8 was examined using ELISA. Several mice in the lowest dose groups, 5 × 10⁹ and 1 × 10¹⁰ vg/kg, failed to achieve immune tolerance to GAA; however, there was no significant difference in anti-GAA observed in the groups holistically (Fig. 4A). Only the highest dose, 8 × 10¹¹ vg/kg, significantly increased anti-AAV8 IgG antibodies (p < 0.05; Fig. 4A).
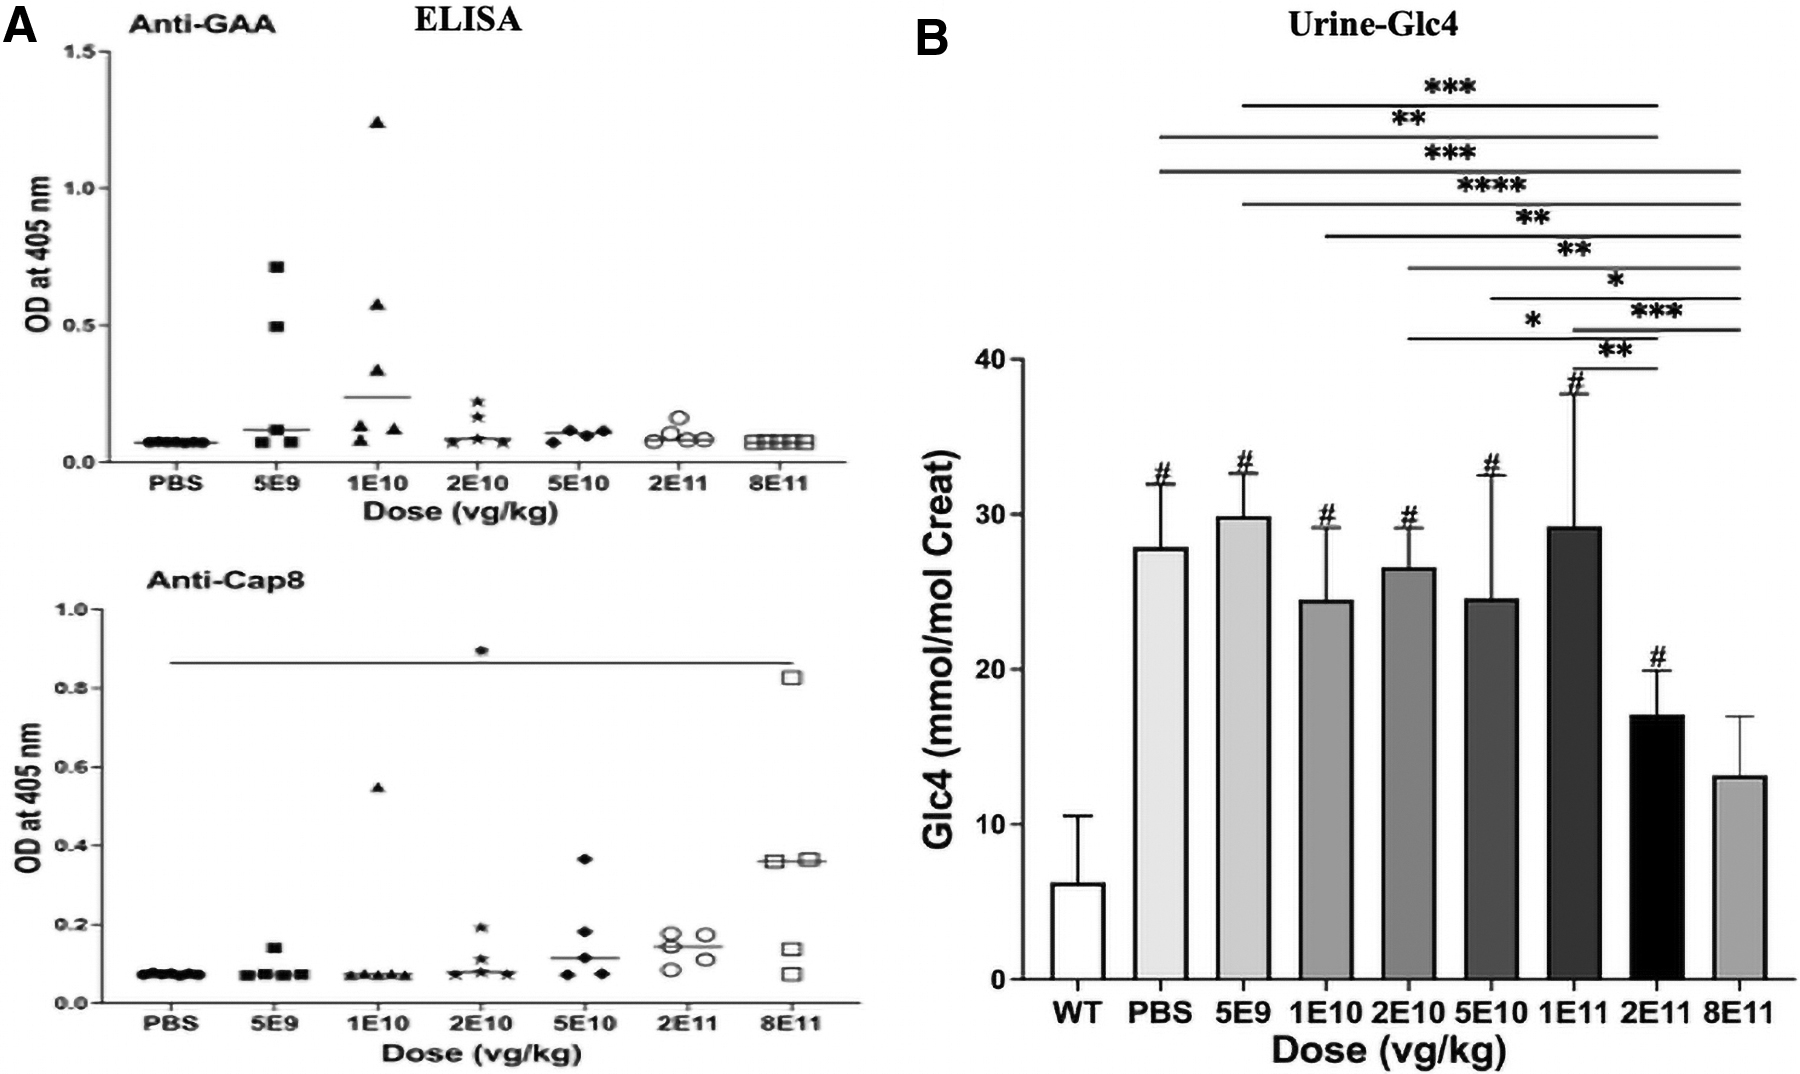
Antibody formation and urine biomarkers following AAV2/8-LSPhGAA administration. Anti-GAA IgG and anti-AAV8 IgG were quantified by ELISA
Glc4 biomarkers were quantified from urine samples, and the 2 × 10¹¹ vg/kg group had significantly decreased urinary Glc4, in comparison with the placebo and several lower dosage groups (Fig. 4B; p < 0.01); moreover, the 8 × 10¹¹ vg/kg group demonstrated significantly decreased presence of Glc4 in comparison with all groups other than the 2 × 10¹¹ vg/kg and WT control groups (Fig. 4B).
Vector DNA was quantified in the liver with quantitative polymerase chain reaction, revealing that 8 × 10¹¹ vg/kg increased vector biodistribution significantly in comparison with other groups (Fig. 5A, B).
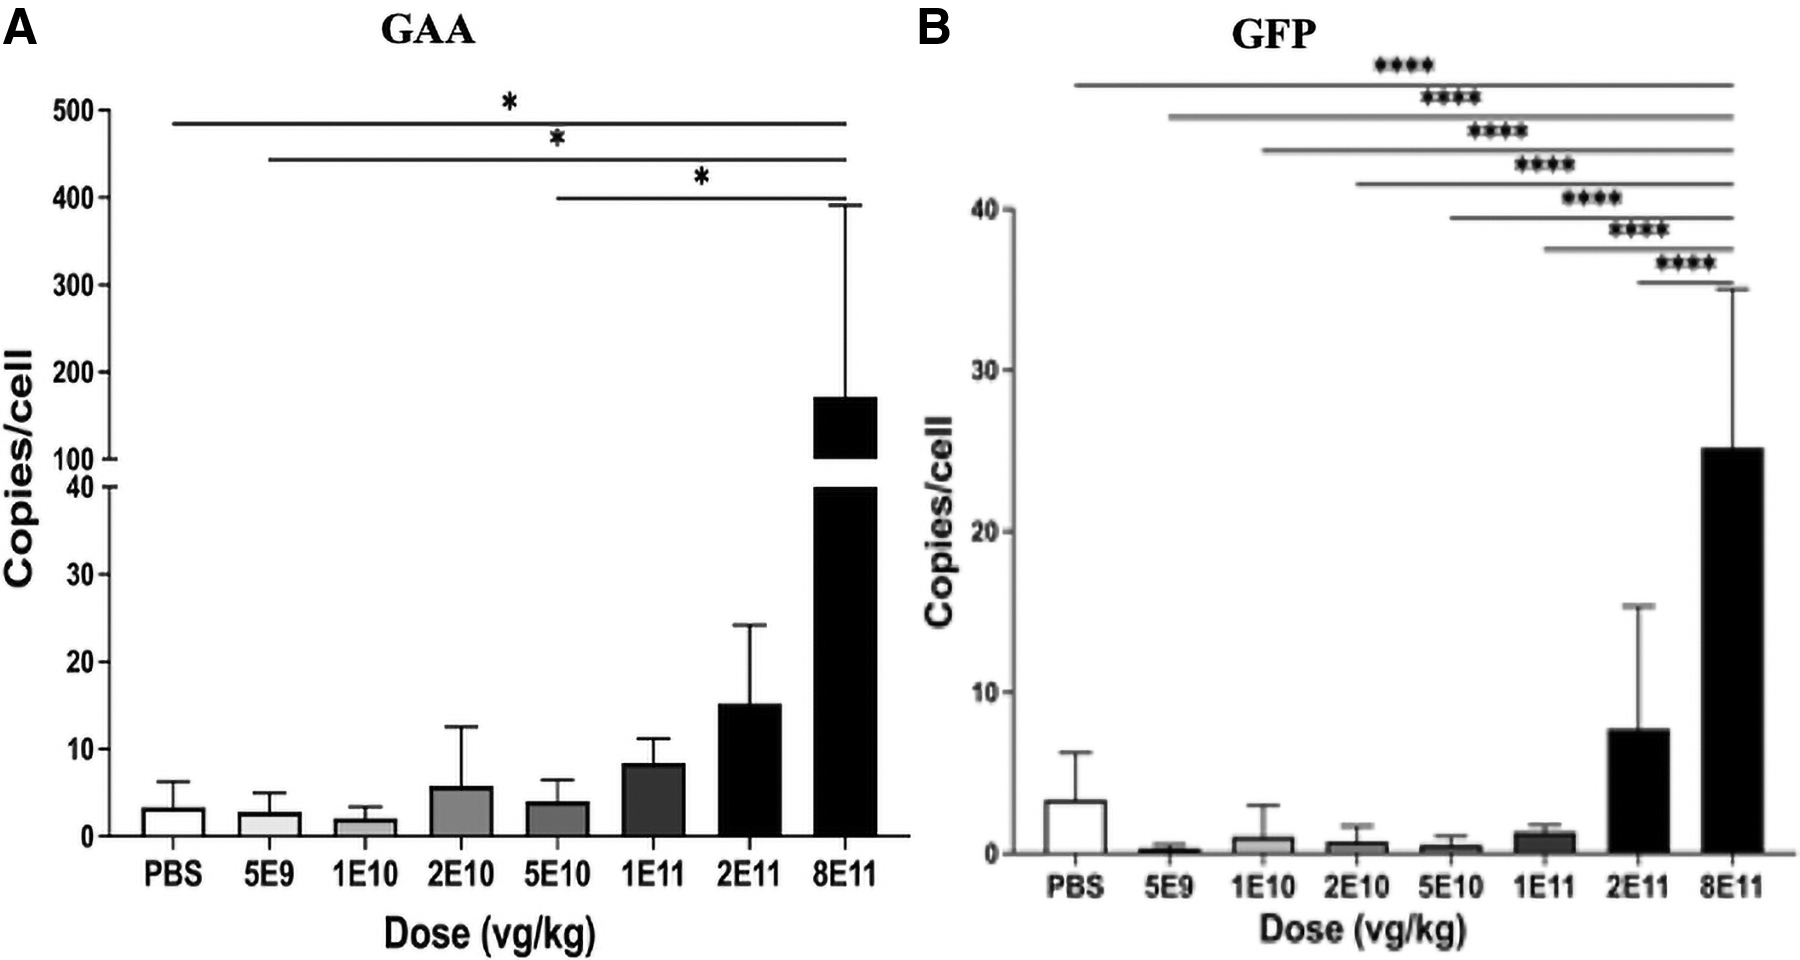
Vector genome biodistribution. GAA-KO mice were evaluated using qPCR for GAA
Multiple muscle function and weight endpoints were assessed as indicators of treatment efficacy (Supplementary Fig. S1). Rotarod latency showed no significant improvement (Supplementary Fig. S1A). Duration of Rotarod performance at 8 weeks postadministration was significantly improved by 8 × 10¹¹ vg/kg when compared with some lower doses, but not in comparison with placebo or WT control (p < 0.05; Supplementary Fig. S1B), which was attributed to high variability in both control groups. Wire hang duration at 8 weeks postinjection and wire hang latency showed no significant improvement (Supplementary Fig. S1C, D). No significant differences in body weight at 8 weeks postinjection were observed (Supplementary Fig. S1E).
The 1 × 10¹¹ vg/kg (p < 0.01) dosage group displayed significantly increased body weight compared with placebo, and no difference was observed between the 8 × 10¹¹ vg/kg and WT control (Supplementary Fig. S1F). Left ventricle weight was elevated in all groups other than the 8 × 10¹¹ vg/kg group, in comparison with WT control, indicating an improvement in cardiac hypertrophy (Supplementary Fig. S1G). Similarly, all groups other than the 8 × 10¹¹ vg/kg groups had decreased gastrocnemius weight in comparison with WT control (Supplementary Fig. S1H).
DISCUSSION
The present study objective was to determine the MED to lower glycogen content, and to correlate that with the degree of transduction in the liver. The outcome confirmed that efficacy as determined by biochemical correction, demonstrated by improvements in the diaphragm, liver, and urine Glc4, correlated with essentially complete transduction in the liver.
The MED was determined to be 2 × 10¹¹ vg/kg, which variably transduced all hepatocytes, which correlated with significantly increased liver GAA activity and significantly decreased glycogen content. The Glc4 biomarker was evaluated as a noninvasive means to gauge the correction of glycogen accumulation, 29 and it was reduced by the 2 × 10¹¹ vg/kg dose. The Glc4 biomarker has correlated with lower glycogen content in muscle tissues, including the heart and quadriceps, 29 similarly to the outcome of this study for the 8 × 10¹¹ vg/kg dose group.
However, Glc4 was significantly lower for the 2 × 10¹¹ vg/kg dose group in comparison with PBS treated controls, even in the absence of any change in the glycogen content of heart or quadriceps, indicating that the biomarker was sensitive to decreased glycogen accumulations in the liver and diaphragm. Glc4 was lower for the 8 × 10¹¹ vg/kg dose, in comparison with the 2 × 10¹¹ vg/kg dose, which reflects a dose–response, in which a higher vector dose produces more beneficial effects.
Additionally, ELISA analyses showed that all groups receiving the 2 × 10¹¹ vg/kg dose and below did not provoke a significant increase in anti-AAV8 or anti-rhGAA IgG antibodies. Additionally, serum GAA quantified with acarbose detected an increased mean GAA from the 2 × 10¹¹ vg/kg dose. This supports that the MED of AAV2/8-LSPhGAA is 2 × 10¹¹ vg/kg. These data denote near-uniform transduction of hepatocytes and partial efficacy at the 2 × 10¹¹ vg/kg dose, and much greater efficacy at the 8 × 10¹¹ vg/kg dose.
While this confirmation of the MED was the goal of this experiment, we also observed a highly effective dose at 8 × 10¹¹ vg/kg, which significantly increased GAA activity and lowered glycogen content in the liver, heart, diaphragm, and quadriceps. The 8 × 10¹¹ vg/kg dose also increased muscle mass and decreased cardiac hypertrophy. This higher dose also significantly decreased Glc4 biomarkers in urine, which correlated with more complete biochemical correction of the heart and skeletal muscles.
The data from this experiment indicated that AAV2/8-LSPeGFP appears to have produced near-uniform transduction of hepatocytes, when 2 × 10¹¹ vg/kg were administered. Furthermore, the equivalent dose of AAV2/8-LSPhGAA achieved biochemical correction. Adaptations, such as modifying GAA to enhance secretion of GAA, may improve the benefits of lower dosages of vector from the liver. 30 However, taken together, these data support the conclusion that uniform transduction of hepatocytes in the liver is required to achieve biochemical correction from AAV2/8-LSPhGAA.
Footnotes
ACKNOWLEDGMENTS
The authors would like to thank Dr. Elizabeth Brooks (Duke University) for her technical support during this project.
AUTHOR DISCLOSURE
The authors (S.H. and D.D.K.) and Duke University might benefit financially, if the experimental treatments discussed in this study prove effective and are successfully commercialized in the context of gene therapy. D.D.K. has served as a consultant for Sangamo Therapeutics, Genzyme Sanofi, Amicus, Takeda, Askbio, and Vertex. D.D.K. has received grant support from Sangamo Therapeutics, Pharming, Lysoway, and Viking Therapeutics.
FUNDING INFORMATION
This study was supported by a grant from AskBio.
SUPPLEMENTARY MATERIAL
Supplementary Figure S1
References
Supplementary Material
Please find the following supplemental material available below.
For Open Access articles published under a Creative Commons License, all supplemental material carries the same license as the article it is associated with.
For non-Open Access articles published, all supplemental material carries a non-exclusive license, and permission requests for re-use of supplemental material or any part of supplemental material shall be sent directly to the copyright owner as specified in the copyright notice associated with the article.