
Abstract
The occurrence of tissue scarring and architecture-modifying signaling led to a tumorigenic microenvironment. Targeting specifically the biological mediators responsible for the physiological and morphological changes accommodating hepatocellular carcinoma (HCC) growth may be the key for identifying a future HCC cure. Morphological and physiological features of cultured HepG2 cells in both stimulated recombinant human vascular endothelial growth factor (VEGF165) and unstimulated (control) conditions were assessed. Quantitative reverse transcription (RT)-PCR measured endogenous VEGF expression levels. The assessment of proangiogenic biological mediator (micro RNA [miR]-296, miR-31, and miR-17) profiles was achieved by polarization-inducing VEGF165 stimulation followed by quantitative RT-PCR. In vitro conditions reproduced successfully the physiological environment leading to the occurrence of HCC, including the successful HepG2 polarization following VEGF stimulation. While endogenous VEGF production only occurs if complete polarization has been reached, the quantified biological mediator profiles determined here pointed at either possible early stages of depolarization or at the lack of tumorigenic potential of the HepG2 cells. All tested miRs displayed upregulated profiles, although miR-296 was less amplified (3.78-fold compared with control) than miR-31 or miR-17 (6.5- and 6.6-fold, respectively). The findings surrounding miR-17 reproduce similar data reported in the literature; the unexpected high miR-31 expression was intriguing. Given HepG2 cells' minimal tumorigenic potential, the unexpected multifold upregulation of miR-31 may be a cause or a consequence of HepG2 cells' low tumorigenic potential. The exploration of miR-31 therapeutic potential may be a future rewarding endeavor.
BACKGROUND
The formation of new blood vessels is an essential component of cancer growth and development. The consistent association between metabolic syndrome and the increased risk for cardiovascular disease points to growth factors' central role, particularly the vascular endothelial growth factor (VEGF). A fundamental part of its regulation is dependent on the escalated expression and exposure of growth factor receptors on the surface of existing tumor endothelial cells. 1
MicroRNAs (miRs) are novel regulators of gene expression. They are very short noncoding RNA molecules capable of blocking specific messenger RNA (mRNA) translation by interfering with their stability. 2 At times, miRNA may also impact modification of histones and even methylation of DNA promoter regions. 3
Specific miRNAs are associated with cancer prognosis 4 and tumor histology, 5 while others work as tumor antagonists promoting apoptosis. 6 Chronic lymphocytic leukemia and B cell lymphoma were the first disease conditions linked to the biological activity of miRNAs. 7 Many subsequent studies reported aberrantly expressed miRNA in solid tumors, including liver cancer. Recent evidence suggests that miRNA are critical regulators of hepatocellular carcinoma (HCC) tumor-initiating cell activation by targeting several tumors' suppressive signaling pathways. 8 –10 As a class, miRNA holds huge promise as diagnostic and prognostic markers, and potential therapeutics also play a role in the occurrence of HCC drug resistance. 11
MATERIALS AND METHODS
Cell culture
HepG2 cells were maintained in Dulbecco's modified Eagle's medium (DMEM) supplemented with 10% fetal bovine serum and 1% nonessential amino acids. Standard culturing conditions were applied for all the experiments involving cell lines (37°C temperature, 5% CO2). HepG2 cells were seeded at 6 × 10⁴ cells/cm2 or a six-well plate, each well 34.8 mm in diameter (Fisher Scientific, UK). A six-well plate is a standard culture vessel used in the laboratory. Cell suspension, 1 mL, was added to each well, and then, the volume completed to 2 mL by DMEM. Finally, the plate was incubated at 37°C in 5% CO2/95% air. Recombinant human VEGF165 (Fisher Scientific) was used for stimulation of HepG2 cells for 24 h: 1 μL of vascular endothelial growth factor (VEGF) 25 ng/μL was added to three wells of the plate.
HepG2 polarity measurement using green fluorescent protein
HepG2 cells expressed green fluorescence to examine the polarity; HepG2 grew on a six-well plate for 120 h, and then, three of the six-well plates were treated with 25 ng/μL of recombinant VEGF. Finally, the plate was incubated for an additional 24 h. The polarity index was assessed by calculating the number of green fluorescence positive for five fields of view on three replication wells for untreated and treated cells with VEGF using the NikonEclipseTE2000-S fluorescence microscope.
RNA extraction
The following reagents were used for RNA purification: TRIsure™ reagent (catalog no. BIO-38033; Bioline, Germany), chloroform (catalog no. C/4920/17; Fisher Scientific), isopropyl alcohol (catalog no. P/7490/21; Fisher Scientific), 75% ethanol, and diethyl pyrocarbonate (DEPC) water. The HepG2 monolayer was lysed directly in the culture dish by adding 1 mL of TRIsure reagent for each 10 cm2 of the monolayer. The lysate was pipetted sequentially to ensure sufficient cell disruption, and then, samples were transferred into the corresponding volume tubes and further incubated at room temperature for 5 min. A total of 200 μL of chloroform was added to the TRIsure lysate and incubated at room temperature. Samples were centrifuged at 12,000g and 4°C for 15 min. 12
RNA precipitation was performed with 500 μL of cold isopropanol in a ratio of 1:2 compared with the original TRIsure volume used. Samples were incubated for 10 min at room temperature and then centrifuged at 12,000g and 4°C for 10 min. After removing the supernatant, the pellet was washed once with 75% ethanol (1:1 ratio with the original TRIsure volume used), then vortexed and recentrifuged at 7,500g, 4°C for 5 min. 13 Air-dried RNA pellet was resuspended in DEPC water by a 10-min incubation at 60°C. Samples were stored at −70°C for subsequent analyses.
Endogenous VEGF reverse transcription and cDNA synthesis
The Tetro cDNA synthesis kit (catalog no. Bio-65043; Bioline, USA) contains the necessary components for cDNA generation. Tetro kit includes the following: MMLV reverse transcriptase, dNTPs, and oligo (dT)18 primer mix, as well as DEPC-treated water. A total of 5.4 μg of RNA from each of the six purified RNA tubes (three controls and three VEGF stimulated) was used as a PCR template in each amplification tube. The amplification mix contained 10 nM oligo (dT)18 primer premix (1 μL of 50 μM) and 50 μM of dNTPs (1 μL of 10 mM). The reverse transcription (RT) vials were incubated at 70°C for 5 min to unfold the RNA and denature the oligo primers, and then placed immediately on ice for 1 min.
The reaction premix containing 1 μL of reverse transcriptase (200 U), 4 μL of annealing 5 × RT buffer, 1 μL of RNase inhibitor (10 U), and 7 μL of RNase/DNase-free water was added to all tubes and was then gently mixed by pipetting. The six tubes underwent incubation at 25°C to allow the extension of the primers for 10 min, followed by incubation at 45°C RT for 30 min. The reaction was terminated by incubating all vials at 85°C for 5 min to inactivate the reverse transcriptase enzyme, and then, vials were immediately placed on ice.
Endogenous VEGF quantification by real-time PCR
The following materials were used for the quantitative real-time PCR amplification: SensiMix SYBR Green (catalog number QT615-05, Bioline, United States), VEGF-specific exon four forward primer (5′-GAGATGAGCTTCCTACAGCAC-3′), VEGF-specific exon eight reverse primer (5′-CACCGCCTCGGCTTGTCACAT-3′), β-Actin amplification control, β-Actin forward primer 5′ AGCCATGTACGTAGCCATCC-3′, and β-Actin reverse primer 5′ CTCTCAGCTGTGGTGGTGAA-3′.
Each of the six reverse-transcribed cDNA samples (three controls and three VEGF stimulated) was amplified using the specific and control primer pairs to assess whether VEGF stimulation triggered a proangiogenic effect in the stimulated HepG2 cells. The component and the volume of the reaction are shown in Table 1. The real-time amplification was monitored and analyzed using Qiagen Rotor-Gene Q Software 2.3.1.49 following thermal cycling (95°C denaturation, 60°C annealing, and 72°C extension). The amplification products were run on 3% agarose gels (40 mL of Tris-base EDTA buffer and 0.4 g of agarose). Ethidium bromide (2 μL) was used for amplicon visualization under UV. This reaction resulted in amplicons at ∼220 bp of VEGF exon 8 and β-Actin.
Real-time amplification setup
NTC, non-templet control; VEGF, vascular endothelial growth factor; VEGF-SP, VEGF-specific exon four and VEGF-specific exon eight.
miRNA reverse transcription reactions
The miRNAs isolated using the TRIsure reagent were reverse transcribed to cDNAs using gene-specific primers. An RT master mix from the TaqMan® miRs RT Kit along with the gene-specific primers: has-miR-17, RNU6B, has-miR-31, and has-miR-296 (catalog number BIO-65053, BIO-65054) was used to prepare cDNAs from six RNA isolates (three VEGF-stimulated HepG2 cell wells and three unstimulated HepG2 cell wells). Therefore, the total number of RT reactions was 24. RT was performed in a final volume of 20 μL.
miRNA real-time PCR
miRNA real-time PCR was performed using a standard TaqMan PCR kit protocol. Sterile 1.5 mL microcentrifuge tubes were used to prepare the qPCR master mix, which included 2X SensiFAST probe (No-Rox) mix (Bioline, catalog number BIO-86005), and the corresponding TaqMan primers: has-miR-17, RNU6B, has-miR-31, and has-miR-296. 14 The volume proportions in the amplification mix (2X SensiFAST probe, TaqMan primer 400 nM, cDNA template, and nuclease-free water) are 10, 1, 2, and 7 μL, respectively, and a final volume of 20 μL. The tubes were capped and mixed by inverting several times, followed by brief centrifugation. The total reaction tubes, including no-template control, were 50 microtubes.
Duplicates of each reaction were used for each gene-specific primer used for each of the three VEGF-stimulated cell wells (labeled as 4, 5, and 6) and three unstimulated control cell wells (labeled as 1, 2, and 3). The described amplification experiments included two miRNA amplification control assays: U6 control, a housekeeping gene ribonucleoprotein (RNU6B) present at steady constant levels regardless of stimulation, and NTC control, a negative control used to evaluate the background signal. The steps for expression fold change of each miRNA are shown in Table 2.
Steps for calculation fold change 23
Statistical analysis
The results are expressed as mean ± standard deviation. Student t-test was performed to analyze present data, and a p < 0.05 was considered statistically significant.
RESULTS
This work showed the role of VEGF and the characteristics of polarized hepatocytes in liver cancer. HepG2 cells developed polarity features over time, which resulted in the formation of bile canaliculi (BC). BC formation is a measure of cell polarity in hepatoma HepG2 cells. The advantage of this technique is that it provides a venue for measuring the 25 ng/μL VEGF impact by determining the polarity index of the HepG2 cells. 15
The cells treated with VEGF had a closer circular appearance denoting a polarized phenotype (Fig. 1 panel B). In contrast, untreated cells' appearance was more spread under the fluorescent microscope (Fig. 1 panel A). 16 The results indicate the role of VEGF in the occurrence of polarization of the HepG2 cells. The incubation of the cells for 5 days before VEGF stimulation was essential for the occurrence of the morphological differences compared with the shorter culturing time before VEGF stimulation because, over time, the number of BC has increased. 15
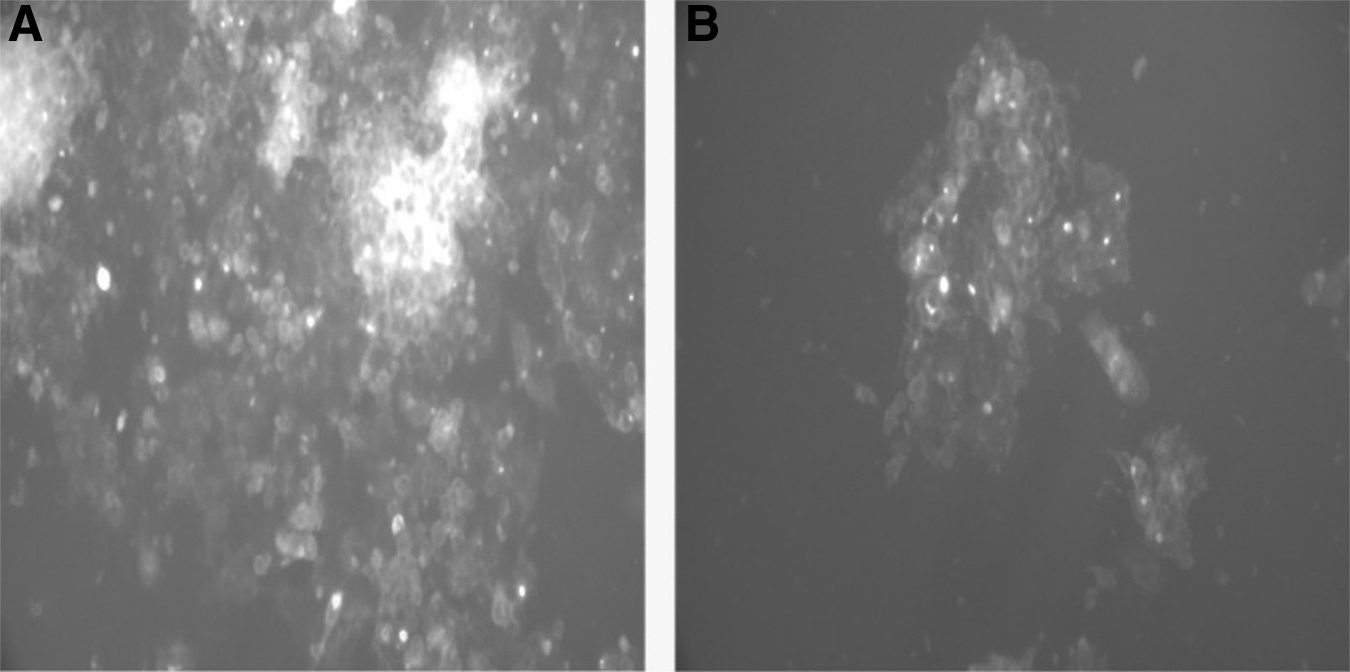
GFP fluorescence microscopy of polarized versus unpolarized HEPG2 cells.
There is a significant difference in the average cell number between the treated and untreated groups (p < 0.001), with higher means observed with VEGF-treated cells (Fig. 2). The results showed that exogenous VEGF 25 ng/μL had enhanced the ability of HepG2 cells to polarize, and also changed the physiology and morphology of HepG2 cells.

The differences between treated and untreated cells with 25 ng/μL VEGF. Data express as mean ± SD, ***p < 0.001 versus treated cells. SD, standard deviation. Color images are available online.
Effect of VEGF stimulation on endogenous VEGF production
The cells were treated with recombinant VEGF and compared with untreated control to estimate the magnitude of VEGF impact on HepG2 cells. The objective of the experiment was to identify the difference in endogenous VEGF expression between the stimulated and unstimulated cells. Agarose gel electrophoresis was used for the separation and visualization of the amplified PCR products. Resulted amplicons measured ∼220 bp for VEGF A (proangiogenic) and β-Actin, while VEGF B (antiangiogenic) was at ∼100 bp. Figure 3 shows agarose electrophoresis gels of cDNA 1-6, and fluorescence densitometry of each respective amplicon showed a proangiogenic effect of VEGF A and antiangiogenic effect of VEGF B after exogenous VEGF stimulation.

Agarose gel electrophoresis showing VEGF165 for cDNA1, cDNA2, cDNA3 cDNA4, cDNA5, and cDNA6 expression denoting an angiogenic effect of VEGF A and B amplicons at ∼220 and at ∼100 bp, β-actin amplicon at ∼200 bp.
The fluorescence densitometry levels of recombinant exogenous VEGF165 (25 ng/μL) showed an angiogenic effect. The changing ratio between endogenous VEGF A and B following recombinant VEGF treatment indicated a physiologic effect on HepG2 cells. Figure 4 shows the comparison between VEGF A (proangiogenic) and VEGF B (antiangiogenic) for treated and untreated cells, which indicated the significant effect of exogenous VEGF.
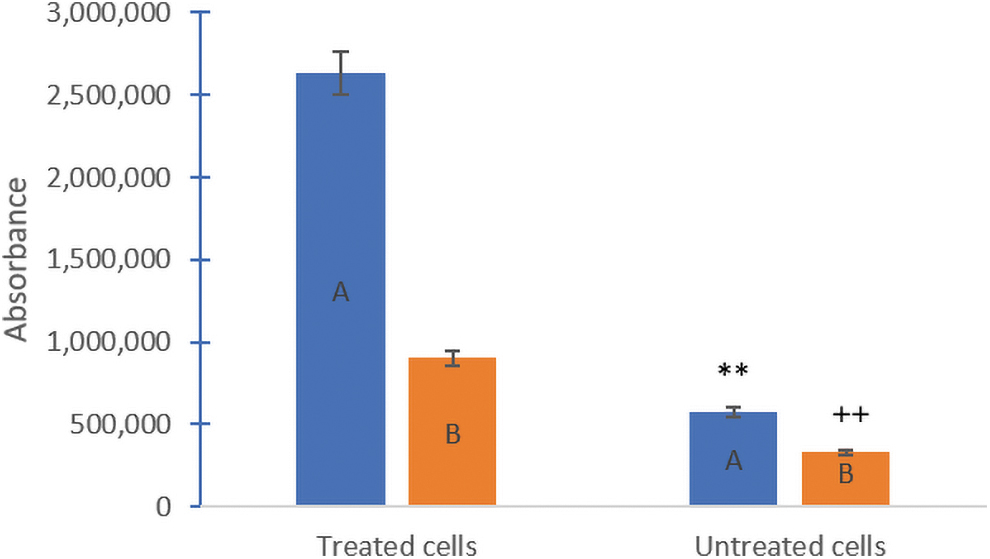
Fluorescence densitometry of endogenous VEGF A (pro-angiogenic) and VEGF B (antiangiogenic) amplicons in VEGF-treated versus untreated cells. Data expressed as mean ± SD, *p < 0.05 versus treated cells with VEGF A, + p < 0.05 versus treated cells with VEGF B. Color images are available online.
The results indicated that VEGF A had increased four times after treatment of HEpG2 cells with 25 ng/μL in comparison with VEGF A in normal conditions. Also, VEGF B increased twice after the treatment than untreated cells (Fig. 2). Exogenous VEGF not only changes the morphology of HepG2 cells, but it also stimulates the production of endogenous VEGF and the proangiogenic effect. HepG2 cells in normal conditions produce more angiogenic isoform (VEGF A) and a small amount of nonangiogenic (VEGF B), as shown in Fig. 4 (untreated cells). Exogenous VEGF (25 ng/μL) stimulates endogenous VEGF pathway of treated cells for 24 h by increasing the proangiogenesis effect (VEGF A) four times than untreated cells, also doubling nonangiogenic (VEGF B) than untreated cells.
Effect of VEGF stimulation on miRNA expression
Quantitative PCR indicates efficient amplification for each assayed gene, including the housekeeping control, a value expected to be similar in between controls provided that the cell count was also similar. The amplification was most effective at a higher T m (60°C) for the U6 RNA as well as for the three miRNAs assayed. The efficiency of all three gene amplifications was similar.
All the assayed miRNAs were identified to be upregulated. miRNA-31 and miRNA-17 were upregulated considerably more than miRNA-296. The miR-296 has increased 3.78-fold compared with untreated control, while miR-17 and miR-31 have increased 6.5-fold and 6.6-fold, respectively. An increase in the endogenous VEGF led to a change in miRNAs compared with nontreated cells. The results are shown below (Fig. 5).

The data indicate a 6.6-fold higher expression of miR-31, upregulation of miR-296 (3.78-fold), and upregulation of miR-17 (6.5-fold) expression following VEGF stimulation in HepG2 cells compared with the unstimulated cells. Color images are available online.
DISCUSSION
The current model of stimulated VEGF165 (VEGF) is a successful method for showing the stimulation of HepG2 cell polarization, thus suggesting that a proangiogenic response is activated; evidence indicating an autocrine regulation of the highly polarized model of human hepatocytes. 17 HepG2 polarization is linked to well-established signaling pathways, the fact that implies a likely promoter-controlled regulation. In proper culturing conditions and specific physiological parameters, HepG2 cells are capable of secreting endogenous VEGF. The results indicate that the polarity and morphology of HepG2 cells changed after adding exogenous VEGF (25 ng/μL) to the cells in addition to the increased endogenous VEGF production from HepG2 cells.
As assayed by polarity measurements using green fluorescent protein (GFP), the morphological and physiological features of cultured HepG2 cells in both stimulated and unstimulated conditions indicate successfully reproducing appropriate in vitro conditions similar to the pathophysiological conditions leading to the occurrence and development of HCC. The measurement of the physiological changes leading to HepG2 cell polarization by fluorescence microscopy, and quantification of the polarity index and HepG2 culture response to VEGF treatment. 15
VEGF levels are controlled mainly by miRNA stabilization and to a lesser extent by the induction of transcription through growth factors or oncogenes. 18 Based on current evidence, the endogenous production of various VEGF isoforms results from multiple alternative splicing processes, suggesting a potential involvement of miRNA in the selective translation of specific isoforms in different microenvironments. In fact, with each of the respective isoforms having such distinct functions, they may also be differentially regulated. Thus, the potential involvement of miRNA in the process of selective translation of specific isoforms in different microenvironments may not be excluded.
The culture morphology data indicate that VEGF treatment stimulates HepG2 cell polarization and activates a proangiogenic response. This is confirmed by quantifying VEGF165 cDNA; however, the tested miR profiles of miR-296, miR-31, and miR17 have been rather intriguing. Unequally upregulated miR expressions favoring miR-17 and miR-31, each upregulated by over sixfold in the VEGF-stimulated compared with the unstimulated HepG2, were observed.
The occurrence of a proangiogenic response is mediated by proangiogenic miR profiles and by modifications of the cellular architecture consistent with cell polarization. Out of the three tested miRs, it is expected to see a limited expression of miR-296 and miR-31 in response to VEGF stimulation. Nonetheless, all miRs were found to be elevated in the discussed experimental culture conditions, with miR-296 displaying a more modest elevation—only 3.78-fold—compared with the others (over sixfold).
miRNA-296 is known to target and directly bind the mRNA of the hepatocyte growth factor-regulated tyrosine kinase substrate (HGS). HGS mRNA cleavage (i.e., decreased available amounts of HGS mRNA ready for translation) has immediate consequences, leading to reduce HGS-mediated degradation of essential growth factor receptor: VEGFR2. Thus, a higher density of VEGF receptors on the endothelial cells is predictive of a diminished or impaired HGS activity. This has been proven by silencing RNA targeting HGS, which decreased growth factor degradation and increased cellular levels. 19
Previous reports indicated that miR-296 is downregulated in HCC. Despite expectations, the data yielded by the present experiments indicate an upregulation of miR-296. This could be potentially due to the less aggressive phenotype of HepG2 cells compared with the HCC lines experimented by Wang et al. and Stern et al.. Nonetheless, its interference with direct regulators of the endogenous VEGF expression cannot be excluded. Since miR-296 is responsible for HCC growth inhibition, suppression of the proliferative ability, and induction of apoptosis, its limited availability confers adverse clinical features and reduced survival rate among the patients diagnosed with HCC. 20
The second analyzed miRNA was miRNA-31. This miR was shown to play a pivotal role in tumorigenesis and tumor development, suppressing cell proliferation and migration in vitro and preventing xenograft tumor growth in vivo. 21 Low expression of miR-31 was associated with poor outcomes in cancer patients with HCC. 22 Kim et al. reported that ectopic miR-31 expression could decrease the metastatic potential of HCC cell lines in mice. Interestingly, knocking down miRNA-31 in the HCC line enabled the HCC cells to acquire stem cell-like features. 23
The present data indicate a 6.6-fold higher expression of miR-31 in HepG2 cells treated with VEGF compared with the unstimulated cells. This elevation may attest to the differences in the tumorigenic and invasive potential between HepG2 and clinically relevant HCC.
According to the ATCC, the HepG2 cell line is not tumorigenic and does not grow in immunosuppressed mice. It is also possible that cryopreservation and multiple passages may have impacted the physiology of the cell line beyond its ability to polarize and secrete endogenous VEGF. This evidence is worth investigating further, given the fact that clinically relevant HCC seems to have lost a regulatory mechanism that HepG2 cells still have (i.e., the ability to express miR-31). Given that the expression of miR-31 is regulated by DNA methylation, further investigation of VEGF treatment effect on DNA methylation is very appealing.
The last investigated miR, miR-17, is a multitarget miR. The miR-17-92 cluster has been overexpressed in several cancer diseases, linked to uncontrolled cell growth. miR-17-5p, in particular, is the most prominent member of this miR cluster and is a regulator of proliferation, autophagy, and apoptosis. Mice deficient in miR-17-5p die in neonatal stages, a fact attesting to the fundamental role of this miRNA. 11 While this oncomir's circulating levels have been reported to be elevated in all cancer diseases, implying that miR-17-5p could be an alarm signal sensitive for tumors in general, in the liver, gastric, and colorectal cancer, miR-17-5p was reported as an exclusive oncogene. 11
The miR-17-92 cluster plays a remarkable role in liver carcinogenesis. Its expression is elevated in HCC, particularly in tissue samples derived from patients with metastasis. Interestingly, while elevated in relapsing cases, miR-17-92 was downregulated following tumor removal surgery, suggesting that the circulating oncomir is tumor derived. 23
The present study's findings raise the question of whether the lower amplitude upregulation of miR-296 is, in fact, a rebound effect beyond a short-term downregulation achieved by VEGF stimulation. While the findings surrounding miR-17 reproduce similar data reported in the literature, the unexpected high miR-31 expression was intriguing. Given HepG2 cells' minimal tumorigenic potential, the unexpected multifold upregulation of miR-31 may be a cause or a consequence of HepG2 cells' low tumorigenic potential. If true, exploring miR-31 therapeutic potential may be a future rewarding endeavor.
Footnotes
AUTHORs' CONTRIBUTIONS
I.N.T.A. conceived the project, performed experiments, and visualized the data. H.A.A. made the data analysis of the study. I.N.T.A. and H.A.A. wrote the article.
AUTHOR DISCLOSURE
No competing financial interests exist.
FUNDING INFORMATION
The authors are grateful to the University of Coventry for providing the funding supports and essential facilities to accomplish this study.