
Abstract
Adeno-associated viruses (AAVs) represent highly attractive gene therapy vectors and potent research tools for the modulation of gene expression in animal models or difficult-to-transfect cell cultures. Engineered variants, comprising chimeric, mutated, or peptide-inserted capsids, have strongly broadened the utility of AAVs by altering cellular tropism, enabling immune evasion, or increasing transduction efficiency. In this work, the performance of 50 of the most used, predominantly published, AAVs was compared on several primary cells, cell lines, and induced pluripotent stem cell-derived models from different organs, including the adipose tissue, liver, lung, brain, and eyes. To identify the most efficient capsids for each cell type, self-complementary AAVs were standardized by digital polymerase chain reaction, arrayed on 96-well plates, and screened using high-content imaging. To enable best use of the data, all results are also provided in a web app. The utility of one selected AAV variant is further exemplified in a liver fibrosis assay based on primary hepatic stellate cells, where it successfully reversed a small interfering RNA (siRNA)-induced phenotype. Most importantly, our comparative analysis revealed that a subselection of only five AAV variants (AAV2.NN, AAV9-SLRSPPS, AAV6.2, AAV6TM, and AAV1P5) enabled efficient transduction of all tested cell types and markedly outperformed other well-established capsids, such as AAV2-7m8. These findings suggest that a core panel comprising these five capsid variants is a universally applicable and sufficient tool to identify potent AAVs for gene expression modulation in cellular systems.
INTRODUCTION
More than 20
In the first decade of capsid engineering efforts, the focus mainly lay on the development of capsid derivatives with increased transduction efficiencies in vitro, resulting in superior AAV vectors in comparison with their respective parental serotypes. 2 –11 In the following years, capsid screening campaigns aiming to engineer AAV variants for the transduction of murine tissue in vivo were conducted with often great success, best exemplified by capsids such as AAV-PHP.B, 12 AAV2-7m8, 13 and AAVMYO. 14 Advanced xenograft models, such as humanized FRG mice containing human hepatocytes, also led to powerful capsids, with AAV-LK0315 being the most prominent example. The aspiration to replace the predominately used wild-type AAVs in clinical gene therapy trials with more efficient, specific, and immune-evading synthetic capsids further propelled the ever-growing efforts in developing such tailor-made vectors for future clinical use.
Nowadays, the vast repertoire of AAV vectors allows targeting of many different tissues and cell types in murine models, and recent developments indicate that a similar wealth of efficient capsids for larger animals is also emerging, with the neuron-targeting
Besides the evident advantages of utilizing AAVs for gene delivery in vivo, AAVs are also very valuable tools for the transduction of cells in vitro. Altering gene expression in, for example, primary cells, cell lines, or more complex three-dimensional cell culture models offers the possibility to study cellular effects in a tightly controlled environment. Perhaps most beneficial is the AAV-mediated delivery of genetic payload into cells notoriously difficult to transfect, such as primary cells. In this context, the initial key question usually is which capsid is best suited for efficient transduction. To tackle this question, a comparison of different wild-type AAVs and one engineered vector variant for their ability to transduce primary cells and cell lines was first published by Ellis et al in 2013. 18 On the 34 screened mammalian cell types, AAV2, AAV3, and AAV6 showed the most pronounced transduction rates among the 10 tested capsids.
In a smaller study by Duong et al, AAV1–9 and the peptide-modified vectors AAV2-7m8 and AAV8BP2 (termed AAV8b in the study) were evaluated on induced pluripotent stem cells (iPSCs), iPSC-derived human cortical neurons, iPSC-derived retinal pigment epithelium (RPE), as well as primary rat cortical neurons. 19 AAV6 and AAV2-7m8 exhibited the strongest eGFP reporter expression. In 2020, the in vitro comparison of AAVs was further expanded to rationally engineered variants. Börner et al systematically evaluated the performance of rationally designed capsids by integrating 27 previously selected peptides into 13 AAV capsids with remarkable effects. 20 Variants such as AAV1P4 and AAV9A2 demonstrated clear improvements over their parental serotypes in most of the >90 analyzed cell types.
Within the same period, the group of Lisowski utilized the latest advances in genome barcoding to screen a panel of 30 vectors comprising wild types, chimeras, and a few peptide-displaying capsids in 6 cell types. 21 From this barcoded AAV library, the retina-targeting AAV2-7m8 once more showed the overall strongest transcriptional activity.
Sparked by the overwhelming successes of synthetic capsids in those studies, the rationale of this work was to unite all major high-performing engineered vectors, the most used wild-type AAVs, and the latest published variants within one comprehensive AAV panel, thereby allowing an unbiased head-to-head comparison on primary cells and cell lines, including hepatic stellate cells (HepSCs), adipocytes, neurons, iPSCs, and many more. To this end, 50 different AAVs harboring a self-complementary CMV-eGFP-SV40p(A) expression cassette were produced and applied to assess functional transduction by measuring GFP expression. Unlike DNA/RNA-based barcoding, this approach cannot identify functionally defective capsids that enter the cell but do not lead to expression. Yet, as our study was focused on the identification of truly functional capsids, we accepted this limitation and decided for the simple GFP expression-based readout.
As an improvement over the four previous studies, all 36 capsid-modified variants and 14 wild types were fully characterized in terms of production efficiency (measured by droplet digital polymerase chain reaction [ddPCR]), capsid protein expression and purity (sodium dodecyl sulfate–polyacrylamide gel electrophoresis [SDS-PAGE]), as well as viral genome integrity (DNA gel electrophoresis) before screening. Moreover, for the unbiased evaluation of vector performance, equimolar amounts of each variant were used for the transduction before assessing the expression of the eGFP reporter by flow cytometry or high-content confocal imaging. Besides confirming the previously described effects of AAV2 and AAV6 as the most efficient wild types as well as the improvement of AAV1P4, AAV1P5, and AAV9A2 over their parental capsids, we identified the variants AAV2.NN, AAV6.2, AAV9-SLRSPPS, AAV1P5, and AAV6TM as the overall most efficient capsids for in vitro use, thereby also markedly outperforming powerful competitors, including AAV2-7m8.
Conversely, the data further provide insights into cell types that are particularly prone to transduction by certain variants, including capsids with generally low in vitro efficiency, for example, LX2 cells, which were the only cells strongly transduced by AAV12, and HepG2 cells that allowed robust transduction with AAV3b. Such data might help to identify appropriate cellular systems for capsid development and/or receptor identification campaigns in the future. Therefore, our data alleviate the cumbersome search for efficient capsid variants and foster the use of AAVs to investigate target gene biology in relevant cell culture systems. To enable best use of our findings, all transduction data are also provided in a web app (see exemplary output in Supplementary Fig. S1), which can be accessed through
METHODS
AAV production
All 50 AAV batches were produced as described in detail in Strobel et al. 22 Briefly, frozen aliquots of HEK293H cells were thawed and 6 × 10⁷ cells/CELLdisc (Greiner Bio-One) were seeded 3 days before transfection. Adenoviral helper (AAV helper-free system; Agilent), respective rep/cap plasmids, and a plasmid comprising an AAV2-ITR-flanked, self-complementary CMV-eGFP-SV40p(A) expression cassette (see Supplementary Methods in the Supplementary Data for construct sequence) were delivered by calcium phosphate triple transfection. Transfection media of one CELLdisc were changed after 3–4 h and replaced with fresh Dulbecco's modified Eagle's medium (DMEM). After 3 days, cells were detached by the addition of EDTA and were collected by centrifugation. High-salt lysis buffer and three freeze/thaw cycles were used to release the virus particles from the cells. Genomic DNA and remaining plasmids were digested by the addition of salt active nuclease (Serva) before PEG-precipitating proteins, including AAVs, for 3 h.
Following overnight resuspension of the PEG pellet, AAVs were purified over an iodixanol gradient to remove contaminating proteins and empty capsids. The virus-containing iodixanol fraction was concentrated and buffer exchanged using Amicon Ultra-15 filtration tubes (Merck). The concentrate was sterile filtrated, aliquoted, and stored at −80°C for later use.
AAV titration by ddPCR
Viral genomes were isolated with the ViralXpress DNA/RNA Extraction Reagent (Merck) and 5 μL was subsequently serially diluted in nuclease-free H2O. 9.9 μL of the dilutions 10−4–10−11 was transferred to a 96-well plate. Master mix was prepared with 11 μL of 2 × ddPCR Supermix (No dUTP) from Bio-Rad Laboratories and 1.1 μL of 20 × Primer-Probe mix targeting the CMV promoter (forward primer sequence: CCAAGTACGCCCCCTATTGAC, reverse primer sequence: CTGCCAAGTAGGAAAGTCCCATAAG, probe: CCGCCTGGCATTATG). 12.1 μL of master mix was added to each sample dilution before the 96-well plate was sealed, vortexed, and briefly centrifuged. Center wells of DG8 cartridge (Bio-Rad Laboratories) were filled with 20 μL of sample mix, and 70 μL of droplet generation oil was added to the lower wells of the cartridge. The DG8 cartridge was closed with a rubber band and placed into the QX200 Droplet Generator (Bio-Rad Laboratories).
Upon completion, 44 μL from the upper wells of the cartridge was transferred to a ddPCR 96-well plate. The plate was sealed with a pierceable heat seal foil (Bio-Rad Laboratories) by placing it into the PX1 Plate Sealer (Bio-Rad Laboratories). Afterward, viral genomes were amplified by running a PCR with the following cycling conditions: 95°C for 10 min followed by 40 cycles of 95°C for 30 s and 60°C for 1 min as well as a final step at 98°C for 10 min. Amplicon-containing droplets were measured using a QX200 Droplet Reader (Bio-Rad Laboratories).
Quality control of viral batches
To assess the protein purity of the viral batches, a denaturing SDS-PAGE was performed. Titers determined by ddPCR were used to prepare dilutions of each AAV variant comprising a total amount of 4 × 10⁹ vg in 20 μL. Five microliters of 5 × Pierce™ Lane Marker Reducing Sample Buffer (Thermo Scientific) was added to the 20 μL and samples were heat-denatured at 95°C for 5 min before being loaded on a 4–15% Mini-PROTEAN® TGX Stain-Free™ Protein Gel (Bio-Rad Laboratories). The gel was run at constant 200 V for 30 min and subsequently submerged in 35 mL of Oriole Fluorescent Gel Stain (Bio-Rad Laboratories). Staining was carried out under mild agitation for 90 min at room temperature, then transferred to 35 mL of H2O, and finally detected by ultraviolet (UV) light.
For visualization of viral genomes, the ViralXpress DNA extracts previously quantified by ddPCR were loaded at a total amount of 1 × 10¹⁰ vg in 20 μL of H2O on a E-Gel™ General Purpose Agarose Gel, 1.2% (Thermo Scientific). 2.05 μL of High DNA Mass Ladder (Thermo Scientific), corresponding to 1 × 10¹⁰ copies, was used as a control. Running conditions were fixed to 120 V for 30 min. Afterward, AAV genome bands were visualized by UV light.
Cell culture
Due to the broad repertoire of cells used in this study, culture conditions in this section are limited to the cells shown in Figs. 1 –4, while the details for all other cell cultures are available in the Supplementary Data. The human Müller cell line Moorfields/Institute of Ophthalmology-Müller 1 (MIO-M1) 23 was obtained from the UCL Institute of Ophthalmology (London, United Kingdom). MIO-M1 cells were cultured in DMEM high-glucose with GlutaMAX (No. 61965-026; Thermo Fisher) +10% fetal bovine serum (FBS) and seeded at a density of 10,000 cells/96-well 24 h before transduction. Cells were imaged 2 days after transduction. Primary HepSCs were obtained from ZenBio (No. HP-F-S, Lot HSC061218) and cultured in stellate cell medium basal SteCM-b (No. 5301-b; ScienCell/Innoprot) +1 × SteCGS (No. 5352; ScienCell/Innoprot) +2% FBS + GA-1000 in collagen-I-coated flasks.

AAV panel: Production, quality control, and screening procedure.
Transduction efficiency on hepatic stellate, differentiated DFAT cells, and HepG2 cells.
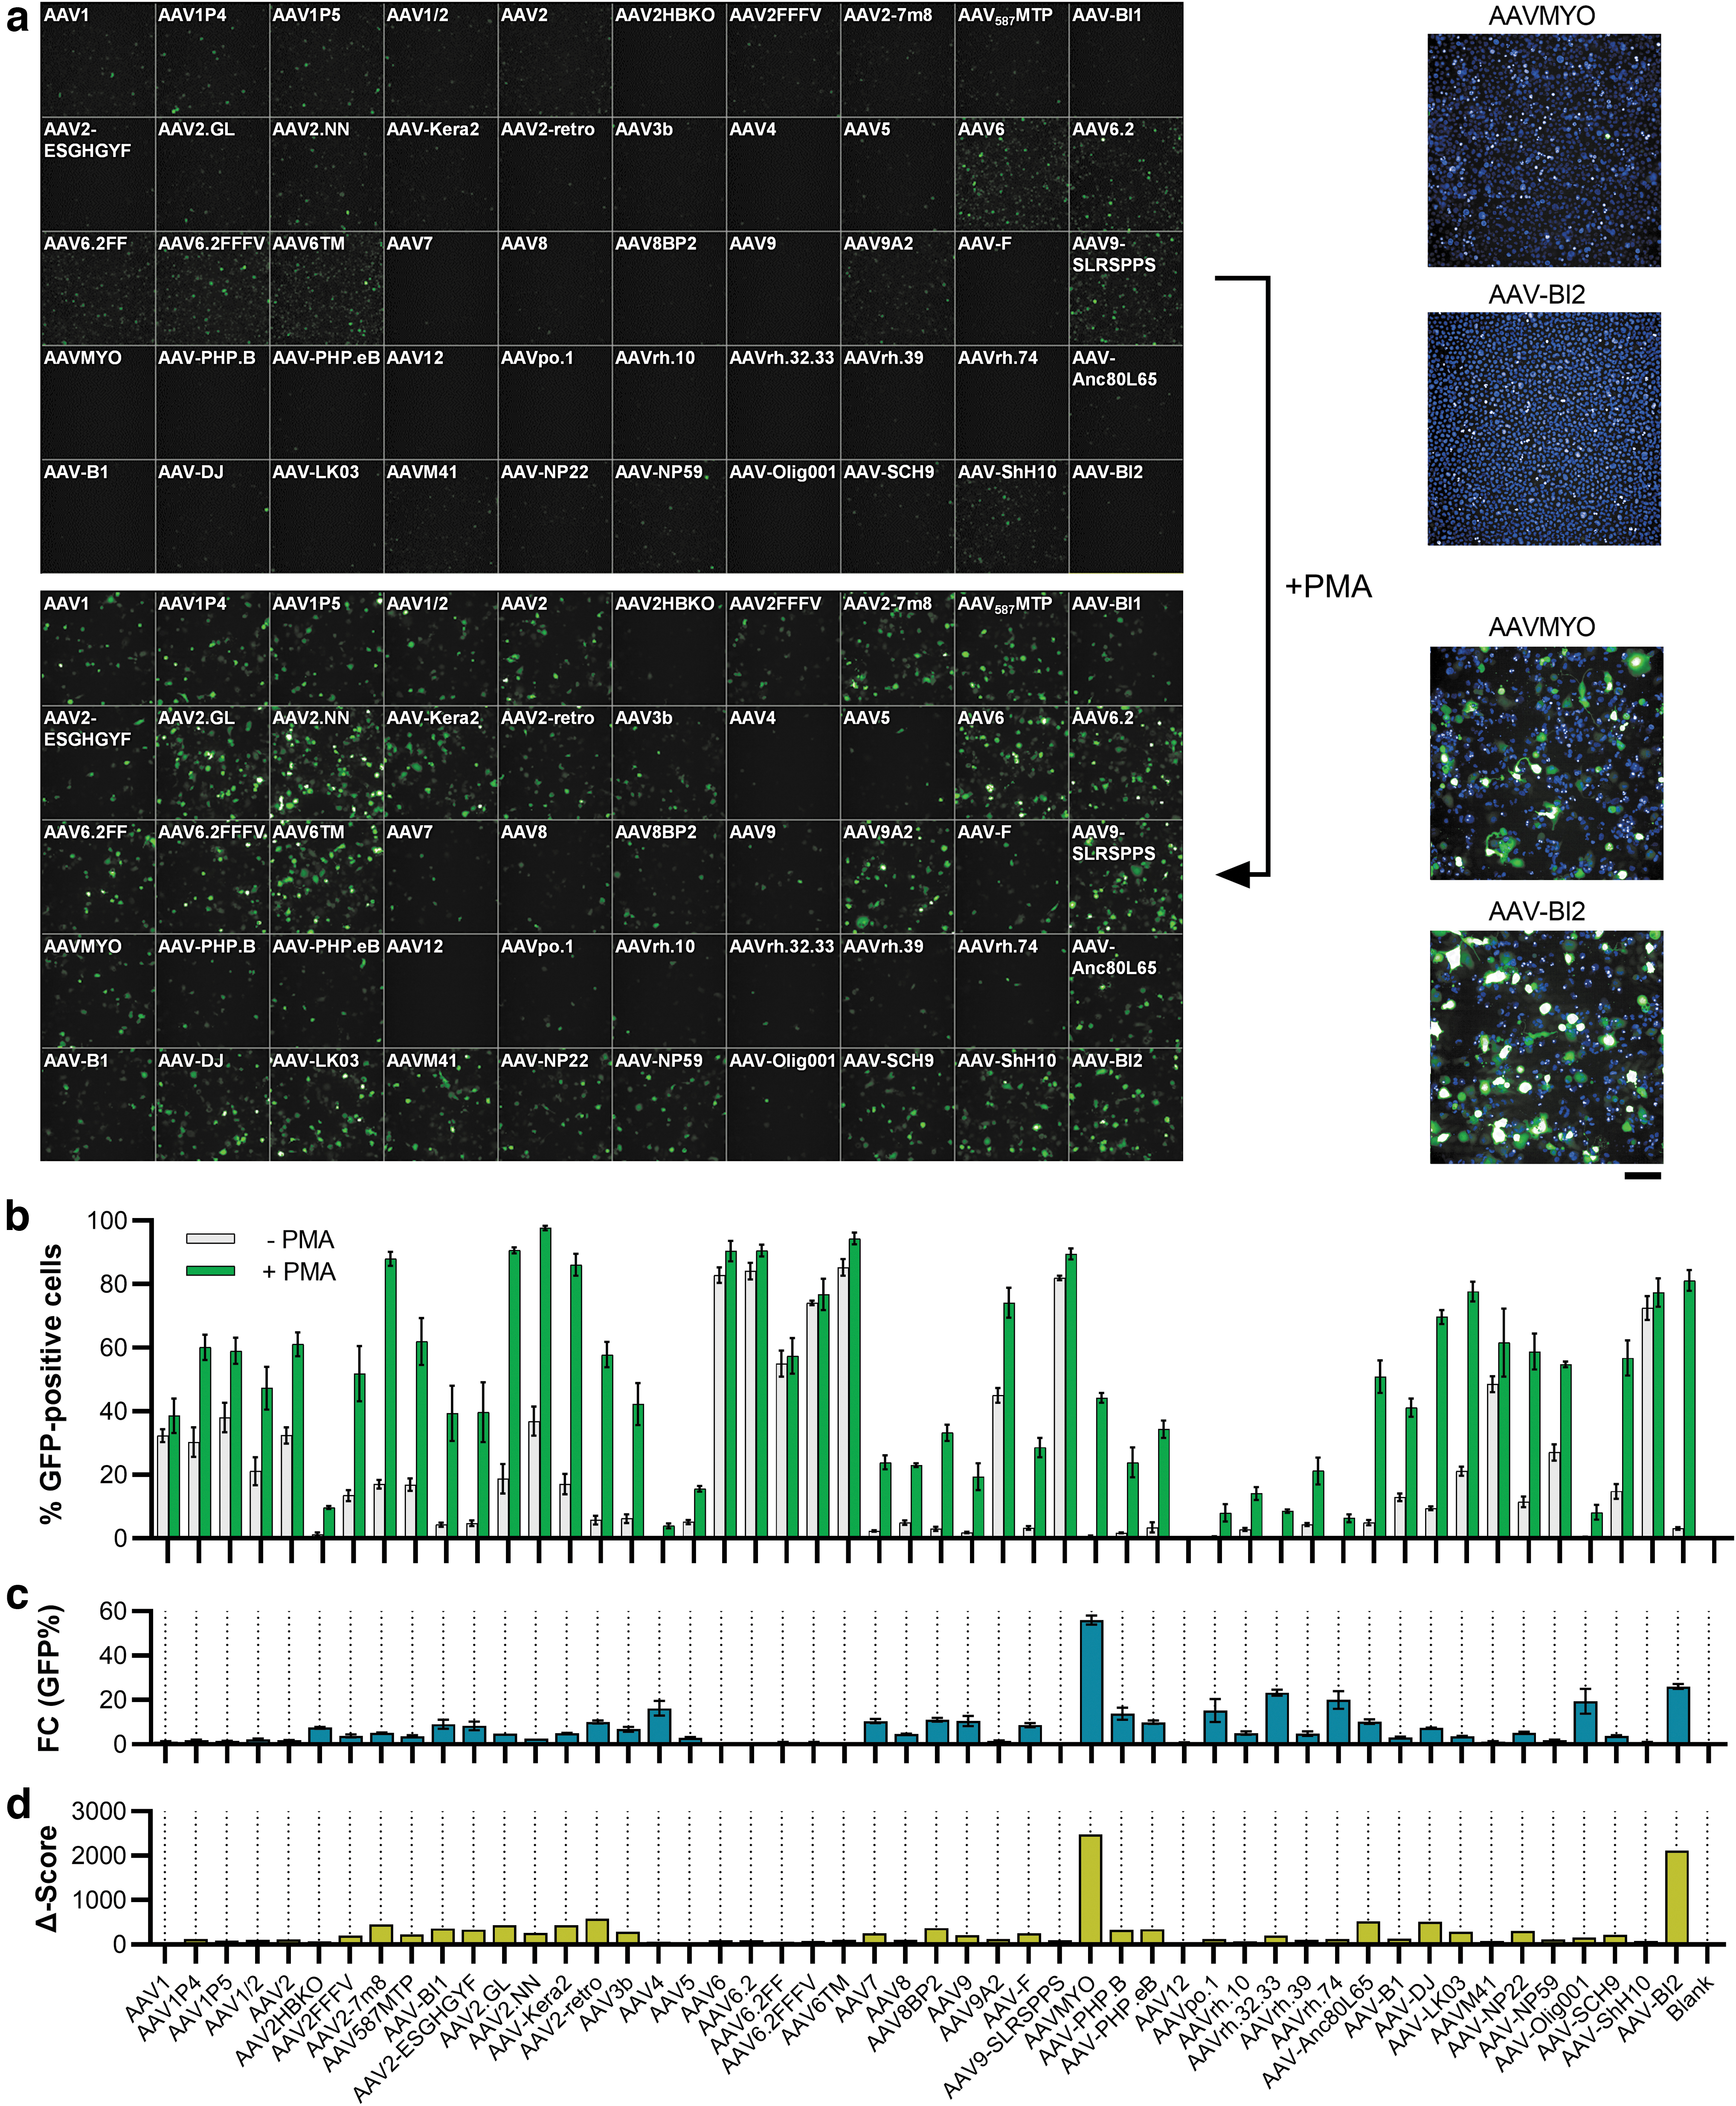
Transduction efficiency on THP-1 cells dependent on PMA stimulation. Sixty thousand THP-1 cells were seeded into 96-well plates and conditionally stimulated with 20 ng/mL of PMA, followed by cultivation in regular media. Twenty-four hours after seeding, cells were transduced with the AAV panel (2 × 10⁹ vg per AAV variant). Three days later, images were taken by
Rescue of fibrotic phenotype in an siRNA-screening assay in human hepatic stellate cells, using AAV9-SLRSPPS.
Eleven thousand cells/96-well were seeded 24 h before transduction and imaged 72 h later. Primary human dedifferentiated fat (DFAT) cells were isolated from subcutaneous adipose tissue samples (Hepacult), largely as described previously. 24 Briefly, the tissue was dissociated by incubation with 1 mg of collagenase-II solution per mg tissue for 5–10 min at 37°C under gentle agitation followed by filtration through gauze and washing of the cells. Floating cells were then seeded into a culture flask filled with DMEM/F12 + 15% FBS +1% Anti-Anti (No. BE12-719F, Lonza; No. 15240062, Thermo Fisher) and incubated upside down for 1 week to facilitate attachment of the floating cells to the bottom of the flask. For differentiation, cells were cultured in the omental adipocyte differentiation medium (No. OM-DM-500; ZenBio) for 1 week, followed by the omental adipocyte maintenance medium (No. OM-AM-500).
Fifteen thousand cells were seeded for AAV transduction, and GFP-positive cells were quantified 72 h later. HepG2 cells were cultured in MEM with 1% NEAA +10% FBS (Nos. 41090-028, 11140-050; Thermo Fisher) and seeded at a density of 50,000 cells/96-well 24 h before transduction, with imaging taking place 2 days later. THP-1 cells were cultured in RPMI 1640 + 10% FBS +1% P/S and seeded at a density of 60,000 cells/96-well. For differentiation, cells were stimulated with 20 ng/mL phorbol 12-myristate 13-acetate (PMA; No. P1585; Sigma) for 8 h and subsequently cultured in regular media. Cells were imaged 72 h after AAV transduction.
AAV transduction
After confirming the purity of the viral batches, virus solutions were diluted with AAV formulation buffer (1 × DPBS, 1 mM MgCl2, 2.5 mM KCl, 10% glycerol, 0.001% Pluronic F-68, pH 7.4, sterile-filtered) to 2 × 10⁸ vg/μL, and 110 μL of the respective dilution was transferred to a 96-well plate consequently creating the AAV panel. Capsid panel plates were stored at −80°C until usage. For the transduction of a cell type, 10 μL of every AAV variant was added to the respective wells of a black ViewPlate-96 (PerkinElmer) harboring the cells. Hence, a total of 2 × 10⁹ vg was used for the transduction corresponding to 100,000 vg/cell in the case of 20,000 cells. Cells were incubated for 3 days at 37°C, 5% CO2 before measuring the eGFP intensity by microscopy and flow cytometry.
GFP detection by microscopy
To detect GFP-positive cells, ViewPlates were processed with an Opera Phenix High-Content Screening System (PerkinElmer). Five evenly distributed 646 μm2 fields were measured per 96-well with Brightfield, GFP (excitation at 488 nm, emission at 500–550 nm), and Hoechst33342 (excitation at 405 nm, emission at 435–480 nm) channels. Exposure settings for the GFP channel were fixed to 100 ms and 300 ms for Brightfield and Hoechst33342. Resulting pictures were analyzed with the Columbus Image Data Storage and Analysis System (PerkinElmer). Exposure settings in the software were adapted to HEK293H cells (Xmin = 0, Xmax = 50,000, Xfmid = 0.25) since this cell type exhibited the strongest GFP signals.
In a first step, the Hoechst33342 signal was used to automatically detect vital nuclei. Uneven or overlapping nuclei were excluded by the script. To measure GFP intensities of the vital nuclei area, GFP background signal levels were first determined by quantifying the GFP signal of an untransduced well. Seconf, GFP intensities of vital nuclei areas of transduced wells were measured and averaged to obtain the final GFP intensity score. As an additional readout, percentages of GFP-positive vital nuclei areas were determined for each sample.
GFP detection by flow cytometry
For the quantification of GFP intensity by flow cytometry, cells were washed with 100 μL of 1 × DPBS, afterward detached from the 96-well plate using 30 μL of trypsin-EDTA (Merck) or StemPro™ Accutase™ (Thermo Scientific), and finally mixed with 170 μL of DMEM, 10% FBS. A single-cell suspension was made by pipetting up and down enabling detection with the LSRFortessa™ (BD). Before making measurements, the machine was calibrated using CS&T Research Beads (BD) and by following the instructions in the FACSDiva™ Software (BD). FSC-A against SSC-A depiction allowed separating cellular debris from vital cells and SSC-A against SSC-H was used to differentiate singlets from doublets. Gate for FITC-A was set based on untransduced living singlets, and the percentage of GFP-positive cells as well as mean fluorescent GFP intensities (mean fluorescence intensity [MFI]) were subsequently determined. Values of three replicate 96-well plates were then averaged and standard deviation was calculated.
To address the differences in granularity and size of the tested cell types, forward and side scatter was adjusted accordingly every time. Voltage of the FITC laser was left unchanged for all measurements to guarantee an unbiased outcome.
Collagen assay in HepSCs
For the collagen assay, 4,000 primary HepSCs were reversely transfected with small interfering RNA (siRNA) pools (ON-TARGET Plus siRNA; Horizon Discovery) at a final concentration of 16.6 nM using 0.4 μL of RNAimax in stellate cell medium (SteCM-b [ScienCell/Innoprot] + 1 × SteCGS [ScienCell/Innoprot] + 2% FBS), and simultaneously reversely transduced with different amounts of AAV, as detailed in the results. Twenty-four hours after transfection/transduction, cells were washed and cultured in starvation medium (0.25% FBS) for another 24 h, followed by conditional addition of TGF-β1 (final concentration 10 ng/mL; R&D Systems). Seventy-two hours later, cells were fixed with methanol and stained with Hoechst33342 and an anti-collagen-I antibody (No. SAB4200678; Sigma), as described in detail before. 25 A custom image analysis script 25 was finally used to quantify collagen fibrils and nuclei, thereby enabling calculation of collagen fibrils per cell.
RESULTS AND DISCUSSION
Production and characterization of the AAV panel
To identify the most potent AAV capsids for the transduction of various cell types in vitro, we nominated 50 of the most commonly used, largely published AAV variants (Table 1) for an unbiased head-to-head comparison (Fig. 1a). To ensure equal quality of the respective AAV batches, the vectors were produced using a well-established AAV production workflow based on adherent HEK293H cells, followed by AAV purification from cell lysates by iodixanol gradient purification and ultrafiltration. 22 Virus yields were subsequently quantified by ddPCR. The used AAV variants demonstrated varying production efficiencies, with the highest viral genomes per squared cm of culture area (vg/cm2) observed for AAV6.2, AAV6.2FF, and AAV6.2FFFV and the lowest yields detected for AAV-NP59, AAVM41, and AAV-Anc80L65 (Fig. 1b). Average production efficiency across all 50 variants was 1.35 × 10⁹ vg/cm2.
Capsids of adeno-associated virus panel
AAV, adeno-associated virus.
Of note, as there are known serotype-dependent differences in the amount of vector particles released to the culture medium, 26 higher yields could probably be achieved for some of the variants by using both lysate and medium for AAV purification. To further characterize the quality of the viral batches, 1 × 10¹⁰ vg was loaded onto an agarose gel to visualize the integrity of the viral genome (Fig. 1b). The self-complementary genome was observed at the expected size of 2,141 bp next to faint bands of potentially truncated cargos. The latter observation is in line with recent discoveries that certain structures such as short hairpins in the AAV genome may promote replication stalling, and therefore, a smaller population of diverse cargo variants besides the full-length ITR-to-ITR version. 27 –29 Capsid protein purity was finally assessed by Oriole staining of SDS-PAGE gels (Fig. 1b) and revealed the expected VP1, VP2, and VP3 band patterns.
Interestingly, additional bands at ∼30 and 50 kDa were observed for the peptide-modified AAV1, AAV2, and AAV8 capsids AAV1P4, AAV1P5, AAV2-7m8, AAV-BI1, AAV2-ESGHGYF, AAV2.GL, AAV2.NN, AAV-Kera2, AAV2-retro, and AAV8BP2. In contrast, no further bands were found for the peptide-modified AAV9 variants AAV9A2, AAV-F, AAV9-SLRSPPS, AAVMYO, AAV-PHP.B, and AAV-PHP.eB. While a detailed investigation of these observations is beyond the scope of this work, the data might point toward differential copurification of host cell proteins or a potential instability/sensitivity of certain peptide display variants in the herein used production system. While the principal propensity of AAVs for protease-mediated capsid cleavage has been described under both artificial (e.g., proteinase K) 30 and process-related conditions (e.g., trypsin 31 used for cell detachment or baculoviral cathepsin in the SF9 production system 32 ), these enzymes' involvement can be excluded, given that the AAVs herein were produced in HEK293 cells, and using EDTA instead of trypsin for cell detachment.
Moreover, also differential thermostability of natural AAV serotypes is well documented, 33,34 with two recent studies further indicating lower melting points for AAV2.GL, AAV2.NN, and other AAV2-based peptide insertion variants. 35,36 However, while peptide insertions per se as well as lower capsid thermostability can impact several aspects of AAV biology, including genome packaging, cellular binding/uptake, intracellular transport, and genome release, 35,37,38 it has (to our knowledge) not been investigated whether altered thermostability (with melting points >50°C) is predictive for a capsid's susceptibility to stressors and fragmentation at temperatures faced during vector production (≤37°C). Additional experiments are therefore required to explain the occurrence and identity of the protein bands observed besides VP1–3 in Fig. 1b.
After titrating all 50 AAV vector batches and performing the aforementioned quality control steps, equal amounts of all variants were arrayed on 96-well plates and stored at −80°C until use. For all upcoming transduction efficiency screenings, target cells were seeded in 96-well plates and transduced by adding 10 μL (2 × 10⁹ vg) of the AAV panel variants per well.
As a reference for all experiments, HEK293 cells were transduced and analyzed, first (see web app and Fig. 5). To allow for direct comparability of GFP fluorescence intensity across all tested cell types, high-content imaging parameters were set using HEK293 cells and then used for all other measured cell types. Figure 1c shows the layout of the AAV panel and an exemplary GFP micrograph of the Müller glia cell line MIO-M1 upon transduction. The data clearly show strong differences in both the various AAVs' transduction efficiency and the GFP expression intensity mediated by the vectors in these cells. To quantify the percentage of GFP-positive cells and the MFI of GFP signal, semiautomated image analysis was applied.

Overview of transduction data and selected application examples for the five AAV core panel variants.
Supplementary Figure S1 shows an exemplary output of the web app that was designed to enable access to the results of all screened cells, including GFP micrographs and quantitative expression data. In addition to the percentage of GFP-positive cells and the GFP MFI, also a combined “Activity score,” calculated by multiplying the % GFP-positive cell value with the GFP fluorescence intensity (% GFP-pos. × MFI/100) is reported. The Activity score is a simple composite measure for overall capsid performance, integrating both transduction efficiency and the degree of transgene expression mediated by a given capsid. It is also useful to rank powerful capsids in instances, where the used AAV dose led to 100% transduction efficiency and probably multiple transduction events per cell.
Due to the interactive setup of the web app, all quantitative readouts can also be automatically sorted to rapidly identify the best performing AAV variants (Supplementary Fig. S1b), which in case of MIO-M1 were AAV6.2, AAV6TM, and AAV2.NN. AAV6.2 is a point-mutated (F129L) variant of AAV6 that was initially described for the transduction of primary human airway epithelial cells 39 and is also one of the most powerful AAVs for lung epithelial transduction in mice. 40 AAV6TM contains three mutations of two surface-exposed tyrosine and one threonine residue (Y705F, Y731F, T492V) over AAV6, and was shown to effectively transduce hematopoietic stem/progenitor cells (HSCs) ex vivo, 41 a finding that was also confirmed in our analyses (see web app and Fig. 5).
Finally, AAV2.NN is a recently published, AAV2-based peptide insertion (NNPTPSR) variant that was isolated using a systemic, retina-focused selection approach in mice and turned out to broadly transduce all retinal layers, including photoreceptors, in mice, dogs, and nonhuman primates upon intravitreal administration. 35
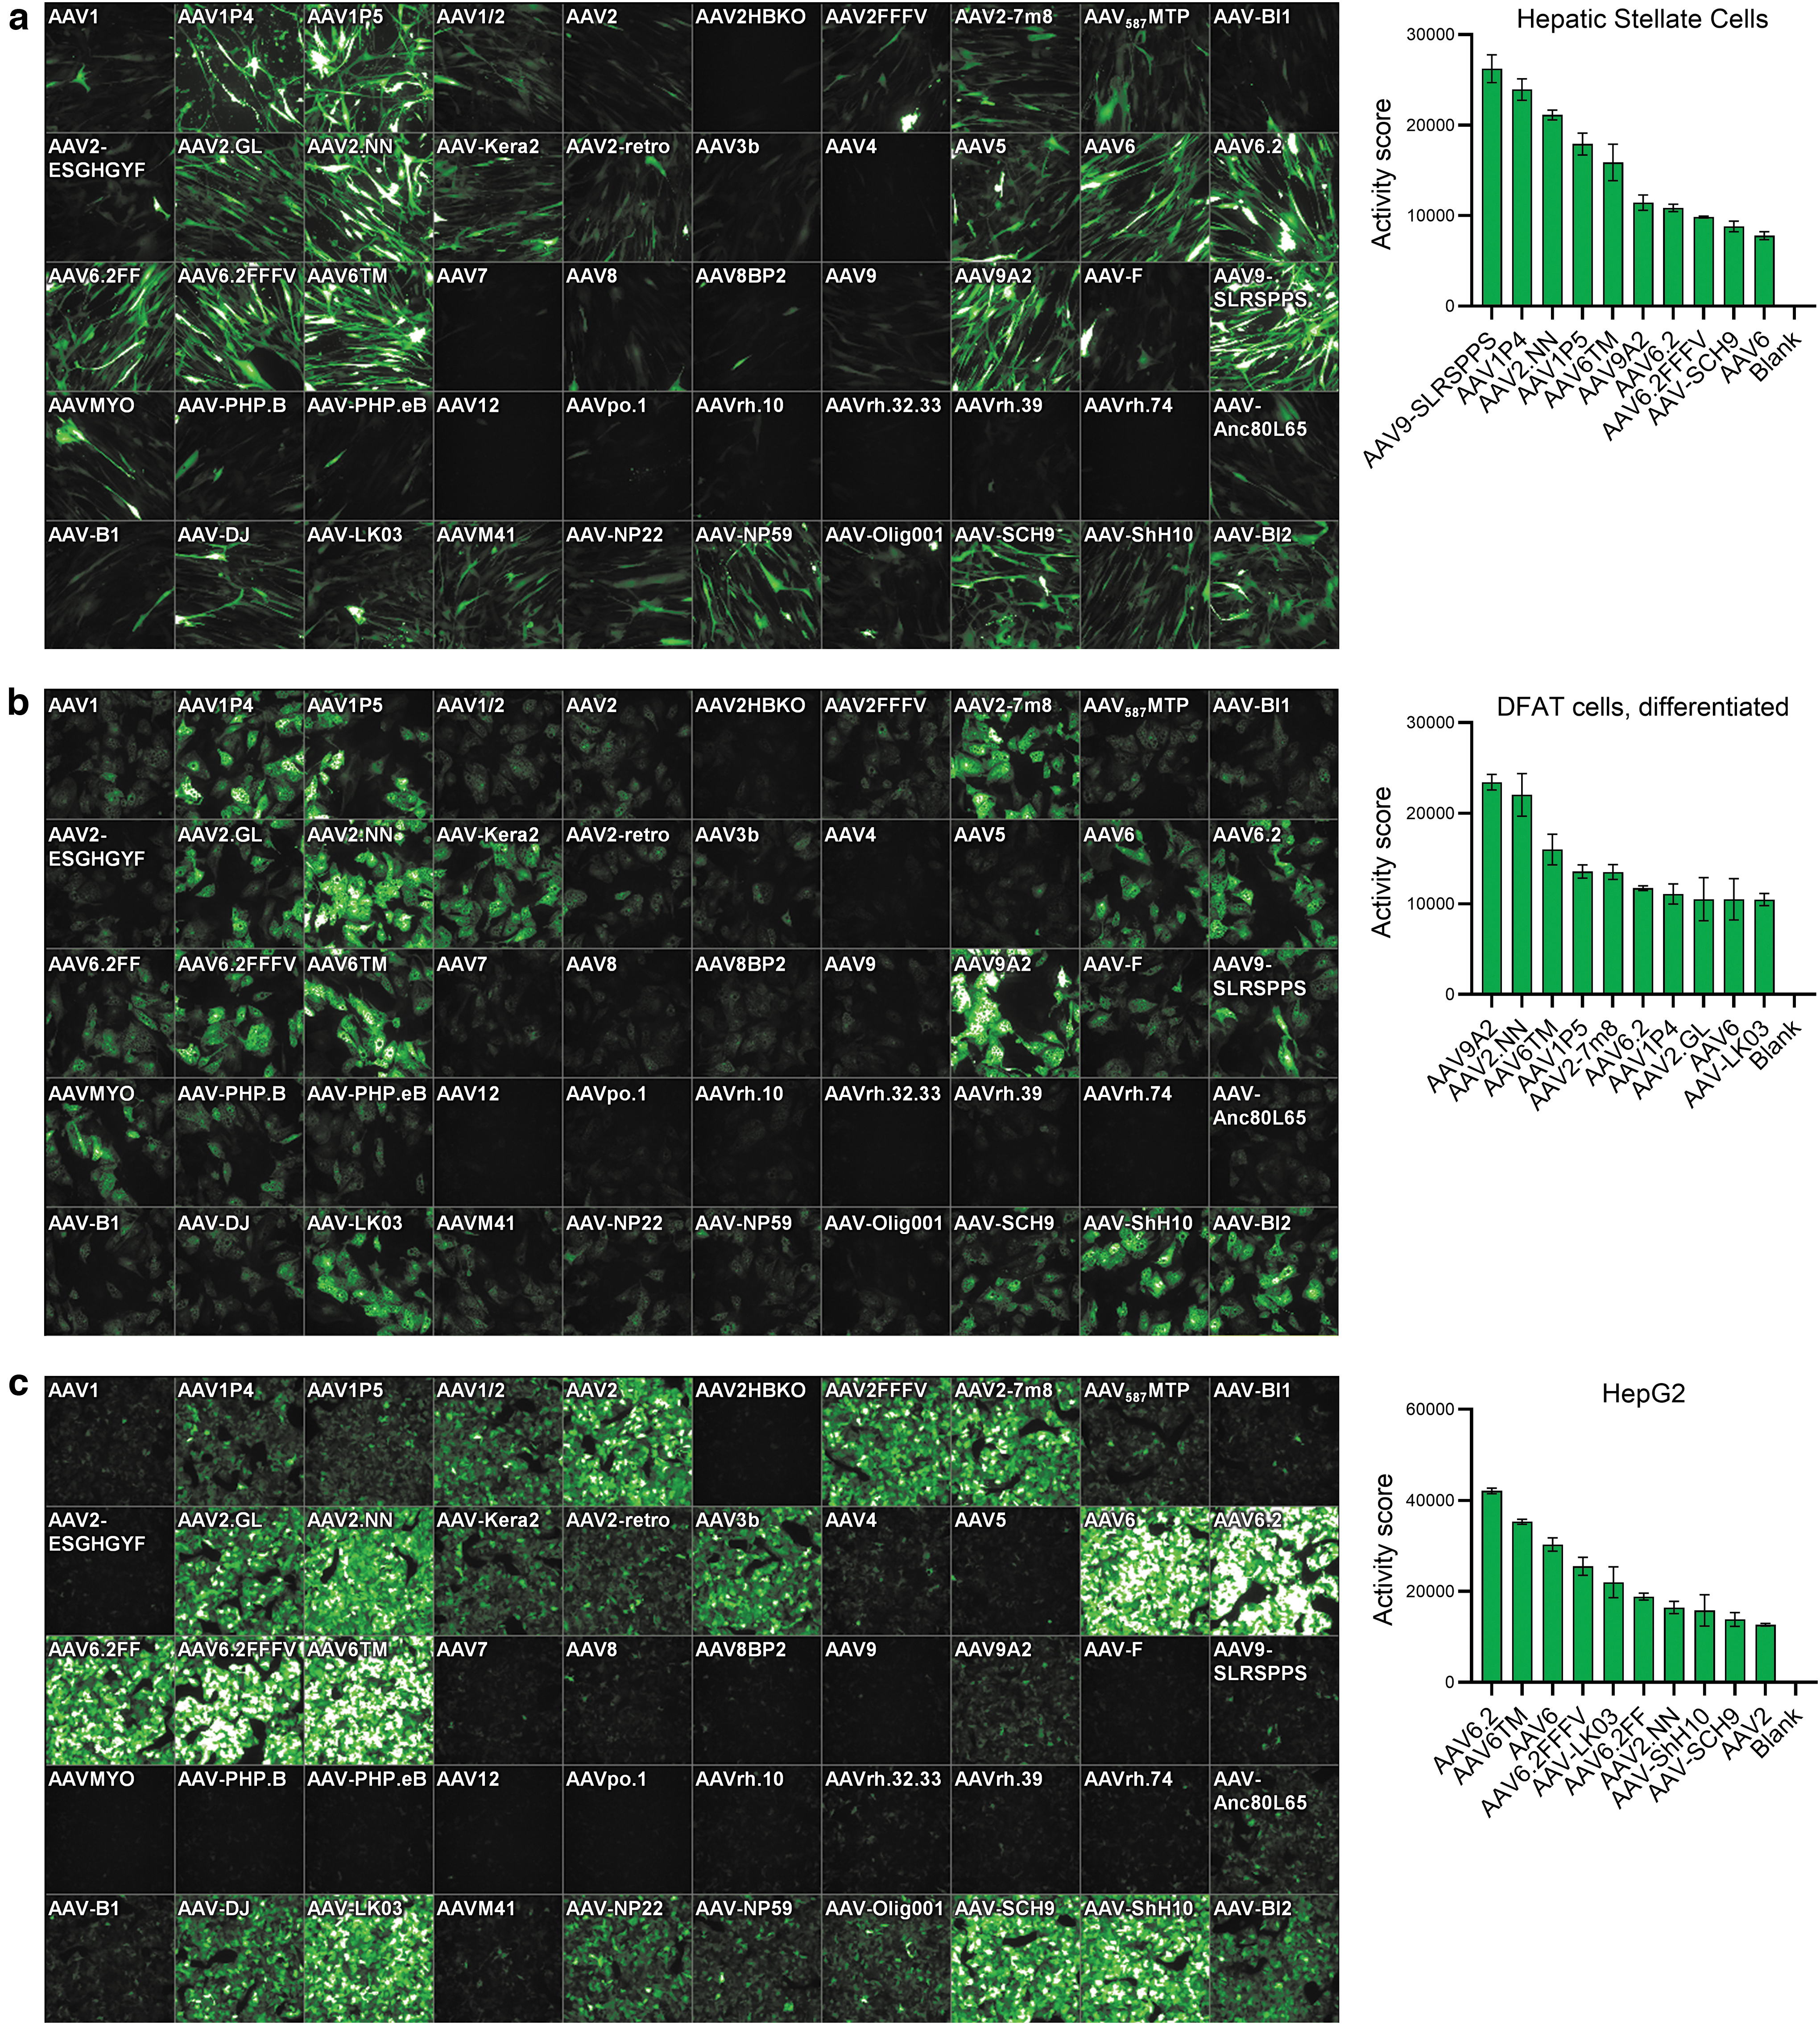
Transduction of liver and adipose tissue cells
Cell culture models of liver and adipose tissue are of interest to study potential target genes, pathways, and biomarkers in the context of obesity and nonalcoholic steatohepatitis (NASH) drug discovery research, as well as for (cardio-)metabolic gene therapy approaches. Our analyses therefore also included several cell types with relevance for these indications, for example, hepatocytes, stellate cells, fat cells differentiated toward white or beige/brown phenotypes, and immortalized brown adipocytes. 42 AAV transduction efficiency for three of those cell types, that is, primary human HepSCs, differentiated human DFAT cells, and the hepatocyte cell line HepG2, is shown in Fig. 2. For HepSC, many variants showed efficient transduction, with AAV9-SLRSPPS—a peptide-inserted AAV9 variant that was selected on human coronary endothelial cells 43 —displaying the highest Activity score.
The following five AAVs in the rank order again contained AAV2.NN and AAV6TM, but also three peptide-insertion variants published by the Grimm laboratory, that is, AAV1P4 (peptide: NDVRSAN), AAV1P5 (NDVRAVS), and AAV9A2 (NYSRGVD), all of which markedly outperformed their parental capsids. Interestingly, the P4 and P5 peptides also originate from a selection on endothelial cells, 7,20 similar to SLRSPPS.
In adipocytes generated by differentiation of primary human DFAT 24 cells, an overall similar transduction pattern was observed, with AAV9A2 and AAV2.NN being the most efficient variants (Fig. 2b), followed by AAV6TM, AAV1P5, and AAV2-7m8, which was previously found to be one of the best performing AAVs in various cell types in vitro. 21 In contrast, AAV9-SLRSPPS only showed low expression in DFAT cells. Very similar results were also observed for a second DFAT donor (with AAV2.NN being the top hit) as well as other cellular fractions isolated from adipose tissue (Fig. 5).
Finally, HepG2 cells displayed very effective transducibility (Fig. 2c), as evident from the strong and partly oversaturated GFP signal (with the latter being a result of choosing identical AAV amounts and exposure times for all tested cell cultures for reasons of comparability). On HepG2, the AAV6 family showed most efficient transduction, led by AAV6.2. Of note, the human hepatocyte-selected AAV-LK03 variant 15 was similarly efficient, and AAV3b, a wild-type capsid that rarely shows efficient transduction in vitro, also displayed strong effects in these cells, in line with its largely human liver cell-restricted tropism. 44 In contrast, AAV-NP59, which was also described for human liver transduction, 45 showed weaker expression. These results give some insight into the difficulties associated with choosing cellular models predictive of in vivo tropism. Still, the results might suggest suitability of HepG2 cells as an intermediate filter or a preselection step in capsid engineering cascades aiming for human liver transduction.
AAV transduction of adherent versus suspension cultures
While testing various cell types for their amenability to AAV transduction, also marked differences between cell types in suspension and adherent culture were observed. For instance, the human monocytic cell line THP-1 was transduced both in suspension culture and following differentiation using PMA, upon which the cells differentiate into a macrophage-like phenotype, which is accompanied by attachment to the culture plates (Fig. 3). When analyzing the transduction data, several AAV variants achieved high and similarly efficient transduction rates in both suspension and adherent cultures, with AAV6, AAV6.2, AAV6TM, AAV9-SLRSPPS, and AAV-ShH10 showing more than 80% GFP-positive cells under both conditions (Fig. 3a, b). In contrast, some AAVs only showed very low transduction in suspension, but drastic increases in the differentiated state, upon cell attachment (Fig. 3b). Respective changes are illustrated as the fold change in the percentage of GFP-positive cells in Fig. 3c.
To correct for the effect that some variants showed high fold changes but still very low numbers of GFP-positive cells (which was observed e.g., for AAV4, the rhesus isolates and AAV-Olig001), the fold change in %GFP-positive cells was further multiplied with the absolute percentage of GFP-positive cells in the differentiated state to calculate the so-called Δ-score (Fig. 3d). This score allowed for the rapid identification of AAV variants whose changes between suspension and adherent culture were strong but also meaningful in terms of overall efficiency. Strikingly, the two top hits were AAVMYO and the variant AAV-BI2, both of which harbor the identical, integrin binding motif-containing RGDLGLS peptide.
These results clearly suggest that the observed increases in transduction efficiency (from 0.8% to 44.2% and 3.1% to 81.2%, respectively) are mediated by integrins that are upregulated upon cell attachment. Besides this obvious RGD motif-mediated effect, many other AAV variants also showed varying degrees of transduction enhancement in adherently growing cells, whereas others, for example, AAV1 and AAV6-related vectors, including AAV-ShH10 did not display any differences (Fig. 3b, c). The observation that also the AAVR-independent 46 serotypes AAV4 and AAVrh32.33 displayed respective increases makes it unlikely that altered AAVR expression is the explanation for this finding. However, a plausible hypothesis is that PMA directly impacts AAV transduction, similar to several other small molecules that were identified as AAV transduction enhancers by the Samulski group. 47 Of note, PMA is a known inducer of macropinocytosis, 48 a process whose inhibition was demonstrated to modulate AAV cellular entry in a cell-type-dependent manner. 49
These results demonstrate that the AAV panel, in addition to its utility for the identification of potent AAVs, can also be used to shed some light on receptor usage and cellular properties that may conditionally confer amenability to the transduction by certain AAV variants. Possible applications in that regard include transduction experiments on cells under healthy and (induced) pathological conditions, possibly combined with proteomic analyses to examine receptor deregulation.
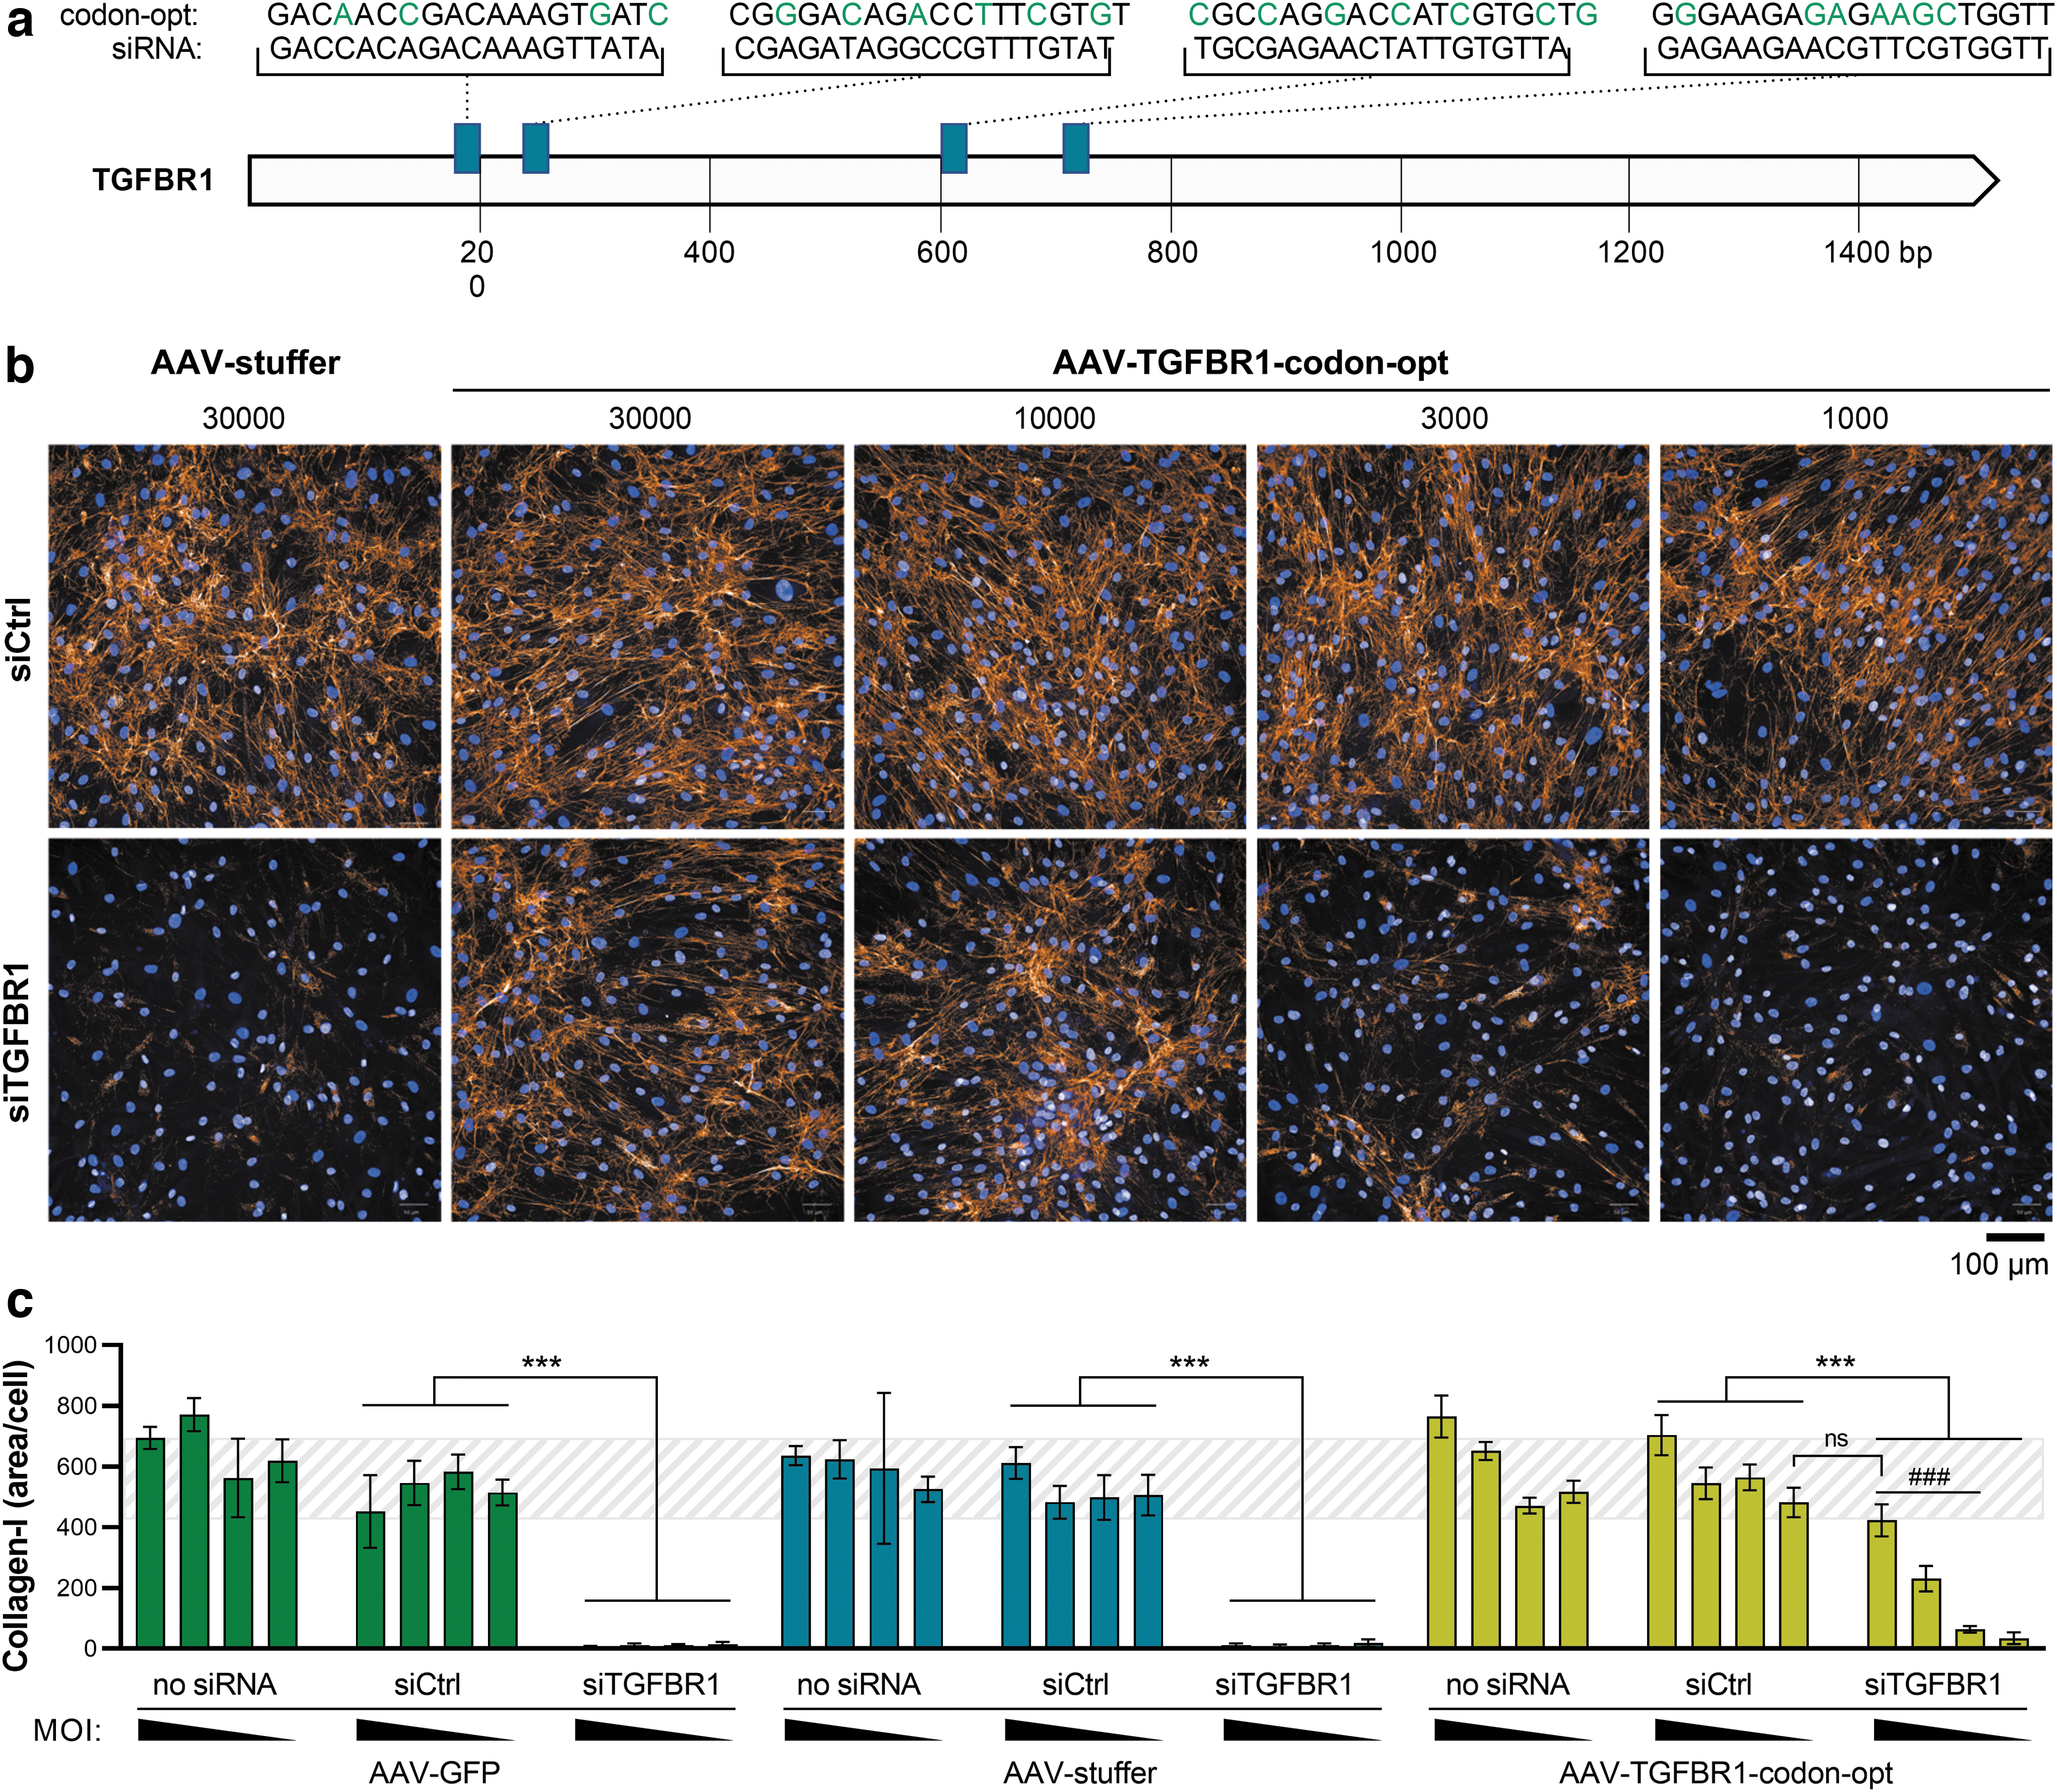
Rescue of fibrotic phenotype in an siRNA-screening assay in human HepSCs
As outlined above, AAVs capable of transducing primary human cells with high efficiency are valuable tools for early drug discovery research. In the context of metabolic diseases, obesity, fatty liver disease, and NASH are diseases with high prevalence, therefore representing focus areas for the development of new therapeutic treatments. In fact, there is also a clinical link between these diseases, as obesity represents a risk factor for nonalcoholic fatty liver disease and resulting pathologies including NASH and liver fibrosis. 50 To identify and validate targets that drive fibrogenesis, our group has previously developed a high-content imaging-based phenotypic assay based on TGFβ1-induced collagen-I expression. 25,51 In addition to primary lung fibroblasts and airway epithelial cells in the original publication, this assay has meanwhile been expanded to primary HepSCs.
In this study, HepSCs are transfected with siRNAs targeting a protein/transcript of interest, stimulated with TGFβ1 and subsequently stained for collagen-I. Target candidates whose knockdown exerts potential antifibrotic effects are therefore characterized by a lowered profibrotic collagen deposition in those cells.
As a positive control, a pool of four siRNAs, targeting TGFβ receptor 1 (TGFBR1) (Fig. 4a), is routinely applied, thereby disrupting profibrotic TGFβ1 signaling and preventing collagen deposition (Fig. 4b, c). However, the ability to rescue fibrogenesis by reconstituting expression of siRNA-depleted genes would be an attractive feature in this assay, especially to validate potential hits and to characterize poorly explored novel targets. We therefore screened the AAV panel on HepSCs and found AAV9-SLRSPPS to result in a transduction efficiency of up to 98% (Fig. 2a). Using this vector, we then expressed—as a proof-of-concept—a TGFBR1 variant that was codon-usage optimized to escape targeting by the cotransfected anti-TGFBR1 siRNAs (Fig. 4a).
To this end, HepSCs were reversely transduced and transfected by mixing the cells with increasing amounts of AAV (1,000, 3,000, 10,000, 30,000 vg/cell) and the siRNA pool, respectively, before seeding into multiwell culture plates. Following starvation and subsequent stimulation with 10 ng/mL of TGFβ1, the cells were incubated for 48 h, stained with Hoechst 33342 to visualize nuclei as well as a fluorescent anti-collagen-I antibody, and imaged on an Opera Phenix system (Fig. 4b). Collagen fibrils were identified by an automated image analysis and normalized to the number of nuclei (i.e., cells) per well (Fig. 4c). Notably, while treatment with the anti-TGFBR1 siRNA resulted in the expected blockage of TGFβ-induced collagen expression, AAV-mediated coexpression of codon-altered TGFBR1 successfully rescued the fibrotic phenotype in a dose-dependent manner (Fig. 4b, c).
In contrast, control-AAVs containing either a GFP reporter gene or noncoding DNA (“AAV-stuffer”) did not increase collagen expression. Interestingly, under conditions where endogenous TGFBR1 expression was maintained (i.e., no siRNA or siCtrl), AAV-TGFBR1 increased collagen deposition beyond the levels observed with AAV control vectors, indicating that supraphysiological TGFBR1 availability can enhance the overall level of collagen.
In summary, AAV-mediated rescue of siRNA-depleted TGFBR1 clearly enabled restoration of the pathological phenotype, thereby building the basis for the profiling and validation of NASH-relevant targets in this primary cell-based assay.
Intercellular comparison and identification of a core AAV panel sufficient for transduction of all tested cell types
Finally, the transduction data collected for all cell types across tissues were compiled and visualized in Fig. 5a (% GFP-positive cells) and Fig. 5b (relative Activity score), rapidly confirming the known and highlighting several novel findings: First, tissue-derived cells are transduced at much higher efficiencies than immune and stem cells, which is a well-known fact for AAVs. An exception are the AAV6 family members AAV6.2 and AAV6TM, which achieve decent transduction rates in immune and hematopoietic stem cells, in line with the original publication for AAV6TM. 41 In contrast, AAV6.2FF and AAV6.2FFFV (which combine the mutations of 6TM and FF) did not show any obvious superiority over parental AAV6 in most cell types.
Second, some engineered AAV variants are largely inefficient in vitro, including the heparin binding domain-depleted AAV2HBKO, the lung endothelium-tropic AAV2-ESGHGYF, the retinal bipolar cell-targeting AAV8BP2, and the blood–brain barrier-crossing PHP variants. The Anc80L65 variant was also largely inefficient and additionally characterized by very low production yields, which had also been observed by the authors of the original study 52 (Fig. 1b). Similarly, several wild types only showed low or moderate overall efficiency, including AAV4, AAV7, AAV8, AAV9, AAV12, AAV.po1, AAVrh.10, and AAVrh.74. For this reason, particularly notable findings were the significant transduction efficiency of AAV3b in HepG2 cells, and that of AAV12 in the HepSC line LX2 (Fig. 5a). In this study, AAV12, in stark contrast to all other cell types, showed remarkably strong expression, potentially providing an interesting starting point for the identification of the receptor mediating this effect.
Third, the AAV-LK03 variant, a chimeric capsid selected for human hepatocyte transduction, emerged as the best capsid for the transduction of iPSCs, a cell type notoriously difficult to be engineered by AAVs. Additional experiments to characterize LK03's utility in this context are currently ongoing in our group. The last major and most important finding of our study is the identification of AAV variants that showed very broad transduction efficiency, largely independent of the tissue origin of transduced cells.
These data demonstrate that a selection of only five capsids, AAV2.NN, AAV9-SLRSPPS, AAV6.2, AAV6TM, and AAV1P5, is sufficient to identify highly efficient capsids for all tested cell types, exemplary images of which are shown in Fig. 5c. Therefore, a lean “core panel” comprising these five AAV variants could be used in the future to identify potent in vitro tool capsids. Such a core panel could also easily incorporate serial vector dilutions to enable capsid comparison across different doses as well as rapid identification of the most suitable vector dose for a given cell type.
The broadest efficiency and the highest number of top rankings showed AAV2.NN, an only recently identified, AAV2-based NNPTPSR peptide insertion variant, which was isolated in a retina-focused screening and showed highly efficient transduction upon intravitreal administration in mice, dogs, and nonhuman primates. 35 Interestingly, despite their focus on retinal transduction and in contrast to most other capsid selection approaches, the approach of Pavlou et al was based on systemic delivery of the AAV library and recovery of viral genomes only 24 h after administration. While it is unclear whether this stringent selection process is the reason for this capsid's superior performance, it is certainly noteworthy, especially as AAV2.NN seems to achieve high transduction efficiencies already at a relatively low vg/cell (ongoing work, data not shown). Its higher potency also often compensates for its lower production efficiency, compared with other high performers, for example, AAV6.2 (Fig. 1b).
Another efficient capsid in our comparative analysis was AAV9-SLRSPPS, initially selected by Oliver Müller's laboratory for endothelial transduction. 43 In line with the original finding, our data confirm this variant's strong efficiency on human umbilical vein endothelial cells (Fig. 5), where it was superior to all other tested capsids, including the parental AAV9. Interestingly, it was also the most efficient capsid in HepSCs, normal human lung fibroblasts (NHLF), and synoviocytes (Fig. 5c), all of which are of mesenchymal origin. Similar to AAV9-SLRSPPS, AAV1P5 was also built by incorporation of an endothelial-targeting peptide, NDVRAVS. 7,20
Overall, AAV1P5 showed a very similar transduction pattern as AAV9-SLRSPPS, however, in some instances, for example, mouse- and rat-derived cortical neurons (Fig. 5c), it led to higher expression levels, justifying its nomination for the core panel. Moreover, also AAV9A2, another variant from the Grimm laboratory, was particularly efficient in neurons and additionally standing out in FL83B, a liver cell line useful for preclinical studies due to its murine origin.
Last, the AAV6 variants AAV6.2 and AAV6TM showed a remarkably broad efficiency across many cell types of different origins. Of note, also immune cells, which in general are difficult to transduce using AAVs, were transduced at a relatively high efficiency, including monocyte-derived dendritic cells and macrophages as well as the monocytic cell line THP-1 (Fig. 5c). AAV6TM further transduced murine HSCs, confirming the original publication, 41 and human iPSCs. Given that AAV6.2 and AAV6TM only harbor one (F129L) and three (Y705F, Y731F, T492V) mutations, respectively, compared with the parental AAV6 capsid, these data also nicely illustrate how small defined changes to a capsid can have a major impact on its performance.
Yet, despite the convincing effects on various tested cell types in vitro, a similar in vivo performance of the five core panel variants and all other herein tested AAVs cannot be easily extrapolated. This is, among others, due to the increased complexity of in vivo systems, including biodistribution across several cellular barriers, an often-pronounced liver transduction of many AAV variants, and differential receptor expression between natural and cell culture conditions. Vice versa, capsids with high in vivo potency do not necessarily show good performance in vitro, with AAV8, AAV9, and AAV-PHP.eB being only three of several nameable examples. Our previously published barcode-based mouse study 14 provides biodistribution data for most of the herein tested AAV variants after i.v. administration and can therefore serve as a source for comparative in vitro–in vivo assessment.
Finally, while we suggest AAV2.NN, AAV9-SLRSPPS, AAV6.2, AAV6TM, and AAV1P5 as a sufficient AAV core panel for the identification of powerful capsids for in vitro/ex vivo use, this selection could also be modified, for example, by replacing AAV1P5 with AAV9A2 or AAV-LK03, with the latter showing particularly strong expression in iPSCs, whereas AAV1P5 and AAV9A2 both appeared as the top hit in certain different cell types, but still showed a similar overall transduction pattern. Of note, while also other capsids, including those that were previously shown to be efficient in vitro, including AAV2-7m8 or AAV-Kera2, demonstrated overall good efficiencies, they were still constantly outperformed by one or more of the selected core panel variants.
CONCLUSION
We established a 96-well-based panel comprising 50 of the most used AAV variants to date, which allowed the identification of potent capsid variants for the transduction of various primary cells and cell lines, with a particular focus on human origin. Besides enabling the rapid identification of powerful tool vectors for cellular experiments, our data also shed light on cell-type-specific or conditional transduction patterns of certain AAV variants, which might be of use for capsid characterization or capsid engineering approaches. Importantly, our data demonstrate that a core panel comprising AAV2.NN, AAV9-SLRSPPS, AAV6.2, AAV6TM, and AAV1P5 is sufficient to identify highly potent capsids for in vitro/ex vivo use in all tested cell types. These findings will be of great practical value for early research applications, where AAV vectors are used as tools to modulate gene expression to study pathway biology, validate targets, or develop advanced screening assays.
Footnotes
ACKNOWLEDGMENTS
The authors greatly thank all the colleagues from Boehringer Ingelheim's research departments who provided cells for AAV transduction assessment and Dietmar Haag (Boehringer Ingelheim IT) for deploying the web app. We also thank Julia Dörner for conceptual contributions to the siRNA experiment.
AUTHORs' CONTRIBUTIONS
J.W.: conceptualization, methodology, investigation, formal analysis, visualization, and writing—original draft; J.S.: software; S.A., G.Z., K.Z., C.M., and J.D.-L.: investigation and formal analysis; A.P.: software; M.S.: methodology, investigation, and formal analysis; T.L.: conceptualization, methodology, investigation, project administration, and supervision; B.S.: conceptualization, methodology, investigation, formal analysis, project administration, supervision, visualization, and writing—original draft.
AUTHOR DISCLOSURE
All authors are employees of Boehringer Ingelheim Pharma GmbH & Co. KG.
FUNDING INFORMATION
This work was funded by Boehringer Ingelheim Pharma GmbH & Co. KG.
SUPPLEMENTARY MATERIAL
Supplementary Data
Supplementary Figure S1
References
Supplementary Material
Please find the following supplemental material available below.
For Open Access articles published under a Creative Commons License, all supplemental material carries the same license as the article it is associated with.
For non-Open Access articles published, all supplemental material carries a non-exclusive license, and permission requests for re-use of supplemental material or any part of supplemental material shall be sent directly to the copyright owner as specified in the copyright notice associated with the article.