
Abstract
AAV virion biology is still lacking a complete understanding of the role that the various structural subunits (VP1, 2, and 3) play in virus assembly, infectivity, and therapeutic delivery for clinical indications. In this study, we focus on the less studied adeno-associated virus AAV3B and generate a collection of AAV plasmid substrates that assemble virion particles deficient specifically in VP1, VP2, or VP1 and 2 structural subunits. Using a collection of biological and structural assays, we observed that virions devoid of VP1, VP2, or VP1 and 2 efficiently assembled virion particles, indistinguishable by cryoelectron microscopy (cryo-EM) from that of wild type (WT), but unique in virion transduction (WT > VP2 > VP1 > VP1 and 2 mutants). We also observed that the missing structural subunit was mostly compensated by additional VP3 protomers in the formed virion particle. Using cryo-EM analysis, virions fell into three classes, namely full, empty, and partially filled, based on comparison of density values within the capsid. Further, we characterize virions described as “broken” or “disassembled” particles, and provide structural information that supports the particle dissolution occurring through the two-fold symmetry sites. Finally, we highlight the unique value of employing cryo-EM as an essential tool for release criteria with respect to AAV manufacturing.
INTRODUCTION
Adeno-Associated Virus (AAV)
The unique N-terminal extension of VP1 (VP1u), along with VP2's extension, plays a crucial role in the infectivity and genome release of the particles. 4 –8 The cap gene also includes two alternative ORFs, encoding the nonstructural proteins assembly-activating protein (AAP) and membrane-associated accessory protein (MAAP). 9 –11 The rep gene encodes for four nonstructural proteins, which are expressed from two different promoters, p5 and p19, and generated by alternative mRNA splicing. 12 The transcription products are responsible for genome replication and packaging. 13,14
Structurally, the virions assemble into an icosahedral particle with a triangulation number T = 1 (one copy of the capsid protein is needed to build the entire virus structure), and possess a diameter of ∼220–280 Å. However, AAV particles to be infectious and functional require the presence of all three VP1-3 proteins into the capsid due to the functions carried out by the N-terminal domains of VP1 and VP2. 4 –6,8,15,16
This apparent promiscuity of usage of VP1, VP2, and VP3 has recently lent itself to engineering recombinant variants that are mosaic particles (e.g., chimeric AAV2/8 or 2/9 capsids, also called haploid or polyploid capsids) that can display a unique tissue tropism and immune response profile. 17 –19 The lack of pathogenicity in humans together with this biological “ductility” elevates recombinant AAVs to one of the most widely used and promising vectors for in vivo gene therapy.
Here, we focus on AAV3B, a less studied AAV serotype, but with a recently shown efficient transduction in human hepatocytes. 20,21 We have generated a collection of knockout recombinant virions VP1KO, VP2KO, and VP1VP2KO as stepping-stone biologics for future study and eventual biopharmaceuticals of rAAV technology. Remarkably, through the combination of molecular cloning, biochemical, cellular, and cryoelectron microscopy (cryo-EM) techniques we provide a complete characterization of these new biologics showing their viability in cell transduction and structural integrity—an obliged step to guarantee viability for downstream particle engineering. Further, we analyze the particles' structural heterogeneity in terms of content ratio in the context of a vector production and assessment of critical quality attributes (CQAs).
MATERIALS AND METHODS
Plasmids
The plasmids used to produce the AAV3B vectors were derived from pXR3b, which contains the AAV2 rep and AAV3B cap genes. 22 Mutations were then introduced within the AAV3B cap gene by PCR site-directed mutagenesis, to prevent expression of VP1, VP2, or both VP1 and VP2 proteins. For pXR3b-VP1KO, the ATG start codon of VP1 was changed to TGA, and the GAT codon of Asp4 was changed to GAC to remove an alternative ATG. For pXR3b-VP2KO, the ACG start codon of VP2 was changed to ACT, to keep Thr138 of VP1 while avoiding VP2 translation start. For pXR3b-VP1VP2KO, the ACG start codon of VP2 was changed to TAG within pXR3b-VP1KO. Oligonucleotide primers and plasmid templates used in the different PCRs are described in Supplementary Table S1.
Cells and viruses
The Pro10™ cell line, a suspension-adapted subclone of HEK293 cells, was cultured as previously described. 5 HEK293 (ATCC CRL-1573) and HeLa (ATCC CCL-2) cells were purchased from the American Type Culture Collection (ATCC), and were maintained in Eagle's minimum essential medium (EMEM) (ATCC Cat. no. 30-2003) and Dulbecco's Modified Eagle Medium (DMEM) (ATCC Cat. no. 30-2003), respectively, supplemented with 10% fetal bovine serum (FBS) (Sigma-Aldrich). Wild-type (WT) human adenovirus type 5 was purchased from the Translational Vector Core at INSERM UMR1089 (Nantes, France).
AAV vector production
AAV3B vectors were produced through triple plasmid transfection of Pro10 cells as previously described. 5 In brief, 2 L cell suspension cultures grown in shaker flasks were cotransfected with one of the pXR3b plasmids, the adenovirus helper plasmid pXX680, 23 and plasmid pTR-lux2A-green fluorescent protein (GFP), which encodes both firefly luciferase and enhanced GFP under control of a CMV promoter, all flanked by AAV2 ITR. Cells were harvested after 72 h, and AAV particles were released through sonication and benzonase treatment. Genome containing particles were then separated through ultracentrifugation into iodixanol gradients, purified through ion exchange chromatography with an AKTA FLPC system, and finally formulated in 1 × Dulbecco's phosphate-buffered saline containing 0.001% Pluronic F68 by overnight dialysis.
Vector genomes titration
Each purified AAV vector, together with positive and negative controls, was extracted in triplicate. In each reaction, 5 μL of sample were treated with 95 μL of DNase I mix containing 52.5 U of DNase I, and incubated for 1 h at 37°C. DNase activity was inactivated by a 10-min incubation at 95°C and by addition of 6 μL of 0.5 M EDTA. Next, samples were treated with 120 μL of proteinase K mix containing 120 μg of Proteinase K to digest the vector capsid protein. The reaction mixture was incubated for 1 h at 55°C, followed by a 10 min inactivation at 95°C. Digested samples were diluted 1/500 in nuclease-free water and analyzed by qPCR using specific primers targeting the AAV2 ITR, in TB Green® Premix Ex Taq™ Tli RNase H Plus (Takara) (Supplementary Table S2).
Vector purity and capsid proteins identity by sodium dodecyl-sulfate polyacrylamide gel electrophoresis
For each AAV preparation, 5 × 10⁹ vector genomes (vg) were heat treated for 5 min at 95°C in Laemmli buffer with β-mercaptoethanol, and loaded onto a 10% Tris-Glycine sodium dodecyl-sulfate polyacrylamide gel electrophoresis (SDS-PAGE) gel (Invitrogen). After electrophoresis, the gel was either silver stained using the Pierce Silver Stain kit (Thermo Scientific), or proteins were transferred onto a nitrocellulose membrane using the Trans-Blot Turbo kit following supplier's recommendations (Bio-Rad). Membranes were probed with the anti-AAV capsid antibody B1 (Progen), then with an antimouse HRP-conjugated antibody, and proteins were detected using Clarity Western ECL (Bio-Rad).
Capsid proteins relative quantification
For each AAV preparation, 5 × 10¹⁰ vg were loaded onto a 10% Tris-Glycine SDS-PAGE gel (Invitrogen). After electrophoresis, the gel was stained with Oriole Fluorescent Gel Stain (Bio-Rad), and the relative quantity of each VP protein was determined based on the band signal intensity using the Image Lab software (Bio-Rad).
Viral particles titer by size exclusion chromatography high-performance liquid chromatography and capillary electrophoresis-SDS analysis
AAV samples were analyzed by size exclusion chromatography using an Agilent Series 1290 II LC system equipped with a Bio SEC-5 column (Agilent). Analysis was performed using an isocratic elution at 0.4 mL/min of mobile phase (3 × phosphate buffered saline, 10% isopropyl alcohol in water), and AAV particles were detected by measuring absorbance at 214 nm. The viral particle titers were determined using a standard curve prepared with an AAV8 vector that was previously titered using an AAV ELISA kit (Progen). Empower software version 3 (Waters) was used for controlling the high-performance liquid chromatography (HPLC) system and processing the data.
For each AAV vector, a total of 3 × 10¹² viral particles, as determined by size exclusion chromatography HPLC, were loaded onto Amicon Ultra 0.5 mL Centrifugal Filters (Merck) in duplicate. The buffer was exchanged to 25 mM Tris pH 9.0 containing 0.001% Pluronic F68, and the samples were concentrated in a final volume of 25 μL. Then, 25 μL of capillary electrophoresis sodium dodecyl-sulfate (CE-SDS) sample buffer, 2 μL of internal standard (ProteinSimple, Bio-Techne), and 2.5 μL of β-mercaptoethanol (Bio-Rad) were added, and the samples were heated at 70°C for 5 min. The denatured samples were loaded onto a Maurice iCE-system (ProteinSimple, Bio-Techne), and after electrophoresis the results were analyzed using the Compass iCE software (ProteinSimple, Bio-Techne).
Transgene expression after cells transduction
HEK293 cells were seeded into EMEM with 10% FBS at a density of 2 × 10⁴ cells per well onto a 96-well plate. The next day, the different AAV3B vectors were added at a multiplicity of 1 × 10⁶ vector genomes per cell in triplicate wells, into 100 μL of EMEM with 2% FBS. After 5 h, 50 μL of EMEM with 26% FBS was added to reach a final serum concentration of 10%, and cells were collected after 72 h incubation. In another experiment, the AAV3B vectors were added to HEK293 cells at a multiplicity of 1 × 10⁶ vg per cell in triplicate wells, into 150 μL of EMEM with 5% FBS containing or not WT adenovirus type 5 (10 infectious particles per cell), then cells were collected after 24 h incubation.
HeLa cells were seeded into DMEM with 10% FBS at a density of 2 × 10⁴ cells per well onto a 96-well plate. Twenty-four hours later, AAV3B vectors were added at a multiplicity of 1 × 10⁶ vg per cell in triplicate wells, into 150 μL of DMEM with 5% FBS containing or not WT adenovirus type 5 (25 infectious particles per cell), then cells were collected after 48 h incubation. After monitoring GFP expression by fluorescent microscopy, cell lysates were prepared using Luciferase Cell Lysis buffer from the Pierce Luciferase Glow Assay kit (Thermo Scientific). Total proteins were quantified using Pierce BCA Protein assay kit (Thermo Scientific), and luciferase activity in the cell lysates was measured using Pierce Luciferase Glow Assay kit in a Synergy HT Multi-Mode plate luminometer (BioTek). Data were analyzed using GraphPad Prism version 9.2.0.
Sample preparation and cryo-EM data collection
Sample and cryogrid optimization were performed using the in-house EM facilities. The AAV3B WT sample (single drop of 4 μL at 9.2 × 10¹² vg/mL) was pipetted onto Cu 300-mesh Quantifoil® R 1.2/1.3 holey-carbon grids and vitrified using a Vitrobot (Mark III—FEI) using the following settings: 2 s of blot time, −2 offset value, after 45 s of incubation. The AAV3B-VP1KO sample at 4.2 × 10¹³ vg/mL, AAV3B-VP2KO sample at 9.4 × 10¹² vg/mL, and AAV3B-VP1VP2KO sample at 3.9 × 10¹³ vg/mL were vitrified using the same procedure.
At least one grid out of the set of six prepared per sample type was preinspected as a “quality-control” step on a JEM-2200FS/CR (JEOL, Ltd.) transmission electron microscope (TEM) equipped with a K2 Summit direct detection camera (GATAN). Then, the remaining grids were cryoshipped for outsourced high-resolution TEM imaging services. All four samples were collected in linear mode on a Glacios equipped with a Falcon III direct electron detector (ThermoFisher).
AAV3B-VP1KO and VP2KO movies were recorded with a nominal defocus range from −1 to −2.5 μm, with a dose of ∼50 e–/Å 2 distributed in 60 frames and at a nominal magnification of × 92,000, producing a final pixel size of 1.56 Å/pix. For the AAV3B-WT and AAV3B-VP1VP2KO samples, movies were recorded with a defocus range from −0.8 to −2 μm, with a 40 e–/Å 2 dose over 40 frames, with a nominal magnification of × 92,000 for WT and × 120,000 for VP1VP2KO, leading to a pixel size at the specimen of 1.56 and 1.20 Å, respectively. About 2,500 movies per sample type were collected (for details, see Supplementary Tables S3 and S4).
Cryo-EM 3D reconstruction of viral particles
Frames alignment was performed using the MotionCorr2 software, 24 while the CTF of the individual movies was estimated using CTFFIND4. 25 Particle picking was carried out in CRYOLO (1.7.6 version) 26 after training the algorithm over 17 background-heterogeneous micrographs. Then, the coordinates were integrated into the RELION 3.1.0 software that was used in all subsequent steps. 27 Autopicked particles for the AAV3B-WT, AAV3B-VP1KO, and AAV3B-VP2KO samples were extracted with a 300 × 300 pixels box size, while for AAV3B-VP1VP2KO a 376 × 376 pixels box size was used (Supplementary Table S4).
An equivalent workflow was followed for each dataset (Supplementary Fig. S1 and Supplementary Table S4). The automatically extracted particles were cleaned through rounds of 2D classifications, then the most homogeneous classes were regrouped and, finally, 2D classified into 30 classes with no application of a mask covering the virion interior. Two selections were made from here, DNA devoid particles (empty capsids) and no-empty ones (filled and partially filled capsids); these subsets were then 3D classified both in C1 (no symmetry applied) and in I1 (icosahedral symmetry applied) into two classes for empty subset, and in three classes for the no-empty subset (1st step in Supplementary Fig. S1); as a starting 3D reference, the EMD-20624 map for the empty AAV3B filtered to 60 Å resolution was used. 28
The members of each output 3D average class with apparent empty, filled, and partially filled capsids were subjected to a further 2D classification into two classes to validate the latter (re)grouping (2nd step in Supplementary Fig. S1). Although by visual inspection the resulting 2D classes in each C1 and I1 case were similar, we continued with the calculation of the average radial profiles of the resulting 2D class averages using the Fiji software 29 only for the C1 processing (as the application of the icosahedral symmetry not masking the internal genome might contribute to particles alignment errors).
These radial profiles (which had been previously scaled to the capsid value and normalized between [0, 1] values) were used for the assessment of their content within the same sample type (3rd step in Supplementary Fig. S1). Based on the radial profiles, the particles were finally regrouped for the 3D refinement; this time in the I1 symmetry and using a spherical mask outside the virion with a 380 Å diameter (4th step in Supplementary Fig. S1).
For comparison of partially filled particles across the different sample types, first the corresponding 3D maps were adjusted to the power spectrum of the lowest resolution map (Supplementary Table S4) and low-pass filtered to 10 Å resolution in RELION, then the average radial density profiles were calculated from the central slice of the individual maps and plotted together as previously (as in Supplementary Fig. S1). The corresponding analysis was performed by excluding a ∼40 Å radius region as the persistence length of a random-sequence ssDNA is ∼20 Å, 30 and the density at the virus center becomes unreliable due to the buildup of noise due to the intersection of the icosahedral symmetry operators.
Broken and double virions were identified and extracted during the sample processing workflow “cleaning 2D classification” (before 1st step in Supplementary Fig. S1). The number of broken ones was higher in the AAV3B-VP2KO sample (0.5% of the total extracted particles). 2D and 3D classifications using C1 symmetry followed by a 3D refinement led to a final map for the broken particle reaching ∼25 Å resolution (1,201 contributing particles). The number of double particles per dataset was also limited (285, 720, and 293 for the AAV3B-WT, AAV3B-VP1KO, and AAV3B-VP2KO, respectively; the double knockout had fewer numbers, preventing their analysis). We combined all double particles (1,298) and after several rounds of 2D and 3D classifications, 701 contributed to a final low-resolution (∼50 Å) density map.
Model building, refinement, and comparison of viral particles
The AAV3B VP1 crystal structure (PDB ID 3KIC) was used as starting model for the refinement. 31 The VP1 model was fitted into the icosahedral asymmetric unit (IAU) of the AAV3B-VP1KO full cryo-EM density map, with minor adjustments to the loops around the icosahedral three-fold axis and nearby the N-terminal end using the program COOT. 32 The refinement was performed in the Phenix software maintaining the secondary structure restrictions along the different cycles until convergence and finalized with a B-factor refinement. 33
Once the IAU (aa. 218–736) was refined, additional rounds were carried out in the context of the neighboring capsomers, with a final run using the default settings and a weight = 5 derived from the previous cycle. Next, the full capsid virion was generated with phenix.pdb.biomt_reconstruct command, and a rigid-body refinement was performed with noncrystallographic symmetry constraints (Supplementary Table S5).
The crosscorrelation (CC) across the different virion cryo-EM densities was estimated in Chimera
34
using normalized maps (adjust_power in RELION and then multiplied by a toroidal mask around the capsid) (Supplementary Table S6). For the estimation of the root-mean-squared-deviation (rmsd) across the corresponding VP1 models, first, the previously refined capsid was fitted within the corresponding IAU densities, and each conveniently refined using Phenix with default settings. The rmsd across the Cαs of all models was estimated in Pymol (
The fitting of the partial atomic model within the density map of the broken particles was performed in Chimera. To infer the stability of viral subassemblies, protomers related by two-, three-, and five-fold icosahedral symmetry axes were extracted from our deposited virion model and submitted to PISA-EBI service (
RESULTS
Biochemical and cellular characterization of AAV3B knockouts
Limited studies on haploid AAV vectors have shown that the tropism and transduction can be altered by mix and matching VP proteins from different serotypes. 17,18 To explore the viability for manipulating the AAV3B serotype, three knockout mutants rAAV3B-VP1KO, rAAV3B-VP2KO, and rAAV3B-VP1VP2KO were constructed (Supplementary Table S1).
To determine whether the different capsid proteins of the knockout viruses were present in the purified virion, and to assess vector purity, equivalent amounts of virus genomes from purified viruses were analyzed by silver-stained SDS-PAGE, and the viral protein expression profile was analyzed by Western blot using monoclonal antibody B1 (Progen), which recognizes the C-terminus of the capsid proteins 35,36 (Fig. 1A). The results demonstrated that all the vector preparations were essentially pure virions, since the only bands appearing in the gels corresponded to the expected VP proteins.

Protein content analysis of the AAV3B vector preparations.
These findings also confirmed that the capsids from the recombinant knockout AAVs, rAAV3B-VP1KO, rAAV3B-VP2KO, and rAAV3B-VP1VP2KO were able to assemble into AAV virions (Supplementary Table S2). This was expected since the AAP was not altered in any of the capsid mutants, 10 and similar mutants for other serotypes missing one capsid protein (VP1 or VP2) have been described earlier. 16,37 Only the membrane-associated accessory protein (MAAP) had two amino acid changes at the C-terminus into both VP2KO (R112L and R117S) and VP1VP2KO (K111N and R117S) sequences, but these changes were not expected to impact particle assembly and genome packaging. 38
Purified viruses were also analyzed by both SDS-PAGE followed by Oriole staining and by CE-SDS for relative protein quantification. Although both methods provided slightly different values, they showed that respective proportions of the three VP proteins were consistently represented in the corresponding recombinant virions at WT levels (Fig. 1B, C). For example, in the case of rAAV3B-VP1KO, the absence of ∼8–10% contribution belonging to VP1 in the WT virion was substituted by an increase of ∼5–8% of VP3 and a ∼2–3% of VP2, whereas in the case of rAAV3B-VP2KO the absence of the ∼17–19% belonging to VP2 in the wild-type (wt) virion now being substituted by an additional ∼14–15% of VP3 and a ∼2–5% of VP1, respectively (Fig. 1B, C).
Of note, there is almost a linear relationship between the compensating VP3 and VP1/2 in both knockout cases, with VP3 always being assembled the most. It is not clear if this observation reflects differential VP expression rates and/or the possible effects of the AAP. 39 However, one cannot ignore the fact that the above observation might also infer the influence of steric effects of the N-terminal domains of VP1 and VP2 in the assembly process. Therefore, it might not be possible to obtain viable rAAV3B-VP3KO particles (or of any other serotype). So, while a stochastic model of AAV assembly has been proposed, 40 the higher expression of VP3, and the presence of ∼22 and 7 kDa additional protein mass at the N-terminal domains of VP1 and VP2, respectively, are likely to structurally influence the ratios of VP1, 2 of 3 incorporation during assembly.
To assess the infectivity of the knockout viruses, HEK293 and HeLa cells were transduced, and GFP expression was analyzed by fluorescence microscopy (Fig. 2A, B, left). Transduction efficiency on both cell lines was monitored by luciferase assay (Fig. 2A, B, right and C). As expected, transduction efficiency of rAAV3B-VP1KO and rAAV3B-VP1VP2KO, measured as transgene expression at 72 h, was practically absent in HEK293 cells, in contrast to that of rAAV3B-VP2KO (Fig. 2A, right).

Transgene expression of AAV3B mutants.
Interestingly, transgene expression with rAAV3B-VP2KO was significantly decreased by ∼10-fold compared with rAAV3B WT capsid, indicating that the presence of both VP1 and VP2 may be needed to obtain fully functional capsids. This was confirmed by transgene expression measured in HeLa cells at 48 h, where only the WT capsid was able to support significant level of transgene expression, while expression with rAAV3B-VP2KO was reduced to background levels.
In the presence of WT Ad5 coinfection, transgene expression was increased, as expected, but expression with the rAAV3B-VP2KO vector was again ∼10-fold lower compared with rAAV3B, and a low but significant expression was detected with rAAV3B-VP1KO (Fig. 2B, right). The latter observation had been reported earlier with rAAV8-VP1KO vector in cells infected at high multiplicity in the presence of Ad5. 41
This might be explained by the ability of adenovirus virions to mediate cointernalization of other molecules, such as plasmid DNA, subsequent release in the cytoplasm through disruption of endocytic vesicles and transport to the nucleus. 42,43 This could also be the case with AAV particles or released AAV genomes. A similar result was obtained in HEK293 cells, where transgene expression measured at 24 h was undetected with rAAV3B-VP1KO in the absence of Ad5, and very low with rAAV3B-VP2KO, while low expression was detected with rAAV3B-VP1KO, and significantly increased with rAAV3B-VP2KO in the presence of Ad5 (Fig. 2C).
These in vitro transduction data support the premise for further engineering of rAAV3B-derived vectors, and provide a structural framework on the roles of the minor structural subunits for both assembly and infectivity.
Cryo-EM reconstruction of AAV3B particles
The structural viability of the recombinant knockout AAV3B particles (and the WT AAV3B used as a control) was determined by cryo-EM technique. Cryo-EM, apart from its democratization in academic laboratories,
44
has been proven a very powerful quality-control tool for gene therapy vectors, and it is widely employed in the field (see Subramanian et al
28
;
Icosahedral and asymmetric reconstruction procedures using the RELION software 45 were employed for the generation of the different particle density maps (Supplementary Tables S3–S4). In the case of icosahedral reconstruction, the resolution of the generated 12 maps ranged between 3.1 and 3.9 Å as judged by the gold-standard Fourier shell correlation (Fig. 3 and Supplementary Figs. S2 and S3). For the two asymmetric 3D reconstructions, the resolution was substantially lower (e.g., ≤25 Å), because of the heterogeneity and limited number of particles contributing to the final 3D map (Supplementary Fig. S3, broken). Nonetheless, these cryo-EM density maps were highly informative of the assembly process, and their presence in the final purified product highlighted some of the challenges in AAV manufacturing.

Structural comparison of 3D reconstructed AAV3B-derived particles.
Structural comparison of DNA full and empty VP deficient and WT AAV3B particles
Structural 2D and 3D classification of all three knockout (and control) samples showed a marked presence of virions with packaged DNA (full capsids) and devoid of DNA (empty capsids). Crosscomparison of the electron densities corresponding to the packaged and unpackaged knockout and wt capsids showed little variance (CC >91%; Fig. 3A and Supplementary Table S6) with minor differences located at the interaction regions with the genome and nearby the VR VIII loop at the icosahedral three-fold axis. The VP1 model of the crystal structure of AAV3B (PDB ID 3KIC) was fitted into and refined against the electron density map of the full AAV3B-VP1KO at 3.1 Å resolution, leading to a high-quality structure (Fig. 3B, Supplementary Table S5).
At the capsid interior of fully packaged capsids near the three-fold axis and within the genome binding pocket, a clear density compatible with an ordered (di)nucleotide is apparent; this is absent in empty capsids (Supplementary Fig. S4), as shown in other cases. 46,47 From the capsid point of view, the packaged and unpackaged AAV3B-VP1KO, AAV3B-VP2KO, AAV3B-VP1VP2KO, and AAV3B virions are practically indistinguishable (rmsd across refined capsids into the different cryo-EM maps <0.3 Å; Supplementary Table S6).
Empty particles do not exceed more than ∼5% of the total number of particles per sample type studied (Supplementary Table S4). In any of the empty virions of AAV3B-VP1KO, AAV3B-VP2KO, and AAV3B, no further density was found below the two-fold icosahedral axes as shown previously for AAV2 serotype by others and attributed to N-terminal domains in VP1 and VP2 (aa. 1-200). 16
Partially filled particles
In AAV manufacturing, the entire pipeline is focused on obtaining AAV preparations with the correctly packaged transgenes within the vector. Thus, the purification process aims at enriching the population of particles completely filled with DNA. Failure of full DNA packaging is an unresolved yet pivotal aspect in AAV production as it can interfere with efficiency of transduction and increase the risks of immunotoxicity. 48 Previous cryo-EM studies with AAV1, AAV2, and AAV3B virions have shown that particles with partially packaged DNA can be identified by this method. 16,28,49
This procedure is far from being standardized, and it is mainly based on calculating the radial density profiles of 2D class averages. Comparison of 2D classes within the same particle type is then performed according to the intensity values of the interior of the virion once all the profiles have been scaled to the capsid intensity values. 28,49 Nevertheless, 2D classification procedures also present limitations (even with modern Bayesian likelihood algorithms), and downstream 3D classification becomes inevitable for a more robust analysis of AAV particle heterogeneity.
In contrast to routine 3D cryo-EM of viruses where the genome is generally masked (so that the alignment is based on most ordered regions), the genome is not masked in the analysis of empty/full AAV particles. To assess whether there were partially filled capsids in knockouts and control AAV3B virions and to compare the degree of “filling” across them, we established and evaluated two workflows where the imposition of icosahedral symmetry or no symmetry, and alternating 2D and 3D classifications were considered in the decision-making process (see Materials and Methods section and Supplementary Fig. S1).
Far from being an exhaustive guide, this exercise highlights some of the difficulties in the identification of this type of particles, which are also essentially identical in their capsid structure. Intra-particle type assessment proceeded by nested and alternate 2D and 3D routines in C1 symmetry. At this stage, we were able to detect the presence of intermediate-packaged particles in the four samples (Supplementary Fig. S1). Then, the particles composing these classes were 3D reconstructed imposing icosahedral symmetry (Fig. 3C). The percentage of particles considered as intermediate varies across the different recombinant virions from ∼11 to ∼21%; however, each of these classes is likely to be degenerate possibly including particles with different degrees of packaged genome (Supplementary Fig. S1 and Supplementary Table S4).
Qualitative estimate of the overall packaging degree was carried out through the comparison of the radial density profiles calculated from the rotational average of the central section of the corresponding 3D reconstructed volumes (Fig. 4). The empty and full particles of AAV3B-VP1KO were used as benchmark for comparison. Excluding the region within about a 40 Å radius of the particle center (see Materials and Methods section) and focusing on the region juxtaposed the internal capsid of the virions within ∼45 and ∼85 Å radii, the presence of the genome bound to the internal capsid appears as a further shoulder to the internal capsid profile (Fig. 4).
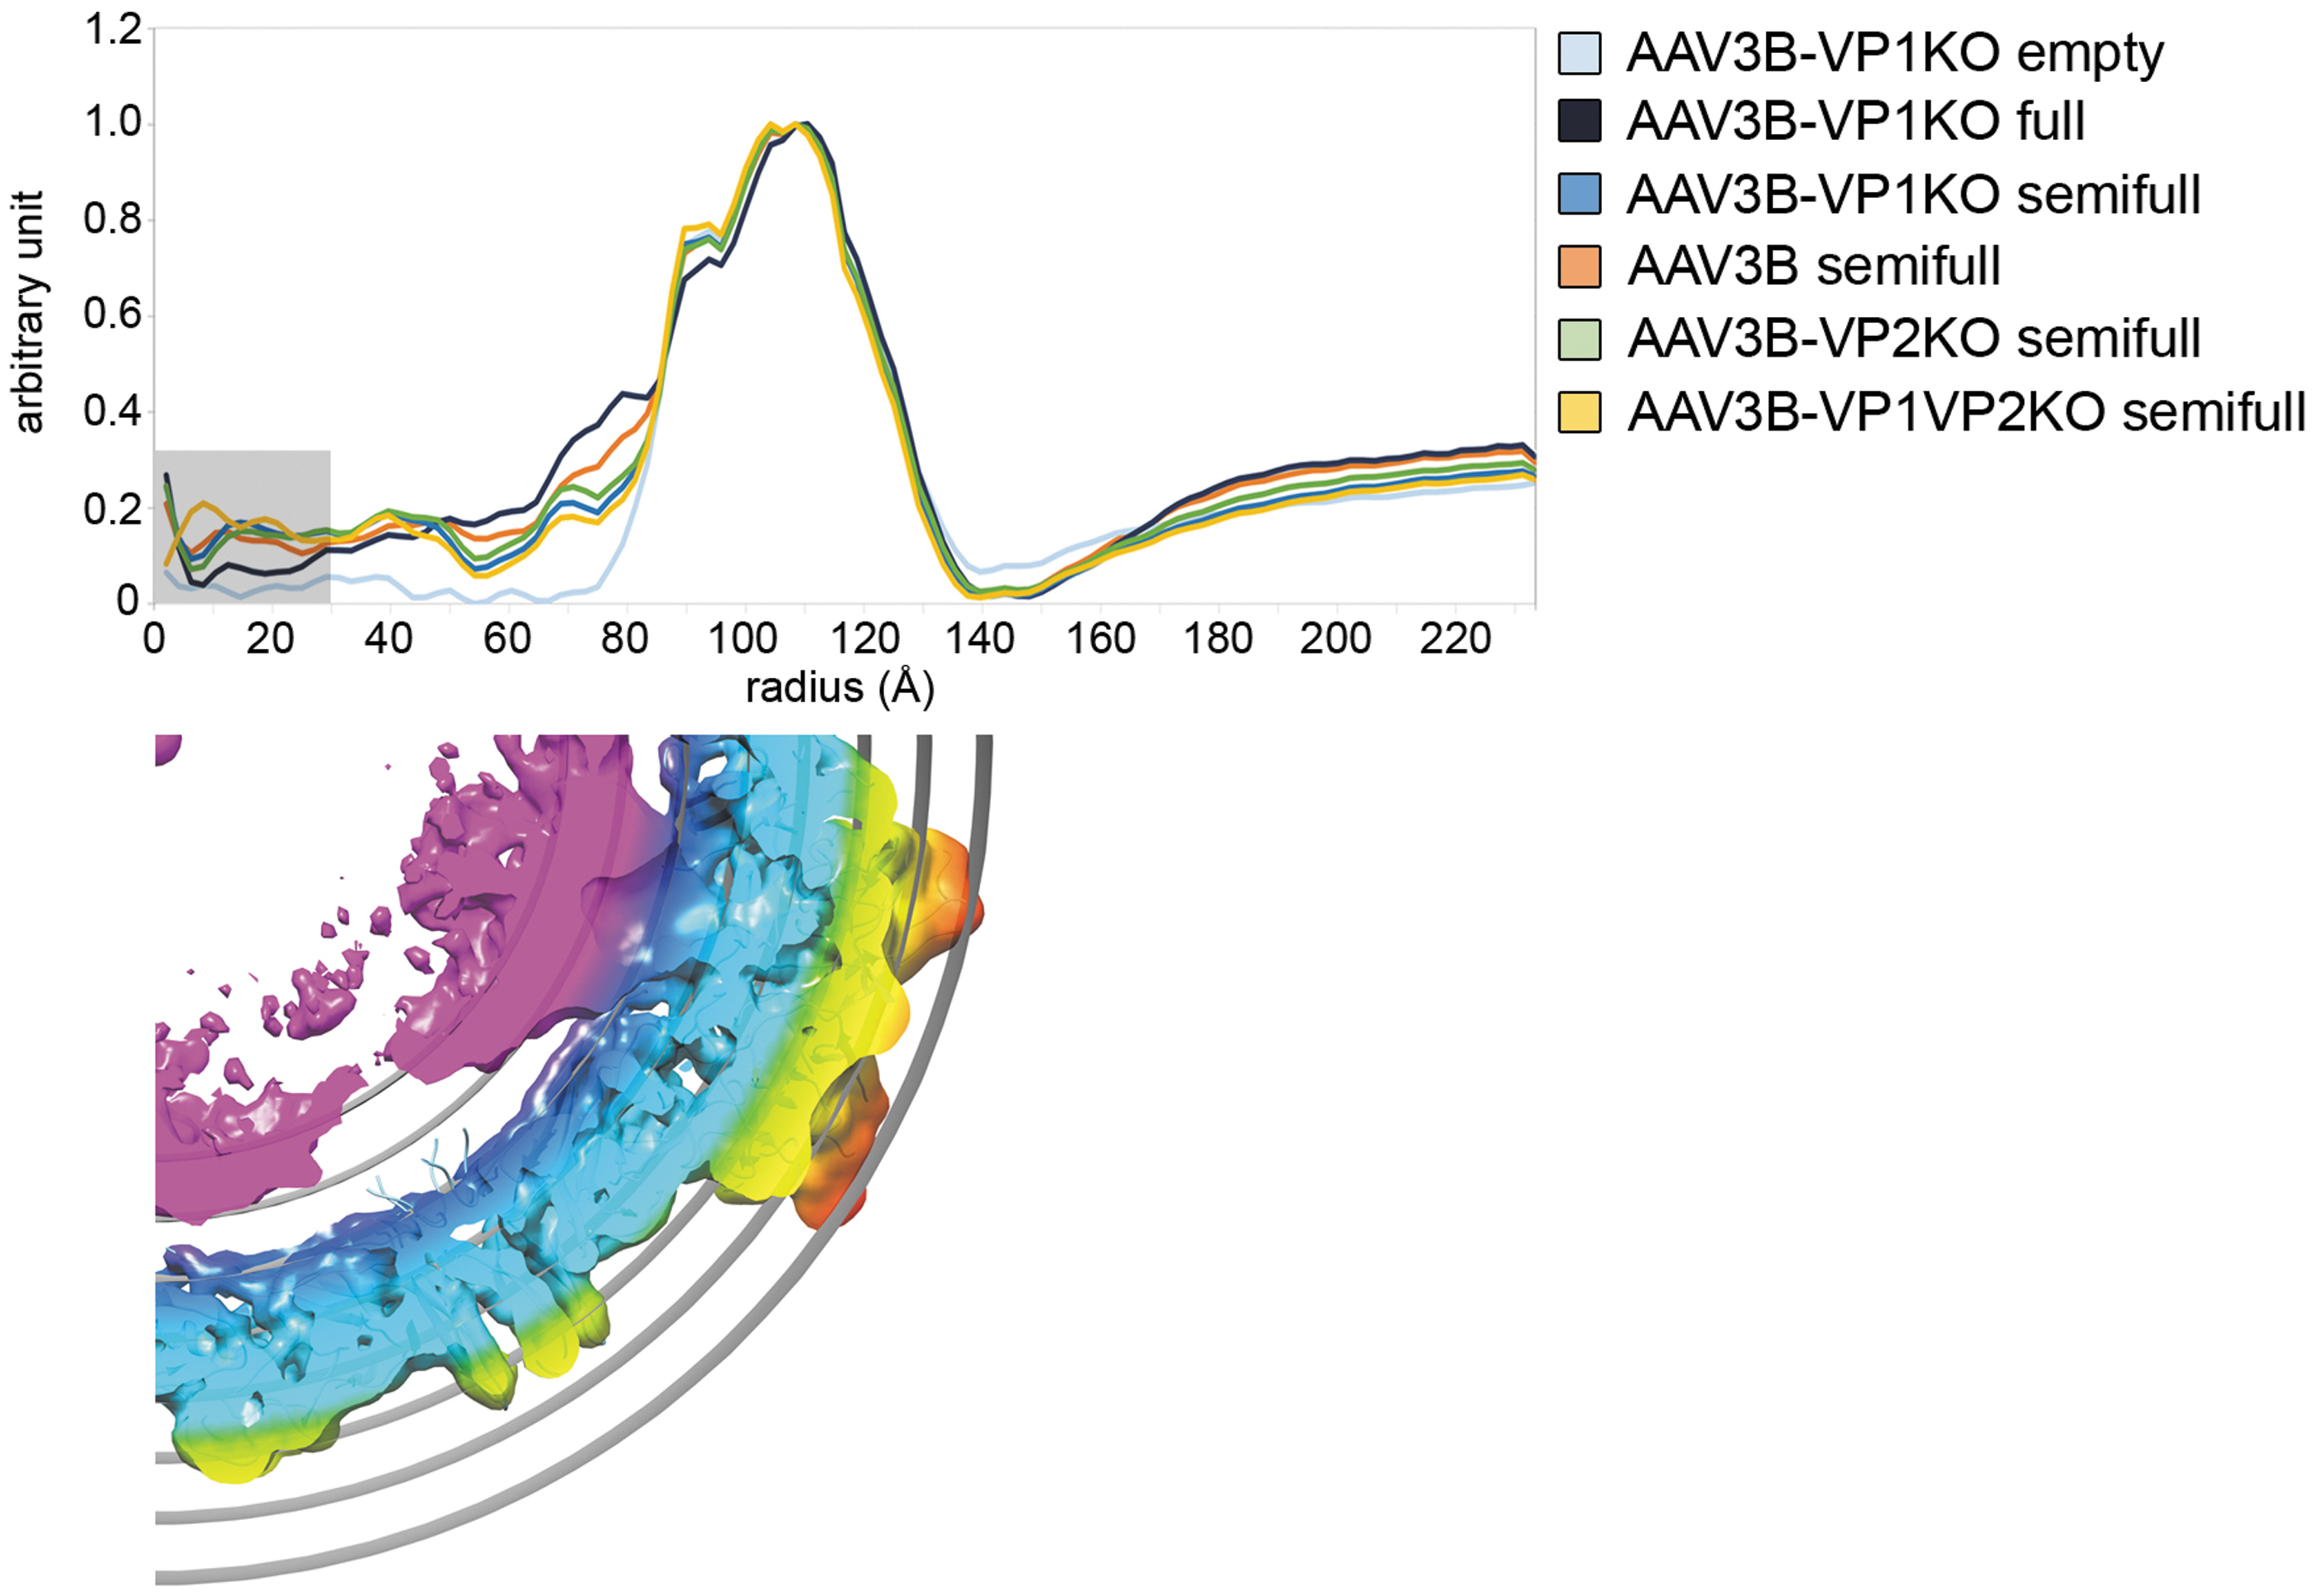
Comparison of the genome region across the partially filled (or semifull) particles. Top, comparison of the average radial density profiles obtained from the central section of the 3D reconstructed electron density maps across the partially packaged sample types (color scheme according to legend); as references: full AAV3B-VP1KO in dark blue and empty AAV3B-VP1KO in light blue. The gray area within the graph is excluded from the overall assessment. Below, central section of the fully packaged 3D isosurface color coded as in Fig. 2A and displayed at threshold 0.026 in Chimera with fitted the atomic model of the capsid; the gray concentric circles mark the distance from the particle center and approximate the features displayed by the radial profile.
Across all intermediate virion groups, the class derived from the AAV3B is, on average, the one with the highest packaged genome, followed by AAV3B-VP2KO, AAV3B-VP1KO, and AAV3B-VP1VP2KO. Whether there is a correlation between capsid integrity—with VP1, VP2, and VP3 present—and proneness to fail genome packaging remains to be seen and caution should prime for further interpretations. Finally, while from the capsid exterior all particles (including empty, full) are practically identical, partially filled capsids also show at their interior, near the three-fold axis, density corresponding to a bound (di)nucleotide (Supplementary Fig. S4) as in the case of full capsids, 47 supporting that these interactions are likely established at early stages of packaging.
Broken particle, abortive assembly, or capsid uncoating?
The availability of a relatively large number of extracted particles also allowed the identification, during 2D classification procedures, of partially assembled procapsid or virions that had undergone capsid uncoating, and misassembled double particles (very occasionally also triple particles) across all sample types (Fig. 5A, Supplementary Fig. S5). In previous studies, broken particles were mainly seen when the AAV sample was heat treated at >55°C. 50

Misassembled rAAV3B-derived particles.
Although in low percentage, 0.1–0.5% out of the extracted particles, the direct visualization of “broken” particles has the following implications: (1) highly purified AAV samples can still contain not intact particles (this may render capsid unexposed regions immunogenic, if administered); (2) AAV particles with missing five contiguous-peripentonal facets represent stable large intermediates as they persist along the different steps of the purification procedure; (3) the genome release mechanism might contemplate a stage of uncoating of the contiguous peripentonal facets.
In the case of AAV3B-WT, VP1KO, and VP2KO we decided to perform a 3D reconstruction of broken and double particles to snapshot the pitfalls of (dis)assembly. Despite the apparent T = 1 simplicity of assembly of Parvoviruses and the proposed assembly through two-, three-, and five-fold interactions 51 —with (any) VP1, VP2, or VP3 coming together to form the icosahedral capsid—our C1 3D density map of the broken particle and fitting of an atomic model indicate the formation of an average stable structure. However, this does not preclude the existence of further smaller subassemblies, possibly also contributing to the 3D map (Fig. 5A and Supplementary Fig. S5).
To infer the significance of the macromolecular interfaces, we analyzed the protein–protein interface of our refined atomic model fitted into the 3D density map corresponding to the AAV3B-VP1KO full particle at the two-, three-, and five-folds using the PISA software. 52 Analysis of the solvation free energy gain upon formation of the interface suggests that the most stable VP oligomers are those formed at the icosahedral five- (−140.2 kcal/M) and three-fold (−114.5 kcal/M), while those at the icosahedral two-fold are the less stable (−2.4 kcal/M), in line with sedimentation experiments 35 (Fig. 5B).
The 3D reconstructed broken particle highlights a possible assembly pathway that proceeds by the likely addition of preformed stable VP trimers joining at the five-fold (ΔiG = −263.9 kcal/M). The possible interaction of these large pentameric structures (five facets, each composed of three trimers) with equivalent oligomers through the two-fold would already originate ¾ of the virion that would be completed by the addition of individual VP trimers as the final pieces of an almost finished jigsaw (Fig. 5B).
We also noted broken particles joined together almost as they were related by a two-fold symmetry with the corresponding 3D reconstruction, demonstrating that the two-fold interface is the one most prone to originate aberrant assemblies (Fig. 5C). Although we describe these observations as steps that would be involved in the potential assembly of the virion capsid, we cannot exclude that the “broken” particles may also be a by-product of disassembly.
DISCUSSION
AAV3B has been less studied than other AAV viral vectors due to its more restricted tropism in mouse models. In addition to the traditional AAV serotypes, ability to generate chimeric AAV capsids by rational design or capsid library approaches, the repertoire has continued to be expanded by generating mosaic virions through haploid capsid proteins. 18,17 Contributing to this endeavor, we generated new biologicals derived by selectively knocking out VP1 and VP2 capsid proteins from the serotype AAV3B. Biochemical analysis of produced particles shows that removal of VP1 or VP2 induces a compensation of the missing VP with an increased proportion of VP3 compared with the respective companion VP2 or VP1 subunit.
A simple explanation for VP3 compensation may be found in the higher expression level of VP3, which is thus the most abundant VP available to assemble in the capsid. However, we cannot completely exclude an influence of the N-terminal domain of VP1 and VP2 in the assembly process, thereby controlling the contribution of each structural subunit.
In contrast, in none of the 3D reconstructed density empty maps for VP1KO, VP2KO and wt, were globular densities underneath the icosahedral two-fold axis detected as previously reported and attributed to the N terminus phospholipase domain using empty AAV2 serotype. 16 Our observation is in line with other 3D cryo-EM maps of empty AAV3B (EMDB-20064), AAV2 (EMDB-8100), AAV2+AAVR (EMDB-9671), and AAV-DJ (EMDB-22854). 28,53 –55 The N-terminal domain of VP1 and VP2 plays pivotal roles in endosomal trafficking and escape, nuclear localization, and genome release. 56
The VP1u structure predicted using the recently available alphafold2 software 57 (Supplementary Fig. S6) suggests that—if folded as previously described 56 —the N-terminal domain would occupy ∼85 × 103 Å 3 . In an empty capsid, a maximum of ∼35 VP1u domains could fit; thus, in a fully packaged AAV the number of N-terminal domains (even completely unfolded) must be limited. While a stochastic assembly model for AAV particles has been recently proposed, 40 viable particles must thus balance a critical number of V1–VP2 copies into the capsid not only to fulfill their functional role but also to avoid steric interference that would lead to misassembly.
Since the VP1 and VP2 presence is not required for correct particle formation (see VP1VP2KO 3D reconstruction), their location into the capsid is plausibly random. Further, there are no studies that unequivocally locate the VP1u domain relative to the capsid geometry when its externalization occurs, although models have been proposed. 56 As demonstrated by classic mutational analysis, these VP1, VP2, or VP1 and 2 deficient AAV particles showed various levels of transduction efficiency with most efficient being AAV3B WT, followed by VP2, VP1, and VP1 and 2 knockout virions.
These data are consistent with the N terminus of VP1 carrying the lipase activity required for endosome escape, followed by the basic region domains previously proved as nuclear location signals essential for AAV infectivity. 58 Surprisingly, we observed a 10-fold drop in AAV3B VP2 knockout virions suggesting a role for this subunit in AAV infection.
The generation of these rAAV3B knockout mutants provides starting reagents ideal for the rational design of polyploid AAV vectors having AAV3B as a parental backbone with the ultimate goal of enhancing transduction efficiency, tissue tropism, and immune evasion ability compared with parental serotypes.
In this effort, here, a plethora of cellular, biochemical, and cryo-EM techniques have provided a comprehensive description of the structure–function properties of these novel structural subunits and their importance for downstream capsid engineering. Importantly, we were able to identify rAAVB particles that were by all criteria described as “broken” virions and/or “misassembled” ones. These types of particles provide unique insight into potential pitfalls that may occur during (dis)assembly and have structurally identified the two-fold icosahedral axis as a putative site of vulnerability for assembly failure.
Cryo-EM emerges as one of the essential techniques in the assessment of the CQAs in AAV gene vector manufacturing. Regarding the partially filled particles that carry incomplete genomes, there exist two issues: (1) how robust is the assessment of their presence (%) in a given AAV manufactured product and (2) the estimation of the degree of packaged genome.
Very recently, it has been shown that charge detection mass spectrometry (CDMS), a specialized mass spectrometry technique, can quantitatively characterize diverse AAV particle populations, including fully genome-packaged particles, empty particles, and partially filled particles.
50,60
However, CDMS is far from being accessible to the wider scientific community, and it remains in the domain of a limited number of researchers although efforts are being made to transit from prototype “home-built” instruments to commercial ones
61,62
(
In conclusion, we have shown that knockout mutants of the AAV3B serotype can be generated serving as novel virion substrates that display specific transduction efficiencies and almost identical structures at the capsid level. All virion types exhibit the presence of full, empty, and partially filled particles as examined and 3D reconstructed by cryo-EM. Cryo-EM density maps of “broken” or “misassembled” particles were also generated providing insight into the virion assembly pathway and pointing at the interactions at the two-fold icosahedral axis as critical intermediates.
Finally, we have established a viable cryo-TEM workflow for qualitatively comparing the genome content within a virion type and across different AAVs, thus enabling the determination of particle DNA content to become an essential therapeutic and regulatory metric required for successful AAV manufacturing.
Footnotes
ACKNOWLEDGMENTS
We thank Donatello Castellana (CIC bioGUNE) for facilitating the administrative aspects of the project. We are grateful to the Viralgen Vector Core production and quality-control teams for supplying the purified AAV preparations ready to use. We also thank the CIC bioGUNE cryo-EM service platform for support in grid quality-control prescreening and the OPIC at the Wellcome Trust Centre for Human Genetics (Oxford, UK) for outsourced EM services. We acknowledge the assistance provided by the IT Service at CIC bioGUNE for facilitating the computational aspects of the 14 cryo-EM 3D reconstructions.
AUTHORs' CONTRIBUTIONS
N.G.A.A., C.T., A.F., and P.M. conceived the project. N.G.A.A. directed the project. A.N., A.E., and A.F. produced biologicals, and performed cellular and biochemical experiments with input from R.J.S.. I.A. performed cryo-EM experiments under the supervision of N.G.A.A. All authors analyzed all data. I.A. and N.G.A.A. wrote the manuscript with contributions from all coauthors.
DATA AVAILABILITY
The cryo-EM maps of the full particle (AAV3B-VP1KO) with the corresponding PDB model and of the broken particle (AAV3B-VP2KO) have been deposited in the Electron Microscopy data bank with codes: EMD-15286, PDB 8A9U, and EMD-15287, respectively. The remaining 12 maps are available upon request from the corresponding authors.
AUTHOR DISCLOSURE
A.N., A.E., C.T., P.M., and A.F. are employees of Viralgen Vector Core S.L. R.J.S. is an employee of the University of North Carolina and a consultant of Asklepios BioPharmaceutical (AskBio).
FUNDING INFORMATION
No funding was received for this article.
SUPPLEMENTARY MATERIAL
Supplementary Figure S1
Supplementary Figure S2
Supplementary Figure S3
Supplementary Figure S4
Supplementary Figure S5
Supplementary Figure S6
Supplementary Table S1
Supplementary Table S2
Supplementary Table S3
Supplementary Table S4
Supplementary Table S5
Supplementary Table S6
References
Supplementary Material
Please find the following supplemental material available below.
For Open Access articles published under a Creative Commons License, all supplemental material carries the same license as the article it is associated with.
For non-Open Access articles published, all supplemental material carries a non-exclusive license, and permission requests for re-use of supplemental material or any part of supplemental material shall be sent directly to the copyright owner as specified in the copyright notice associated with the article.