
Abstract
Optimization of recombinant adeno-associated virus (rAAV) production has important clinical implications, as manufacturing is one of the major challenges for rAAV gene therapy. In this study, we optimized upstream and downstream processing of the rAAV production platform created by an earlier design-of-experiment approach. Our results showed that adding peptones (yeastolate, Trypton N1 or both) increased production yield by 2.8- to 3.4-folds. For downstream processing, a variety of wash buffers for an affinity resin, POROS™ CaptureSelect™ (PCS)-AAVX, were tested for their effects on rAAV8 purity, including NaCl, MgCl2, arginine, Triton X-100, CHAPS, Tween 20, octyl β-
INTRODUCTION
One of the major barriers to clinical applications using recombinant adeno-associated virus (rAAV) is its manufacturing, leading to costly rAAV gene therapies, 1,2 which limits patients' accessibility. 3 While lower doses of rAAV are needed for local administrations such as ocular and intrathecal applications, large production volumes (3–4 × 10⁷ L) are required for treating patients with diseases such as hemophilia, Duchenne Muscular Dystrophy, and sickle-cell disease. 2 Methods to increase rAAV production yields without compromising purity are desperately needed. We optimized rAAV production using design-of-experiment (DOE) methodology that resulted in dramatically increased rAAV production yields in suspension cells. 4
In the study, we showed that AAV5, a serotype well known for its higher production yield than others, had much higher capsid protein expression compared to rAAV1, rAAV2, rAAV8, and rAAV9, implicating that capsid protein expression could be a rate-limiting step for the packaging process and thus, an important factor for high production yield. Therefore, reagents such as sodium butyrate and peptones that increase recombinant protein expression were investigated for their roles in rAAV production. In the same study, we also showed that sodium butyrate increased viral protein (VP) expression of rAAV5, and thus, it was included in the platform. Sodium butyrate, a histone deacetylase inhibitor that maintains histones in their acetylated state, thereby increasing gene accessibility, 5 has been used to increase production yields of recombinant proteins. 6,7 In the production of rAAV in adherent HEK 293 cells with baculovirus infection, sodium butyrate increased the production yield by 1.3-fold. 8
However, Chahal et al reported that expression of the transgene (enhanced green fluorescent protein [EGFP]) in HEK293SF-3F6 cells was increased with increasing concentrations of sodium butyrate or butyric acid, while the number of infectious rAAV was declined. 9 Thus, the effects of sodium butyrate on rAAV production were unclear and require further investigation. Another cell culture additive, peptone, was also used in the DOE-optimized platform. Pham et al screened 16 peptones on recombinant protein production and found that 0.5% Trypton N1 (TN1) resulted in the best outcomes. 10 Hildinger et al showed that the addition of soy peptone the day after transfection increased rAAV production yield by 30%. 11
In this study, we also evaluated another peptone, yeastolate. We previously used peptones in combination with sodium butyrate in the DOE-optimized platform 4 ; however, the effects of peptone, sodium butyrate, or combination of both on rAAV production yield and the vector genome (VG) to capsid particle (CP) ratio need to be evaluated.
The availability of affinity resins such as AVB-Sephrose and POROS™ CaptureSeclect™ (PCS)-AAV8, PCS-AAV9, and PCS-AAVX, has dramatically simplified rAAV purification with high yields, excellent scalability, and high folds of purification in one step from the crude lysate. It has been shown that the purity of purified rAAV9 using PCS-AAV9 was equivalent to that of three successive ion-exchange chromatographies. 12
However, even after extensive washing with phosphate-buffered saline (PBS), there were still significant amounts of protein impurities that were coeluted with rAAV using a low pH buffer (unpublished observation). 13 It was reported that insoluble protein aggregates in the low-pH eluate could be removed by either centrifugation or filtration. 4,13 In contrast, soluble protein impurities in the low-pH eluate could not be removed by either filtration or centrifugation (unpublished observation). 12,13 Therefore, more purification step(s) to remove these protein impurities are required, which typically results in further vector loss. To minimize vector loss from multiple chromatographies, we sought to maximize the benefits offered by rAAV affinity resins through the optimization of washing buffers.
In addition to protein impurities, endotoxins are also one of the most challenging impurities in rAAV downstream processing, 14 like the problems encountered in the purification of recombinant proteins. 15 Endotoxins ubiquitously exist in off-the-shelf reagents, on the surface of labware, and in the instruments used for rAAV production. In addition, TN1 and yeastolate used in our rAAV production platform 4 contain significant amounts of endotoxins.
Endotoxins exist not only in monomer and aggregated forms but also in protein-bound forms through hydrophobic and electrostatic interactions. Protein-bound forms of endotoxins are difficult to remove using ultrafiltration or endotoxin-adsorbent techniques. Moreover, additional step(s) to remove endotoxins during rAAV purification can lead to significant loss of the vector. It was shown that nonionic detergents could dissociate endotoxins from proteins. 16 Recently, Triton X-100 or sodium deoxycholate combined with repeated buffer exchange and concentration using a spin filter was used to remove endotoxins from rAAV. 14 The method could remove endotoxins from small batches of rAAVs, but removing endotoxins in large-scale production settings remains to be challenging.
To improve production yields, while decreasing endotoxin and protein impurities, we optimized both upstream and downstream processing of the platform created by the DOE methodology. 4 The proposed method for rAAV production is simple, resulting in high purity and production yields.
MATERIALS AND METHODS
Chemicals
Octyl β-
Cell culture
HEK 293T suspension cells and their culture were described previously. 4 Cell viability and number of viable cells were determined with Beckman Coulter Vi-Cell Cell Viability Analyzer (Brea, CA).
HEK 293T cell transfection
HEK 293T suspension cells (2.5 × 10⁶/mL) were transfected as previously described. 4 Eighteen hours post-transfection (HPT), peptones (TN1, yeastolate, or combination of TN1 and yeastolate) at final concentration of 0.5%, sodium butyrate (5 mM), or combination of peptone and sodium butyrate were added to the culture, and rAAV from cells and medium was harvested at 65 HPT.
Downstream processing of rAAVs
For 1 L scale production, the culture was precipitated, resuspended in 80 mL of cell lysis buffer, and subjected to freeze and thaw as previously described. 4 After Benzonase treatment, the harvest was diluted to 300 mL with cell lysis buffer (for optimization of rAAV8 purification, the harvest equivalent to 0.45 L of culture was diluted to 100 mL) and the cell debris was removed by two successive centrifugations at 12,000 g for 15 min at 4°C. The supernatant was loaded onto columns packed with the resin PCS-AAVX or PCS-AAV9 (for 0.45 or 0.5 L culture, 10 mL of resin was packed in Cytiva XK 16/20 column; for 1 L culture, 20 mL of resin was packed in XK 26/20 column) using an AKTA Purifier 10 FPLC system equipped with a 10 mm ultraviolet flow cell.
The column was then washed with 15 column volumes (CV) of PBS followed by one of various wash buffers with different additives, including 1 M NaCl, 0.2 M MgCl2, 0.5 M arginine, 100 mM citrate buffer pH 4.0 and pH 5.0, 0.05% Tween-20, 1% Triton X-100, 0.5% CHAPS, and 1–2% OTG. All wash buffers were made in PBS, except 100 mM citrate buffers at pH 4.0 and pH 5.0, which were made in water. The OTG wash (1% or 2% in 10 CV) was routinely used for rAAV purifications. OTG was then washed off by 15 CV of PBS and rAAV was eluted with 50 mM Glycine-HCl (pH 3.0 and pH 2.5 for rAAV5). The eluted rAAV was immediately neutralized with 1/10 volume of 1 M Tris-HCl (pH 8.0).
The peak fractions (defined as absorbance at 280 nm [A280 nm] ≥500 mAU) and shoulder fractions (defined as A280 nm <500 mAU) were pooled separately and dialyzed against PBS-MK buffer (PBS with 1 mM MgCl2 and 2.5 mM KCl, pH8.0) overnight at 4°C using a dialysis cassette (Slide-A-Lyzer, molecular weight cut-off [MWCO] 20 kDa; Thermo Scientific). The dialyzed rAAV was then centrifuged at 4,000 rpm for 10 min to remove insoluble protein aggregates and the supernatant (usually only for the shoulder fractions) was concentrated to a desired volume using 100 kDa MWCO concentrator (Pierce Protein Concentrator PES; ThermoFisher Scientific). The retentates were filtered with 0.8/0.2 μm filters (PALL, Port Washington, NY) after combining with pooled peak fractions. Subsequently, glycerol (final concentration 10%) was added to the rAAV (purified rAAV).
rAAV titer using CyQUANT method
Purified rAAV was routinely tittered using the QuickTiter AAV Quantitation Kit (Cell Bio-Labs) according to the manufacturer's instructions.
Titer of rAAV8-EF1α-EGFP in cleared cell culture
HEK 293T cells (20 mL) were transfected as described above with different additives in the cell culture. At 65 HPT, 1 mL of HEK 293T transfected suspension culture was removed immediately after mixing and subjected to three cycles of freeze and thaw. The samples were centrifuged at 12,000 g for 15 min and the supernatants (cleared cell culture) were used for titration. DNase I digestion was carried out according to manufacturer's recommendations (Roche).
In brief, 15 μL of cleared cell culture was treated with 150 U of DNase I in a total volume of 150 μL at 37°C for 3 h. Then DNase I was inactivated at 75°C for 30 min followed by addition of 3μL of 500 mM EDTA and incubation for 5 min at room temperature. To minimize the degradation of rAAV genome by DNase I, inactivation of DNase I with EDTA before heating rAAV to 75°C is critical (data not shown). Next, protease K (30 μL, >600 mAU/mL; Qiagen) and PBS were added to a final volume of 300 μL and incubated for 2 h at 56°C. The proteinase K was inactivated by heating at 95°C for 30 min. The digested sample was 10-fold serially diluted in polymerase chain reaction (PCR) buffer and tittered using a droplet digital PCR (ddPCR) method with BGHpA primer/probe set according to previously reported methods. 17
Quantification of rAAV8 particles
Number of rAAV8 particles were quantified using an AAV8-titration ELISA kit from PROGEN (Heidelberg, Germany). Reference Standard Stock of rAAV8 (rAAV8-RSS) from ATCC (ATCC® VR-1816) was used as a control.
Quantification of endotoxin
Endotoxin concentrations were determined by using the Endosafe® nexgen-PTS™ and Endosafe® LAL cartridge (5–0.05 EU/mL; Charles River, Wilmington, MA). The samples of both starting material (SM) and purified rAAVs were diluted 10-folds with water before loading to the cartridge.
Sodium dodecyl sulfate–polyacrylamide gel electrophoresis, Coomassie blue staining, and immunoblot
These were performed as described previously. 4
Quantification of rAAV8 protein purity
Protein concentrations of purified rAAV8 with various washing buffers were determined by Pierce™ BCA (bicinchoninic acid) Protein Assay Kit (ThermoFisher Scientific). The same protein amounts of purified rAAVs were analyzed using an Agilent Protein 230 kit. To estimate purity of purified rAAV8, sum of %VP (VP1, VP2, and VP3) in total proteins was calculated.
In vitro transduction
For flow cytometry and microscopic analyses, HEK 293T suspension cells were seeded in six-well plates at the density of 3 × 10⁴ per well with 1 mL medium and transduced at an MOI (multiplicity of infection) of 1 × 10⁵ with rAAV8-EF1α-EGFPs purified either with PBS or 2% OTG wash, as described in Fig. 1A and B. 18 An additional 1 mL of medium was added to each well at 18 h post-transduction. At 48 h post-transduction, cells were detached, fixed with 4% paraformaldehyde, and subject to flow cytometry. Photos of EGFP-positive cells were taken at 48 h post-transduction using Opera Phenix (PerkinElmer, Hopkinton, MA).
Effects of peptones and sodium butyrate on rAAV8 production yields and empty particles.
Statistical analysis
When appropriate, the data were compared between the two groups with Student's t-test. Error bars are shown as mean ± standard deviation from at least two independent experiments.
RESULTS
Optimization of upstream processing
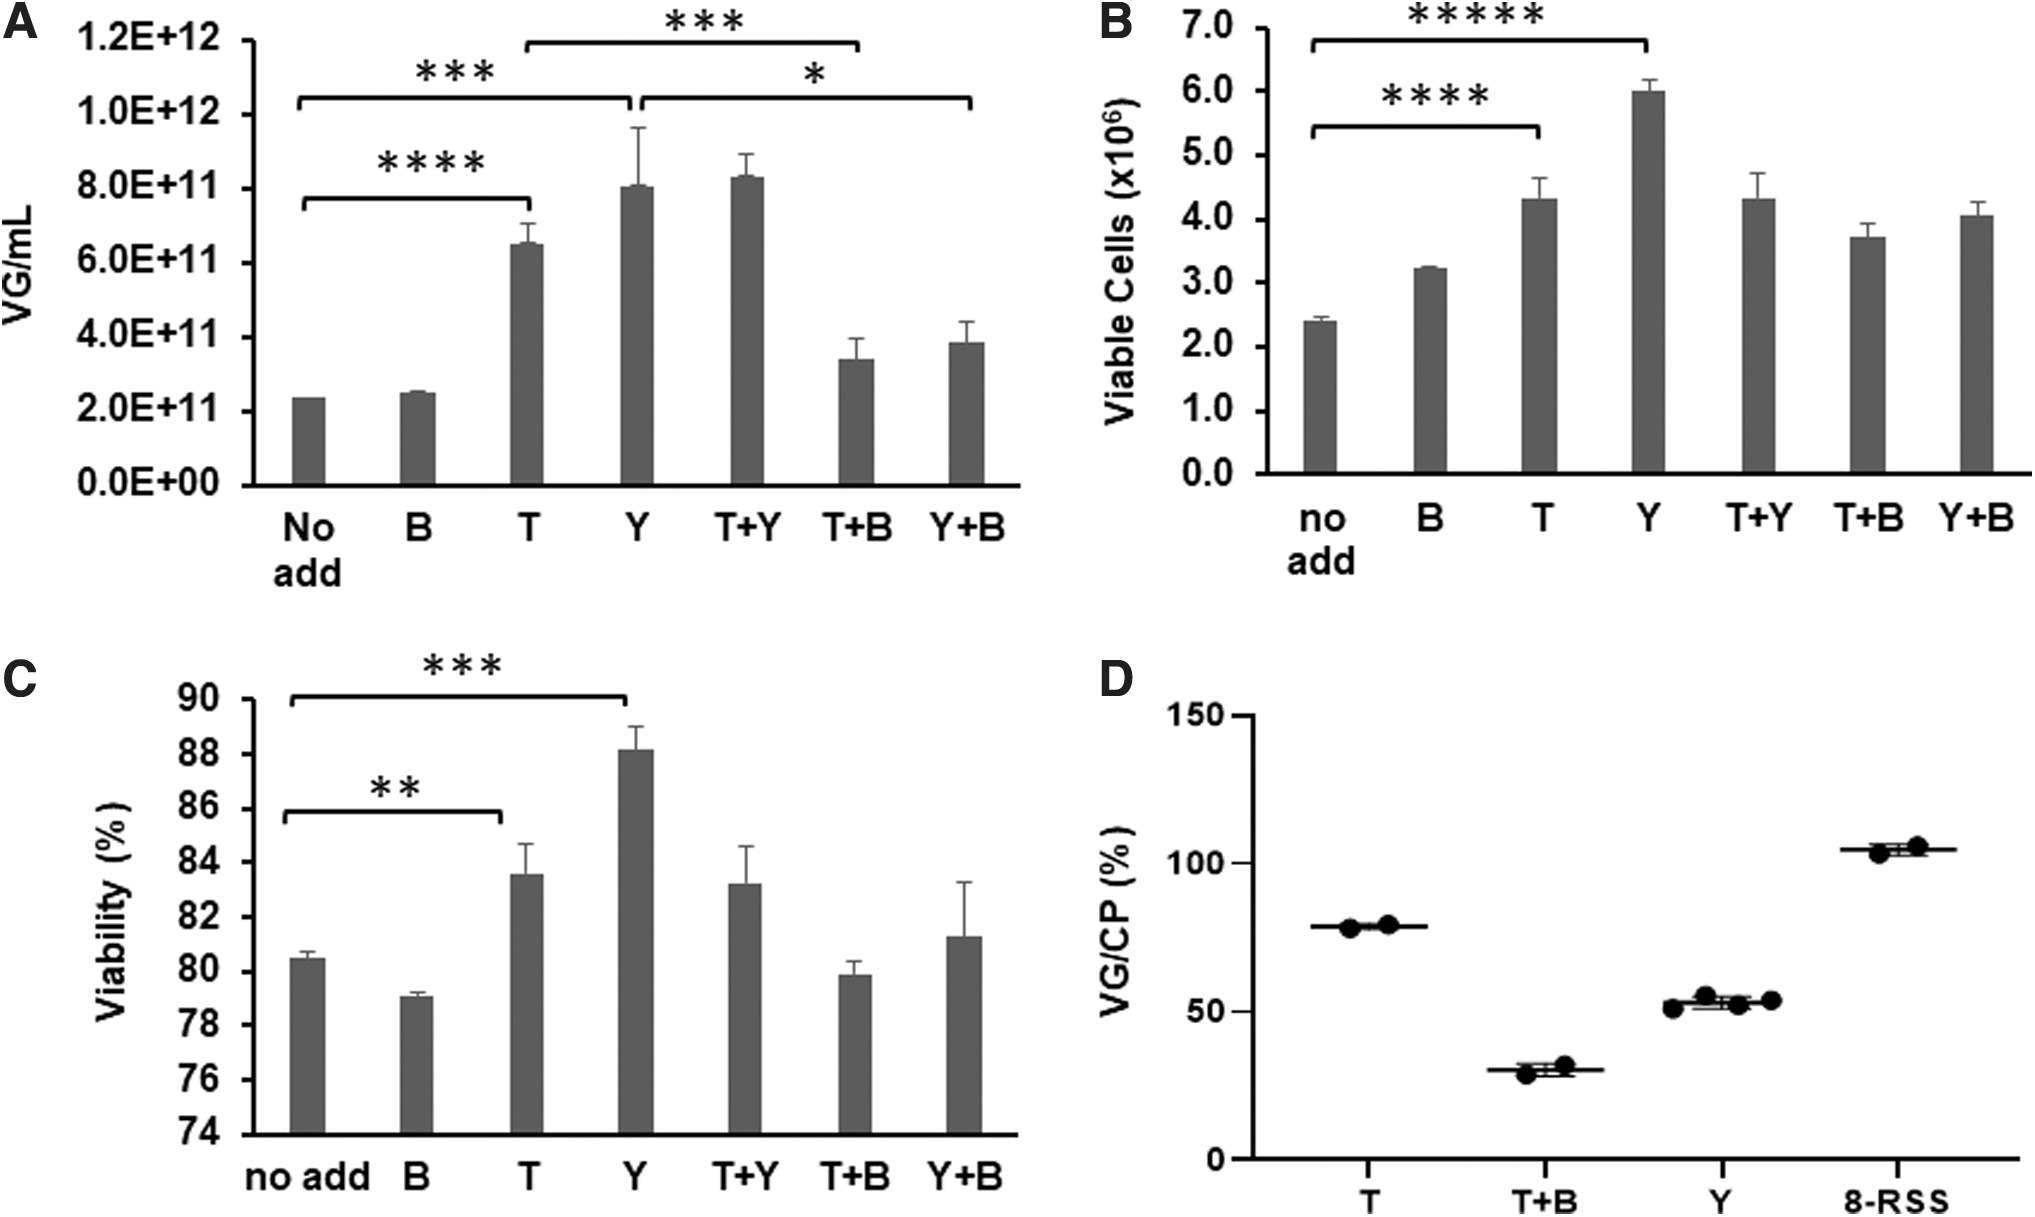
We evaluated the rAAV production yield and its encapsulation efficiency in the presence of sodium butyrate, peptones, or combination of both. As shown in Fig. 1A, the addition of 5 mM sodium butyrate (B) did not increase the yield compared to the control condition (No add). On the other hand, the addition of TN1 (T) and yeastolate (Y) increased yields by 2.8-fold (p < 0.0005) and 3.4-fold (p < 0.005), respectively. Addition of yeastolate yielded slightly higher production yield compared with TN1, although the difference was statistically insignificant (p = 0.184).
The combination of TN1 and yeastolate (T+Y; 0.25% each) resulted in a similar yield to yeastolate only. The improvements by TN1 and yeastolate were diminished when either was combined with sodium butyrate (T+B, p < 0.005; or Y+B, p < 0.05), although combinations still yielded statistically higher compared with the control condition (1.44-fold, p < 0.05 and 1.63-fold, p < 0.05, respectively). To understand underlying mechanism(s), we investigated whether the production yields correlated with viable cell counts and viability. Figure 1B illustrates that the highest number of viable cells with peptones were obtained (Y, T, and T+Y). Also, all additives provided some improvements over the control condition (No add). The same trend, except sodium butyrate, was noted in the viability of HEK 293T cells (Fig. 1C). Again, the addition of yeastolate and TN1 resulted in the highest viability, consistent with the vector yield.
In the previous DOE-optimized platform, 4 the plasmid ratio of pHelper:pRepCap:pAAV was 1:5:0.31 (weight ratio), with approximately a 5.1-fold less of pAAV and a 3.2-fold more of pRepCap compared to the commonly used 2:1:1 ratio. It is plausible that the increased pRepCap and the decreased pAAV likely lead to increased amounts of empty particles. To investigate the effects of sodium butyrate and peptones on the formation of empty particles, we determined the ratio of VG to CP (VG/CP) for the purified rAAV8.
To this end, TN1 was added with and without sodium butyrate, and both CP and VG were determined. As shown in Fig. 1D, the VG/CP was 79% and 30% for TN1 only (T) and combination of sodium butyrate and TN1 (T+B), respectively. Interestingly, a significantly lower VG/CP (53%) was obtained from the yeastolate (Y) group compared to the TN1 (T) group. The fact that sodium butyrate negatively impacted the production yield and the VG/CP ratio prompted us to not include it in the rAAV production platform.
Optimization of downstream processing
Washing step in affinity purification using PCS-AAVX and rAAV8 as a primary serotype was optimized. PCS-AAVX over PCS-AAV8 was selected since PCS-AAV8 was shown to bind more host cell proteins compared to PCS-AAVX, 13 and PCS-AAVX could be applicable to broad natural and engineered rAAVs. To ensure a fair comparison of different washing buffers, a large batch of rAAV8-EF1α-EGFP was generated, aliquoted, and used for screening. The cleared harvest (SM) contained a significant amount of endotoxin (∼1,000 EU per ∼92 mL of SM). After loading SM on the column, different washing buffers were evaluated for their effectiveness in removing protein and endotoxin impurities.
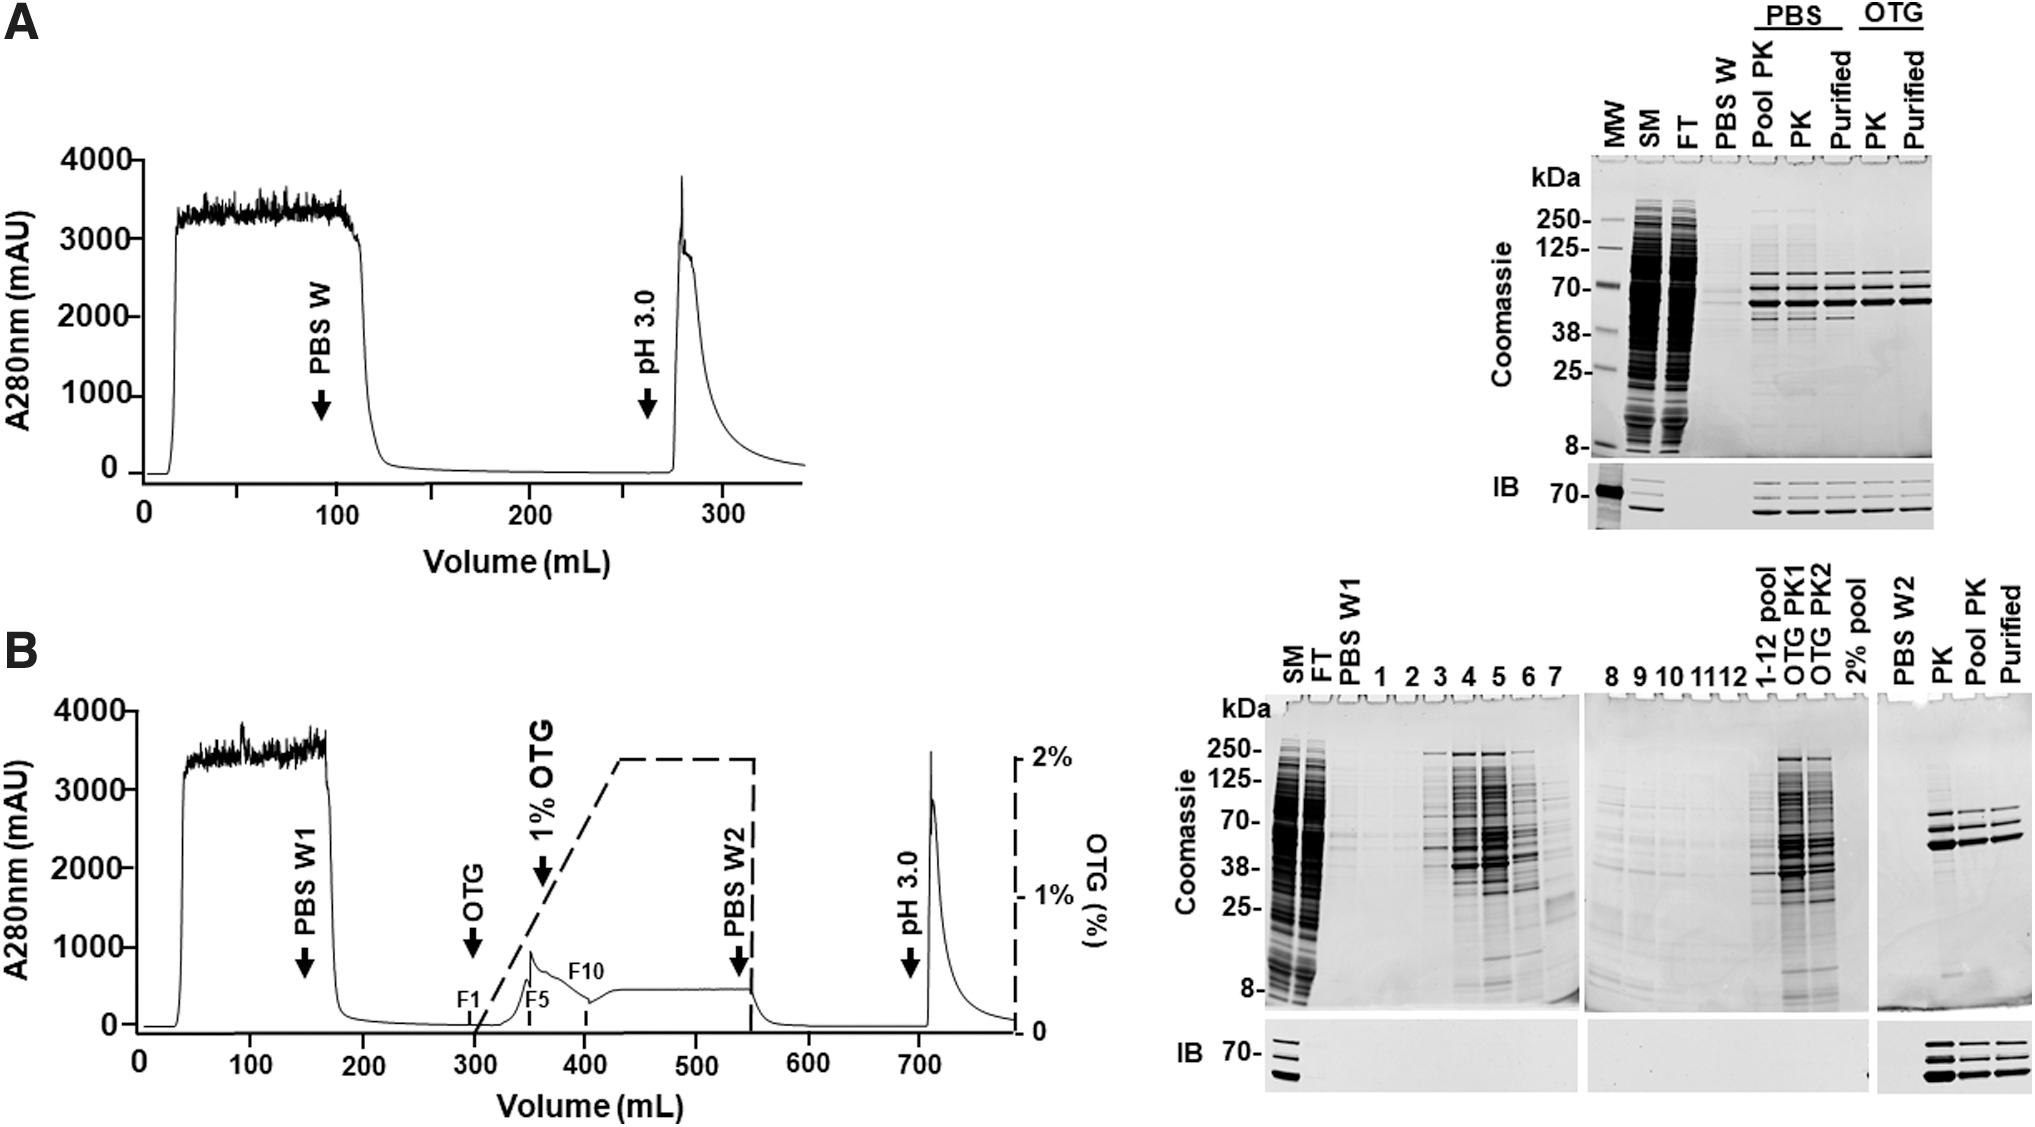
As a control of various wash buffers, rAAV8 was purified using PCS-AAVX and PBS as a wash buffer. After extensive PBS wash, visual cloudiness of the peak fractions of pH 3.0 eluate was observed, and there was a significant amount of protein impurities in the pooled peak fractions (Pool PK, A280 nm ≥500 mAU), peak fraction (PK), and the purified rAAV8 (Purified, Fig. 2). Purified rAAV8 was obtained after centrifugation to remove the insoluble aggregates, which still showed a significant amount of protein impurities, especially a band of ∼52.5 kDa that was evident in the sodium dodecyl sulfate–polyacrylamide gel electrophoresis (SDS-PAGE) analysis (Fig. 2).

Purification of rAAV8 on PCS-AAVX with PBS wash. Harvested rAAV8-EF1α-EGFP (45 mL, equivalent to 0.45 L culture) was treated with Benzonase and diluted to 100 mL with cell lysis buffer. After clarifying by high-speed centrifugation, the rAAV8 was purified with 10 mL of PCS-AAVX resin. Left panel, a typical chromatogram of PBS wash (15 CV). Right panel, the Coomassie blue-stained SDS-PAGE gel (top) and IB using anti-VP antibody (bottom). Arrow indicates 52.5 kDa protein band. FT, flow through; MW, molecular weight markers; PBS W, PBS wash; PK, eluted peak fraction; Pool PK, pooled elute peak fractions (fractions of A280 nm ≥500 mAU); SM, starting material (cleared harvest); Purified, purified rAAV8. A280 nm, absorbance at 280 nm; CV, column volumes; IB, immunoblot; PBS, phosphate-buffered saline; SDS-PAGE, sodium dodecyl sulfate–polyacrylamide gel electrophoresis; VP, viral protein.
In addition, a substantial amount of endotoxin was detected in the purified rAAV8 (Table 1). These results suggested that further optimization of washing conditions was necessary to reduce the impurities of both proteins and endotoxins. Thus, various washing buffers (1 M NaCl, 0.2 M MgCl2, 0.5 M arginine, pH 4.0, pH 5.0, 0.05% Tween-20, 1% Triton X-100, and 0.5% CHAPS) were screened. However, their effectiveness on removing protein and endotoxin impurities was modest, or they resulted in significant rAAV loss. In addition, Triton X-100 was difficult to wash off from the column. Results were described and summarized in Supplementary Information, Supplementary Figs. S1–S5, Table 1 and Fig. 4.
Effects of additives and pH of washing buffers on yield, endotoxin levels and purity of affinity purified rAAV8 using PCS-AAVX
Average of duplicate.
NA, not applicable; NM, not measured; OTG, octyl β-
Among tested, the detergent OTG wash resulted in a highly purified rAAV8 with no detectable endotoxin (<0.5 EU/mL), 97.1% VP purity, and the yield of 92.3% of the PBS wash (Table 1). Specifically, after loading and PBS wash, a 0–2% of OTG gradient in 10 CV followed by a 10 CV of 2% OTG wash was used at the washing step of rAAV8 purification (Fig. 3). A peak of about 350 mAU at 280 nm (peaked at about 0.5% of OTG) was observed during the 0–1% OTG gradient wash. In agreement with this, numerous protein bands in fractions 5 and 6 were observed in the Coomassie blue-stained gel, while only faint protein bands were seen in 1–2% of OTG gradient, indicating that most protein impurities were removed by 0–1% of OTG gradient wash. No VP was detected by immunoblot in all fractions of OTG wash.
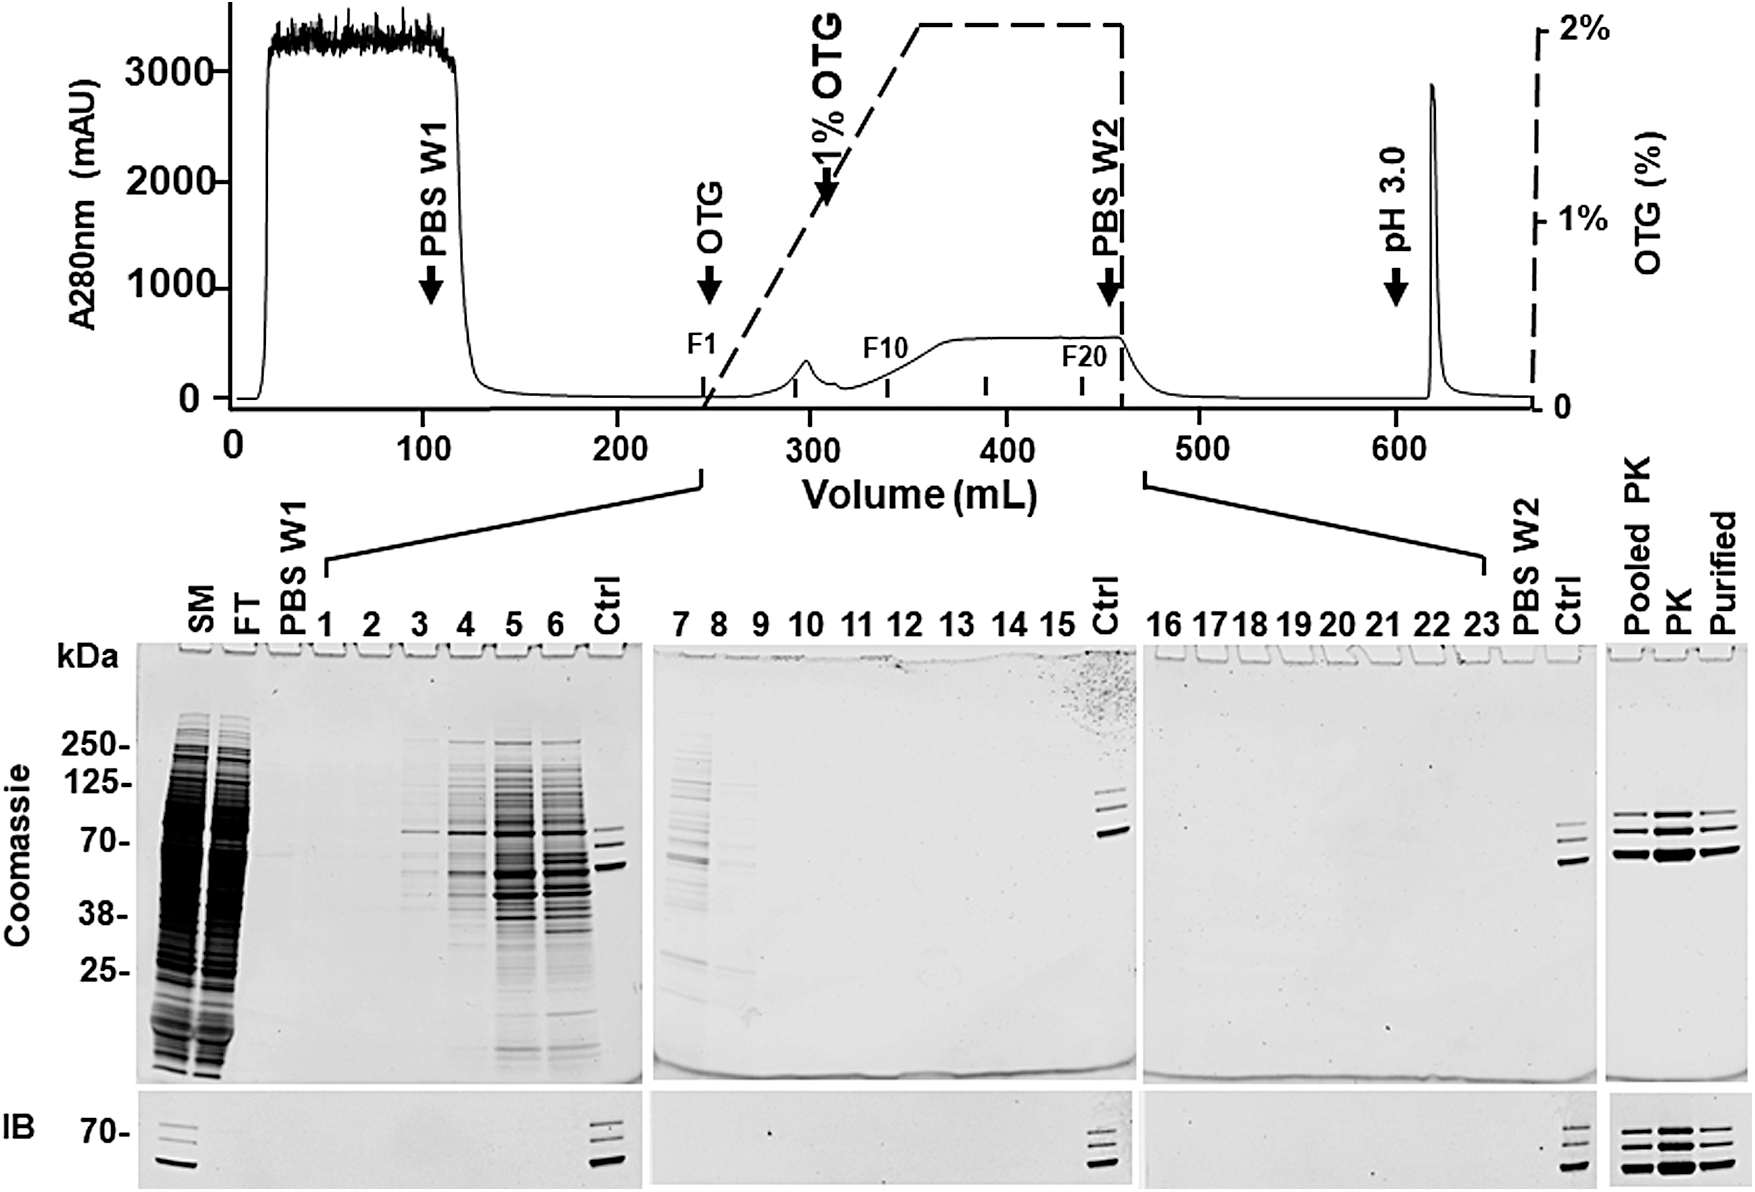
Purification of rAAV8 on PCS-AAVX with OTG wash. The downstream processing is the same as in Fig. 2, but with OTG wash. Top panel, chromatogram. After loading the cleared harvest, the column was washed with (1) 15 CV of PBS (PBS W1); (2) 10 CV of 0–2% OTG gradient; (3) 10 CV of 2% OTG; and (4) 15 CV PBS (PBS W2). The OTG wash is shown by the black dashed line. F1, F10, and F20 indicate the positions of fractions 1, 10, and 20, respectively; Lower panel, the Coomassie blue-stained SDS-PAGE gel (top) and the IB using anti-VP antibody (bottom). 1–12, fractions of 0–2% OTG gradient wash (10 mL/fraction); 12–23, 2% OTG wash (10 mL/fraction). Ctrl: small amount of purified rAAV8 was loaded on each gel to confirm the similar exposure for both the Coomassie blue-stained gels and the IBs. PBS W1, first PBS wash; PBS W2, second PBS wash after OTG wash. Other abbreviations are the same as in Fig. 2. OTG, octyl β-
In addition, the eluate was clear or much less cloudy compared to PBS wash (data not shown). Highly purified rAAV8 was obtained in the pooled peak fractions (Pooled PK), the peak fraction (PK), and purified rAAV8 (Purified) as shown by Coomassie blue-stained gel (Fig. 3). Moreover, the endotoxin was undetectable (<0.5 EU/mL) in the purified rAAV8 (Table 1). Removal of OTG can be monitored by A280 nm during the successive PBS wash. Our results showed that a baseline was achieved by 15 CV of the PBS wash. In addition, since OTG has a high critical micelle concentration (9 mM), it can be further reduced by a buffer exchange (dialysis) step.
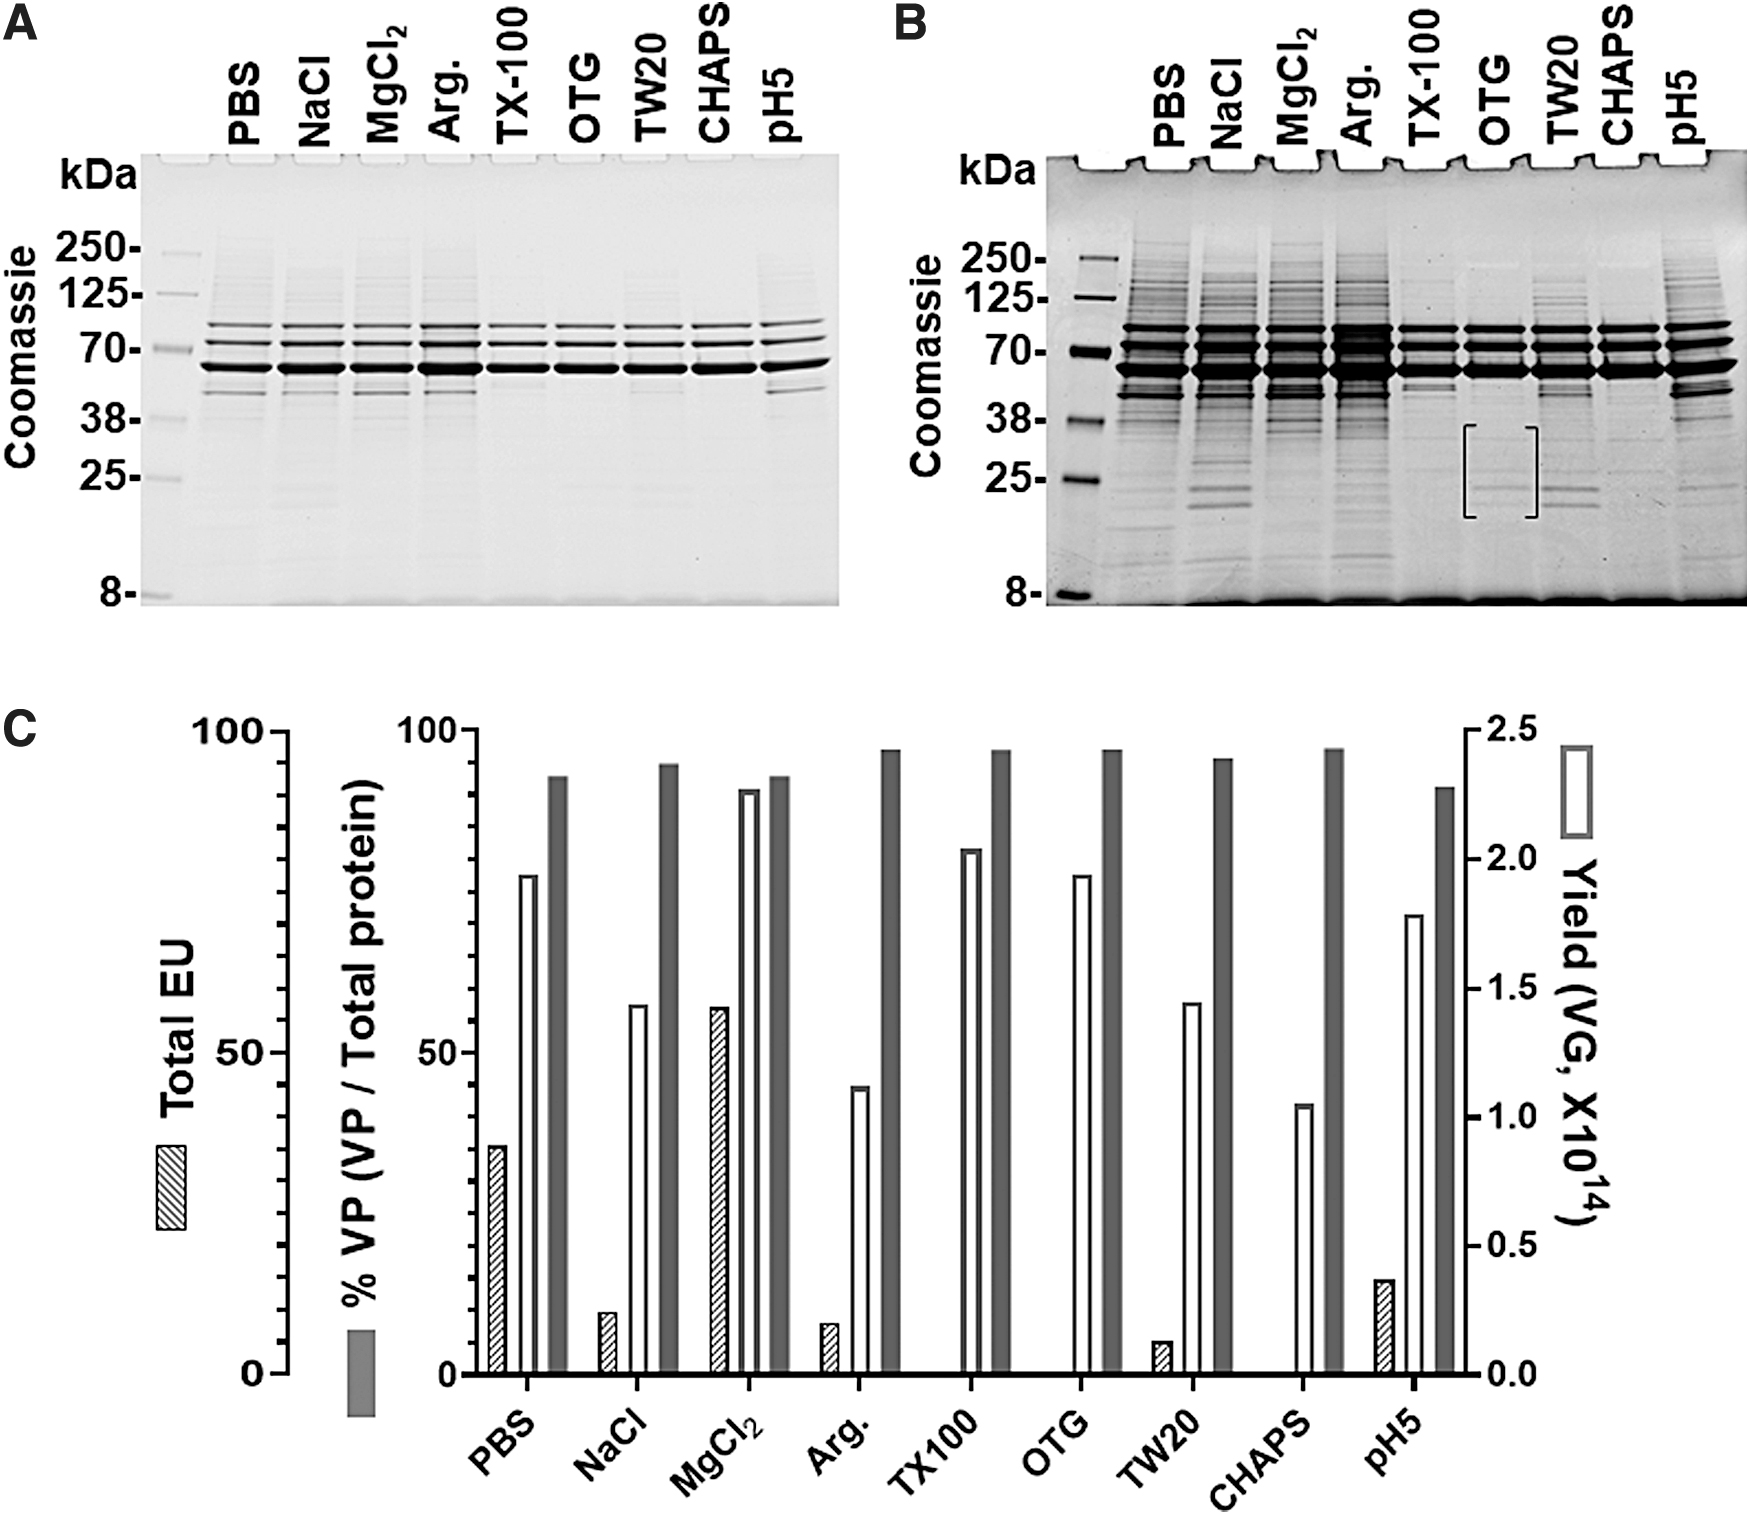
The protein impurities of the rAAV8 purified using different wash buffers were compared using SDS-PAGE by loading the same VGs (5 × 10¹⁰ VGs/lane) and staining with Coomassie blue. The results demonstrated that purer rAAV8s were obtained from detergent washes, especially OTG and CHAPS washes. The band at ∼52.5 kDa along with numerous other protein bands were not seen in detergent-washed rAAV8s, but were evident in the rAAV8s from other washing methods (Fig. 4A). However, a longer exposure of the gel visualized very low level of several protein impurities in the purified rAAV8 by the OTG wash, as indicated by parentheses in Fig. 4B. Also, protein bands below VP3 were observed in Triton X-100 wash after a longer exposure.
Comparison of purity, yields, and endotoxin levels of rAAV8 using various wash reagents.
To assess the purity of purified rAAV8, the same amounts of protein were analyzed using Agilent Protein 230 Assay followed by calculating percentage of VPs (VP1, VP2, and VP3) in total proteins. The effects of different wash buffers on purity, endotoxin levels, and yield conducted on rAAV8 are summarized in Fig. 4C and Table 1. The percentage of VPs to total protein is >90% for all conditions with 97.1% and 97.0% for OTG and Triton X-100 washes, respectively (Table 1). The graph illustrates the superiority of OTG and Triton X-100 for high purity and yield, along with their undetectable level of endotoxins (<0.5 EU/mL). However, we subsequently focused on the OTG wash because removing Triton X-100 from the rAAV preparation was challenging (Supplementary Information and Supplementary Fig. S5), and there were protein bands below VP3 after a long exposure (Fig. 4B).
Subsequently, we modified DOE-optimized protocol by incorporating either TN1 or yeastolate without sodium butyrate, produced 1L of rAAV-EF1α-EGFP and purified with an OTG wash. Combined with the optimization of other downstream processing such as eliminating the pH 5.5 precipitation from the previous method 4 (see Materials and Methods section), the postpurification yields were 5.5 × 10¹⁴ and 6.0 × 10¹⁴ VGs/L with TN1 and yeastolate, respectively. Thus, the advantages noted earlier were confirmed as the production volume increased.
OTG wash was applied to the purification of multiple rAAV serotypes
After successful application of the OTG wash to rAAV8 purification, we sought to apply it to rAAV5 purification using PCS-AAVX. To this end, rAAV5-EF1α-EGFP was purified with 0–2% OTG gradient wash using PBS wash as a control. In the PBS wash, multiple protein bands were observed in the pooled peak fraction (Pool PK), peak fraction (PK), and purified rAAV5 (Purified), especially the 52.5 kDa band (Fig. 5A).
Comparison of the purity of rAAV5 purified on PCS-AAVX with PBS or OTG wash. Recombinant AAV5-EF1α-EGFP (1 L) was generated as described in Materials and Methods section. The cleared harvest was divided into two equal volumes and purified using PCS-AAVX with PBS or OTG washes.
For the OTG wash, the 0–2% of OTG gradient similar to rAAV8 purification (Fig. 3) was used. As shown in the Coomassie blue-stained gel, many protein impurities were removed by OTG wash from the column, especially before 1% of OTG (Fig. 5B), and highly purified rAAV5 was obtained. No VP was found in the fractions of OTG wash as shown by immunoblot and the yield of OTG wash (2.34 × 10¹⁴ VGs/0.5 L) was 90.8% of the PBS wash (2.58 × 10¹⁴ VGs/0.5 L). We also observed that the elution peak has much longer tail compared to rAAV8, suggesting that rAAV5 binds to PCS-AAVX tighter compared with rAAV8 (Fig. 5A, B). Thus, a pH 2.5 elution was applied following the pH 3.0 elution in purification with the PBS wash.
A peak with about 2,000 mAU was eluted by pH 2.5 buffer (data not shown) and the eluate was concentrated and tittered, which contained 21.3% of the rAAV5 eluted by pH 3.0, indicating that the pH 2.5 elution was more effective for eluting rAAV5 from PCS-AAVX. In fact, a 1 L scale production with OTG wash and pH 2.5 elution showed that the yield of rAAV5-EF1α-EGFP can reach 7.56 × 10¹⁴ VGs/L with high purity (Supplementary Fig. S6). Surprisingly, the endotoxin level was <0.5 EU/mL in the purified rAAV5 with both PBS and OTG washes, which could be partially due to the low endotoxin level in the SM (2.87 EU/mL, compared to 11 EU/mL for SM of rAAV8).
rAAV9 is another widely used serotype. Thus, several washing additives were tried for rAAV9 purification using PCS-AAVX. Initially, Tween 20 wash was attempted, but it washed off the rAAV9 as well as the endotoxins. Results with the 2% OTG wash not only efficiently reduced endotoxin to the undetectable level (<0.5 EU/mL) but also greatly improved the purity compared to both PBS and Tween 20 washes. However, VPs were detected in the OTG wash by immunoblot and, consistent with this, the yield was 58.4% compared to PBS wash (data not shown). These results suggested that binding of rAAV9 to PCS-AAVX is weaker than rAAV8.
Thus, the procedure was repeated using PCS-AAV9. The yield of the OTG wash (1.09 × 10¹⁴ VGs/0.5 L) was improved to 77.8% (1.41 × 10¹⁴ VGs/0.5 L). Higher purity was obtained using OTG wash compared to PBS wash, which showed a few weak protein bands below VP3 (Fig. 6A), while they were not present in the purified rAAV9 using OTG wash (Fig. 6A, B). There was no VP detected in the fractions of OTG wash by immunoblot (Fig. 6B). In addition, the endotoxin was undetectable (<0.5 EU/mL) in the purified rAAV9 using both PBS and OTG washes. Again, this may be partially attributed to the lower endotoxin in the SM of rAAV9 (2.98 EU/mL, compared to 11 EU/mL in the SM of rAAV8).
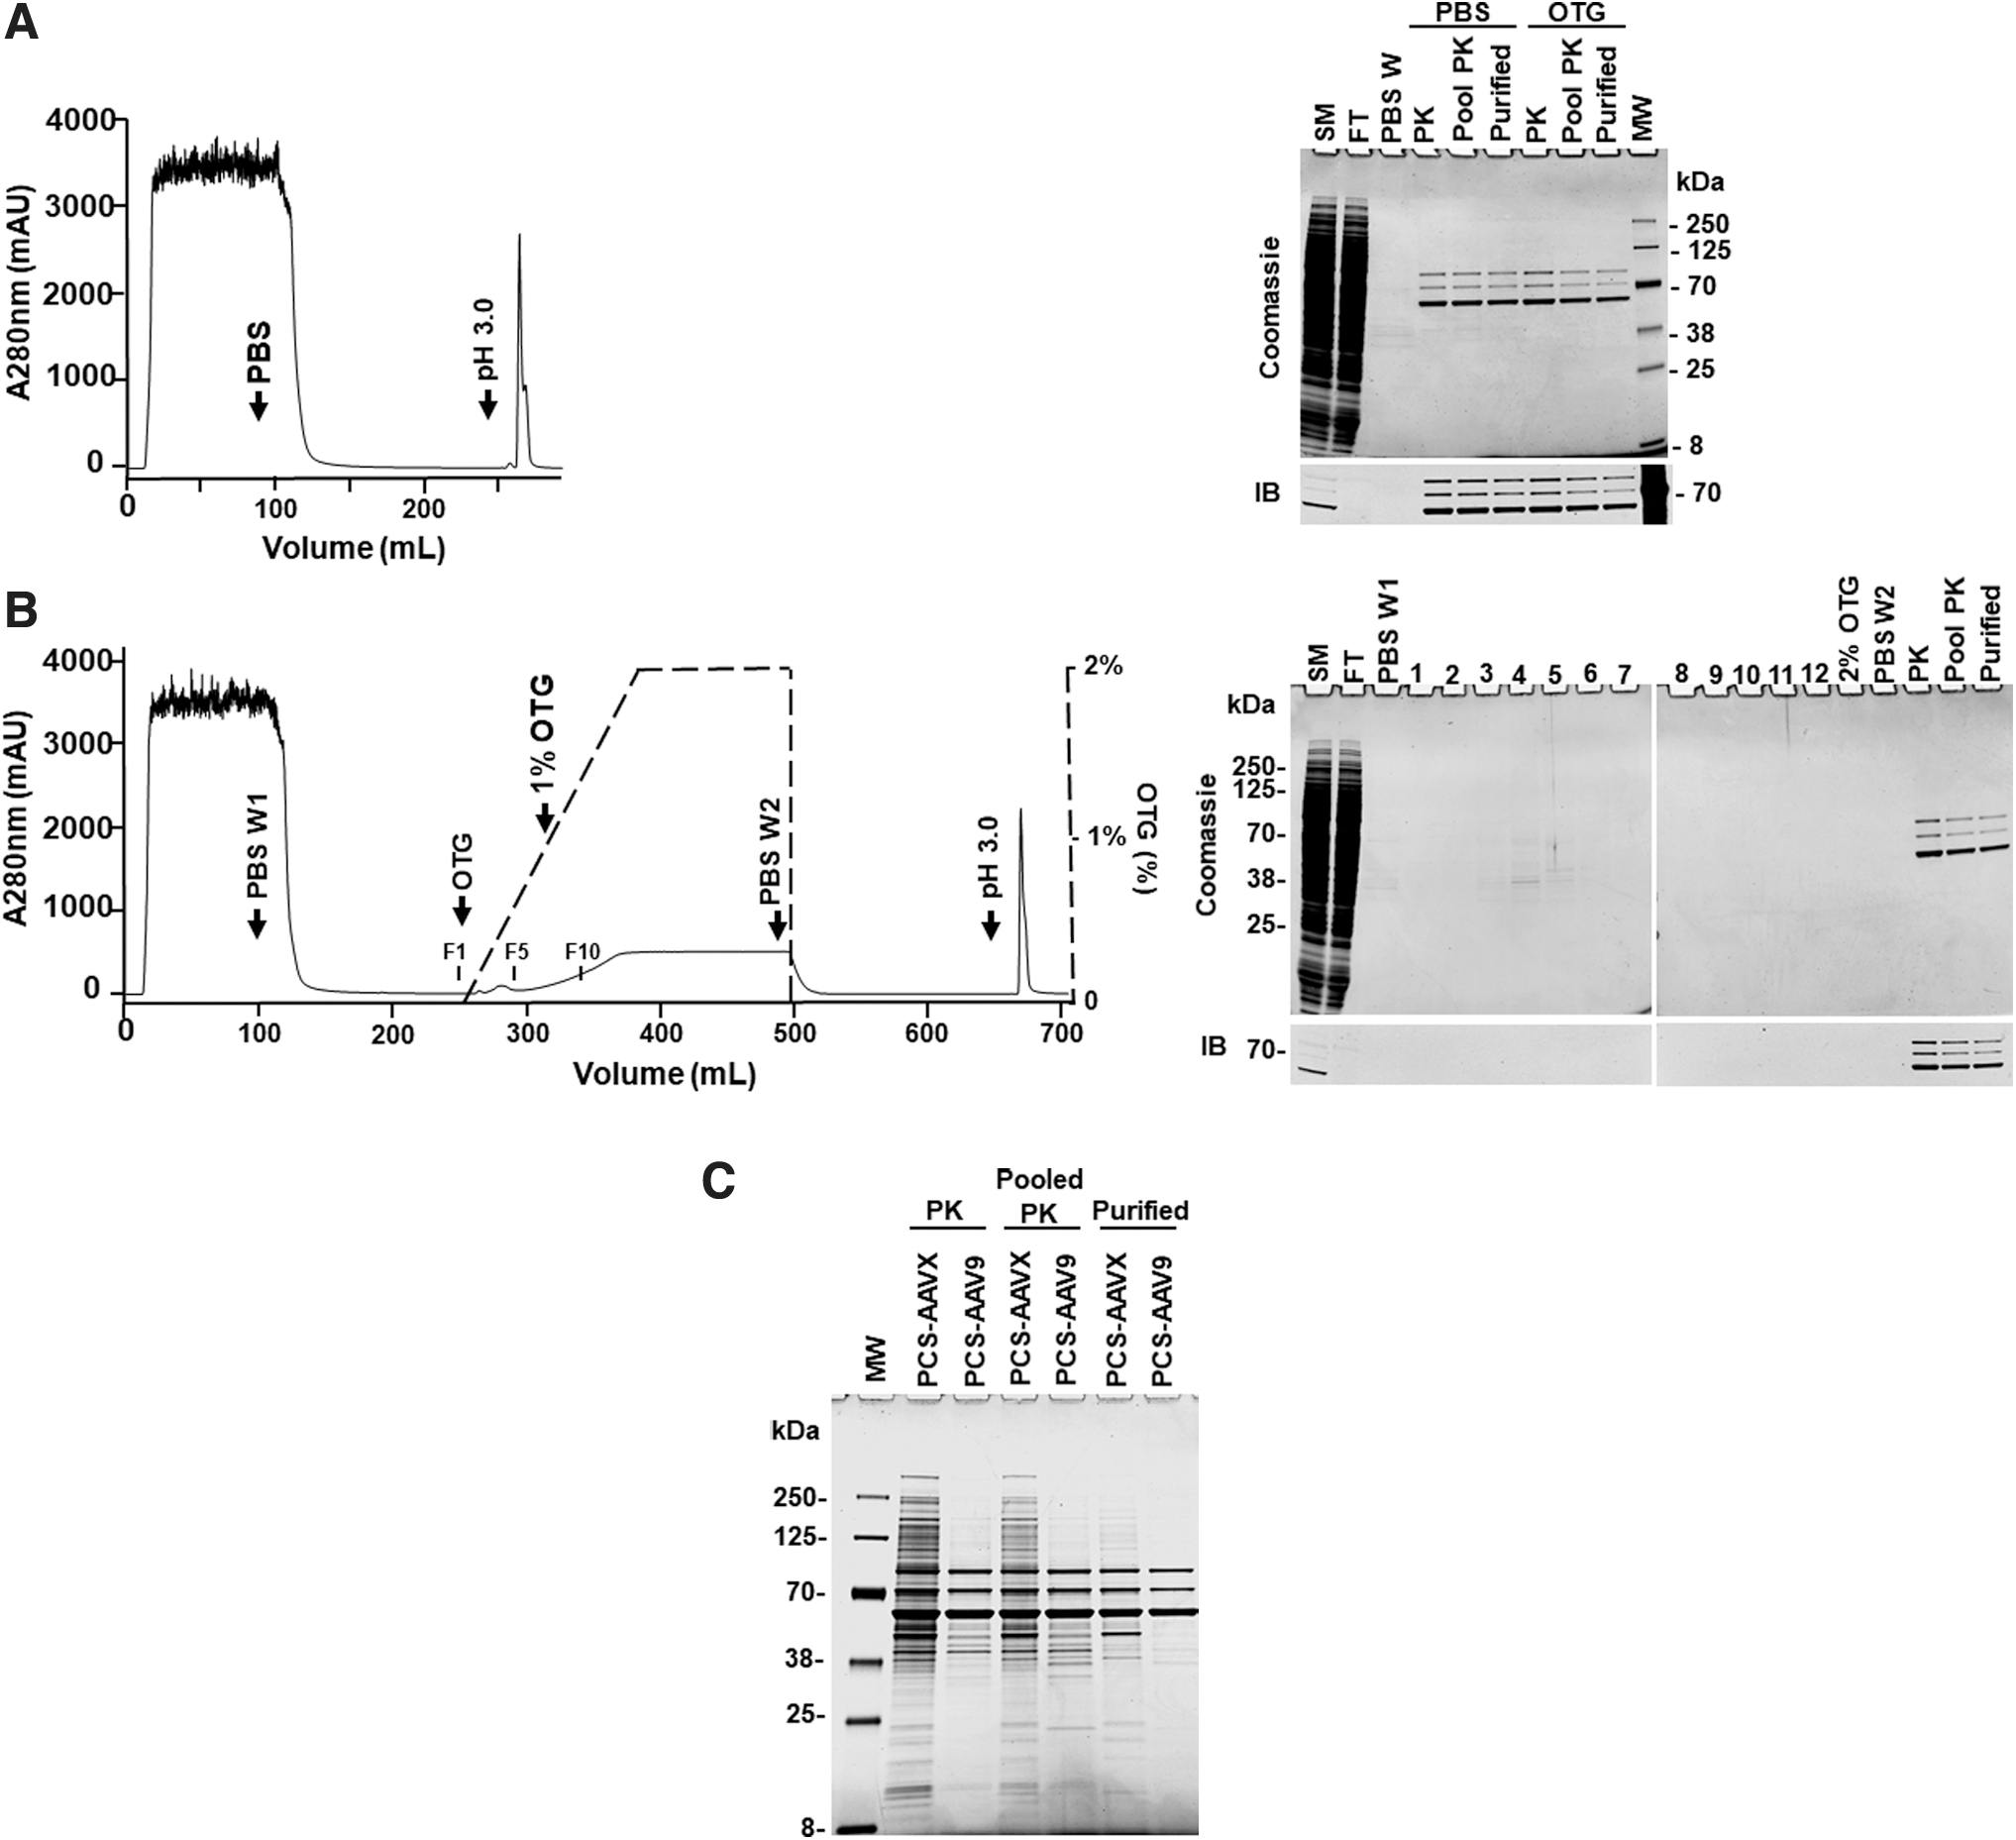
Comparison of the purity of rAAV9 on PCS-AAV9 with PBS or 2% OTG wash. Recombinant AAV9-EF1α-EGFP (1 L) was generated as described in Materials and Methods section. Cleared harvest of rAAV9-EF1α-EGFP (1 L) was divided into two equal volumes for either PBS or OTG wash as described in Fig. 3.
These results suggest that PCS-AAV9 combined with the OTG wash is optimal for rAAV9 purification. In addition, we took advantage of the fact that rAAV9 can be purified with either PCS-AAVX or PCS-AAV9 to compare the binding of protein impurities to the ligands of the resins when using a PBS wash. Our results showed that much higher purity of rAAV9 using PCS-AAV9 compared to PCS-AAVX was obtained (Fig. 6C), indicating that less protein impurities bound to the ligand of PCS-AAV9 than those bound to the ligand of PCS-AAVX. This observation emphasizes the importance of ligand's selectivity on rAAV purity.
Since most protein impurities in the purification of rAAV8 and rAAV5 were washed off when 0–1% OTG gradient was applied, the 1% OTG wash was applied to rAAV1 and rAAV2 purifications using PCS-AAVX. The results showed no detectable endotoxin (<0.5 EU/mL) in purified rAAV1 and rAAV2, although the endotoxin level was high in the SMs (rAAV1, 14.7 EU/mL: rAAV2, 6.19 EU/mL). Highly purified rAAV1 was obtained (Supplementary Fig. S7A), while there was a faint protein band at 10 kDa, which could still be seen on the Coomassie blue-stained gel of rAAV2, indicating 1% OTG was not strong enough to remove all the protein impurities from rAAV2 (Supplementary Fig. S7B).
Although only representative results were shown in this study, we have successfully produced and purified many natural and engineered rAAVs (rAAV-DJ/8) using OTG wash method, which resulted in highly purified rAAVs with low endotoxin level, demonstrating that the OTG wash method is reproducible and has broad applications to many serotypes.
Effects of OTG wash on transduction efficiency
To investigate possible effects of OTG on rAAV8 infectivity, we evaluated rAAV8-EF1α-EGFP exposed to OTG or PBS wash on the transduction efficiency of HEK 293T cells. At 48 h post-transduction, the percentage of GFP-positive cells and geometric mean (GEO mean) were determined by flow cytometry. The average transduction efficiency of rAAV8 exposed to OTG wash was 23.5%, comparable to the PBS wash (26.0%, p = 0.0513, n = 3; Fig. 7A). No difference in GEO mean was observed (Fig. 7B). Representative images of GFP-positive cells transduced with rAAV8-EF1α-EGFP using PBS or OTG washes are shown in Fig. 7C.
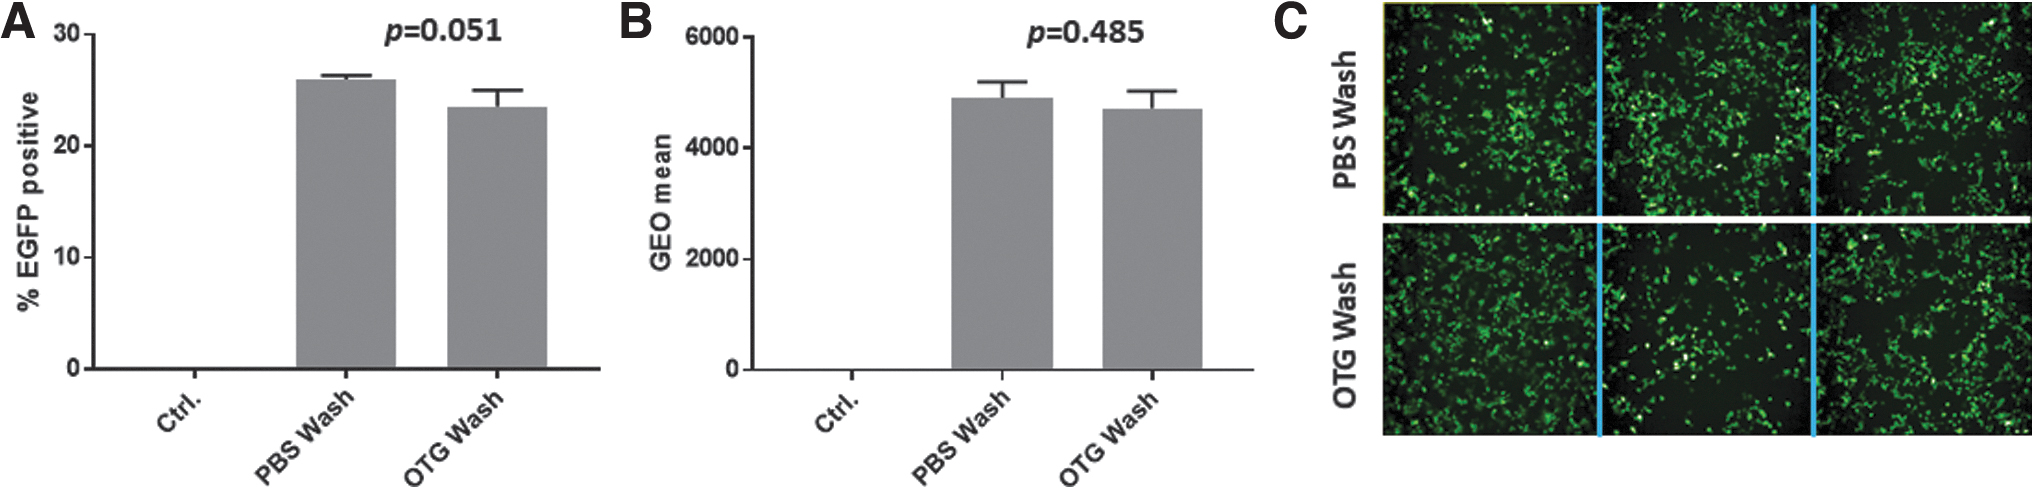
Comparison of the in vitro transduction efficiency of rAAV8-EF1α-EGFP purified with PBS and 2% OTG washes. HEK 293T cells were transduced with rAAV8-EF1α-EGFP at an MOI of 1 × 10⁵.
DISCUSSION
To efficiently produce large quantities of rAAV, both increasing the production yield in upstream processing and minimizing the loss in downstream processing are essential. In this study, we further optimized the processing of our DOE-optimized platform. 4 Previously we reported that the addition of sodium butyrate in rAAV5 production resulted in increased VP expression. Thus, sodium butyrate was included in the DOE-optimized platform. 4 In this study, we showed that rAAV production in the presence of peptone itself improved the production yield by 2.8- to 3.4-fold compared to the control, but combination of peptone and sodium butyrate reduced the yield.
The reason why sodium butyrate promotes rAAV production in some platforms, but has negative impact to others is still unknown. It has been shown that, besides increasing transcription and recombinant protein production, butyrate is toxic to cells. It inhibits cell growth and causes apoptosis. 7 In this study, it was found that the combination of sodium butyrate and either TN1 or yeastolate showed decreased cell viability and number of viable cells compared to TN1 and yeastolate alone, suggesting its toxic effects on the production cells. Thus, the adequate balance between increasing VP expression and limiting toxicity is needed to increase rAAV production using sodium butyrate.
Our results showed that the VG/CP ratio was 79% when TN1 was used, which was higher comapred with previously reported 37.4% for rAAV8 produced in HEK293SF suspension cells. 19 However, we previously reported that the titers by ddPCR were 23.1–31.7% lower than those by CyQUANT method. 4 Thus, the VG/CP ratio determined by CyQUANT and ELISA could be higher than that determined by other methods. Lower VG/CP obtained from yeastolate group compared to the TN1 group suggested that there might be component(s) in yeastolate affecting encapsulation of the rAAV genome. The results indicate that TN1 over yeastolate is optimal for rAAV production using DOE-optimized platform. Combination of TN1 and sodium butyrate resulted in much lower VG/CP ratio compared to TN1 or yeastolate only, suggesting that sodium butyrate may negatively affect the encapsulation of rAAV.
Vector loss arises at each step of downstream processing, which cumulatively results in low production yields. To simplify the downstream processing and maximize the benefits of affinity resins, we evaluated different washing buffers for rAAV affinity chromatography using PCS-AAVX resins. While salts, low pH, and arginine 20 were less effective in removing endotoxin and protein impurities, the zwitterionic detergent CHAPS interfered with the interaction of rAAV8 and PCS-AAVX resulting in low yield (Table 1). 20 Screening results showed that the nonionic detergents, OTG and Triton X-100, removed endotoxin and protein impurities, while maintaining rAAV bound to the PCS-AAVX, suggesting that OTG and Triton X-100 have an appropriate “strength” to wash off the protein and endotoxin impurities, but not rAAV, from affinity resin. High absorbance of Triton X-100 at 280 nm facilitated monitoring the removal of Triton X-100 from PCS-AAVX.
Extensive washing was necessary to remove Triton X-100 from the resin, suggesting a significant interaction between Triton X-100 and the resin, likely through the matrix of cross-linked polystyrene divinylbenzene. Although Triton X-100 was difficult to remove from the PCS-AAVX and not readily dialyzed out, it was effective in removing endotoxin and most protein impurities with a high yield. Thus, it could be a cost-effective mean for large-scale production compared to OTG. However, Triton X-100 needs to be completely removed by extensive washing and/or washing at elevated temperature.
Although OTG wash could change the way of rAAV affinity purification in the preclinical settings, to our knowledge, OTG has not been applied in Good Manufacturing Practice (GMP). However, extensive wash with PBS could reduce the concentration of OTG to a nondetectable level since OTG can be easily dissolved in PBS. Gadre et al used OTG wash for industrial scale purification of Fc-fusion protein (2 g) with cation exchange chromatography to remove endotoxin. 21 After extensive wash (20 CV), residual OTG in the purified protein was analyzed on a Vydac Protein C4 column and determined to be below the limit of quantitation method. In addition, OTG-washed recombinant protein showed stability and comparable activities. Thus, integration of OTG wash into GMP is possible as Triton X-100 has previously been integrated into various biopharmaceutical manufacturing processes.
The OTG wash removed significant amounts of protein impurities, which allowed us to eliminate the pH 5.5 precipitation step previously used to reduce protein impurities from the cleared harvest. 4 This modification not only reduced the loss of vectors but also simplified the process. Instead of the pH 5.5 precipitation, the Benzonase-digested harvest was diluted threefold to facilitate releasing rAAVs from the cell debris and reducing possible protein aggregation by lowering the protein concentration. In addition, the results in this study demonstrated that OTG served as an excellent wash to remove endotoxins, in agreement with previous publication for various protein purifications. 21
Overall, these improvements increased the production yield and decreased the loss, resulting in high purification yields of 5.5–6.0 × 10¹⁴ and 7.6 × 10¹⁴ VGs/L for rAAV8-EF1α-EGFP and rAAV5-Ef1α-EGFP, respectively. In summary, the previous DOE-optimized platform was further improved in both upstream and downstream processing, which not only significantly increased the purified yield but also resulted in a higher quality of rAAV, while keeping the simplicity of rAAV production.
CONCLUSIONS
In this study, we investigated effects of peptone, sodium butyrate, and combination of both on rAAV production yields and formation of empty particles. The results demonstrated that addition of peptone resulted in increased production yields by twofold to threefold. This appeared to be attributed to increased number of viable cells and viability. To optimize rAAV8 purification using PCS-AAVX, we screened variety of wash buffers. Among tested, the OTG wash yielded greatly improved purities of protein and endotoxin by 97% and undetectable, respectively, while the production yield of PBS wash was 92.3%. The optimized OTG wash was successfully applied to other serotypes, rAAV1, rAAV2, rAAV5, and rAAV9. In addition, the rAAV8 exposed to OTG showed comparable transduction efficiency in vitro to the rAAV8 exposed to PBS. Results described in this study will be beneficial to the field of rAAV-based gene therapy. A graphic summary is provided in Supplementary Fig. S8.
Footnotes
ACKNOWLEDGMENTS
The authors acknowledge Amgen Discovery Research, South San Francisco, CA, USA, for supporting the research, Christopher Hale for imaging the cells, and Dr. Lisa Stehno-Bittel for assistance with article editing.
AUTHORs' CONTRIBUTIONS
H.Z., conceived the project, designed the studies, performed all experiments, wrote the original draft of the article, review, and editing; W.H.M., helped to design and supervised the studies; S.W., resources and supervised the studies; K.J.L., helped to design, supervised the studies, reviewed the work critically, and editing. The article was approved by all authors.
AUTHOR DISCLOSURE
Authors are employees of Amgen, Inc. (Thousand Oaks, CA).
FUNDING INFORMATION
The studies were supported by Amgen Discover Research (South San Francisco, CA).
SUPPLEMENTARY MATERIALS
Supplementary Information
Supplementary Figure S1
Supplementary Figure S2
Supplementary Figure S3
Supplementary Figure S4
Supplementary Figure S5
Supplementary Figure S6
Supplementary Figure S7
Supplementary Figure S8
References
Supplementary Material
Please find the following supplemental material available below.
For Open Access articles published under a Creative Commons License, all supplemental material carries the same license as the article it is associated with.
For non-Open Access articles published, all supplemental material carries a non-exclusive license, and permission requests for re-use of supplemental material or any part of supplemental material shall be sent directly to the copyright owner as specified in the copyright notice associated with the article.