
Abstract
Lentiviral (LV) vector-based gene therapy is gaining popularity for treating a wide range of diseases. Various LV vectors are being developed for transducing cells in cellular gene therapy at St. Jude. Some LV vectors are produced using stable 293T packaging cell lines, which includes gag-pol-rev-tat and virus-glycoprotein. Transactivating factor (transactivator of transcription [Tat]) is a regulatory protein that drastically increases the efficiency of lentiviral transcription. Residual analysis of Tat is critical for gene vector quality and safety. In this work, we developed a highly sensitive liquid chromatography-tandem mass spectrometry method for analysis of residual Tat in Lentivirus as an alternative to enzyme-linked immunosorbent assay. Residual Tat in LV can be accurately quantified with high specificity with a limit of detection of 0.3 ng/mL.
HIGHLIGHTS
For quality control of vectors, we developed a highly sensitive liquid chromatography-tandem mass spectrometry method for analysis of residual transactivator of transcription (Tat) in lentivirus as an alternative to enzyme-linked immunosorbent assay (ELISA) by analyzing the specific peptide Tat 1–12 digested from Tat using multiple-reaction monitoring mass spectrometry.
The approach enables quantitation of residual protein Tat in lentiviral vectors, which overcomes the limitation of ELISA.
Limit of detection was 0.3 ng/mL of Tat (30 pmol/L).
INTRODUCTION
L
Transactivator of transcription (Tat) is a regulatory protein that increases efficiency of viral transcription, and enhances initiation and elongation associated with second-generation lentiviral system. However, Tat has been shown to pose safety risks due to its ability to act as a toxin leading to cell death through apoptosis and its involvement in human immunodeficiency virus (HIV) reactivation. Extracellular Tat acts as a viral toxin 3,4 that affects the biological activity of different cell types and plays a key role in acquired immune deficiency syndrome development. 5 In addition, Tat is essential for reverse transcription and replication of HIV-1, 6,7 and was reported to be involved in the Tat-mediated apoptosis of T cells. 8,9
The C terminus of Tat played an important role to upregulate CD178 mRNA expression and induce apoptosis in T cells. 10 Using Tat as an activator in Lentivirus production raises biosafety issues. The Biosafety Considerations for Research with Lentiviral Vectors document from the Recombinant DNA Advisory Committee meeting in March 2006 states that lentiviral vectors used for gene therapy should not express Tat. 11 To comply with the rigorous safety guidelines, we developed this residual analysis of Tat in Lentivirus products to ensure the safety of Lentivirus products and the importance of complying with regulatory guidelines. Therefore, it is critical to establish a residual analysis of Tat in Lentivirus products to ensure lot-to-lot consistency and meet rigorous safety requirements.
Tat protein consists of 80–103 amino acids (AAs) depending on the viral isolates. 3,12 Tat protein derived from HIV-1 subtype B strain Bh10 subtypes with 101 AA (Tat 1–101) is employed in the production of lentiviral vectors for XSCID, which is the target analyte in this report.
Enzyme-linked immunosorbent assay (ELISA) is normally the method of choice for analysis of residual protein due to its high sensitivity. However, ELISA is not ideal for Tat detection due to the lack of commercial availability of high-quality, high-specificity antibodies against Tat. Mass spectrometry (MS) provides a next-generation platform that overcomes many limitations of bioassay with new capabilities for residual protein analysis. Lentiviral vectors contain abundant structural proteins, including viral core matrix, capsid, nucleocapsid proteins as well as viral replication essential enzymes and surface proteins. To quantitate residual Tat in the presence of overwhelming lentiviral proteins is challenging due to the ionization suppression among coeluting species in electrospray process and difficulty to identify a suitable substrate of peptide.
To overcome these difficulties, we developed a targeted protein quantitation method by analyzing the specific peptide Tat Bh10 1–12 (Tat 1–12) from lentiviral protein digests based on multiple-reaction monitoring (MRM) MS. MRM is highly sensitive and specific for quantitation of targeted peptides based on specified precursor peptide-to-fragment ion transitions. 13 –15 Due to the high specificity of MRM MS, it allows precise quantification of specific protein in complex biological samples with protein digestion. MRM-MS, in general, produces low background noise, and thus high sensitivity can be achieved.
Triple quadrupoles MS instrument is typically employed for MRM analysis. Individual peptides are selected based on mass-to-charge ratio (m/z) in the first quadrupole mass filter and fragmented by collision-induced dissociation in the second quadrupole. The resulting fragments are then transferred to the third quadrupole, which selectively detects product ions at specified mass-to-charge ratios. The liquid chromatography-tandem mass spectrometry (LC-MS/MS) method developed is capable of quantifying residual Tat protein in lentiviral vectors with high sensitivity and precision.
MATERIALS AND METHODS
Tat and internal standard
Tat 1–101 was synthesized by St. Jude peptide synthesis core center. Protein Tat 1–101 has a molecular weight of 11575.22 Da. The full sequence of Tat 1–101 is shown below:
MEPVD
GSQTHQVSLS KQPTSQSRGD PTGPKESKKK VERETETDPF D
Heavy Tat 1–101 was synthesized in a similar manner with two Prolines of 13 C5 and 15 N1 at AA sequence positions 6 and 10. Heavy Tat 1–101 was used as an internal standard. The purity of Tat 1–101 and heavy Tat 1–101 was >95% by reverse-phase ultra-performance liquid chromatography (RP-UPLC)-ultraviolet. Standard peptides Tat 1–12 and heavy Tat 1–12 were also synthesized and purified by reverse-phase high-performance liquid chromatography (RP-HPLC) with purities >90%, and received in the form of lyophilized powder.
Chemicals and reagents
Dithiothreitol (DTT, Catalog No. A39255) and iodoacetamide (IAA, Catalog No. A39271) were purchased from Thermo Fisher Scientific (Waltham, MA), Lysyl Endopeptidase (Lys-C, Catalog No. 125-05061) was purchased from FUJIFILM Wako Chemicals USA, Corp. (Richmond, VA), and Guanidine hydrochloride (Catalog No. 50933) was purchased from Sigma (St. Louis, MO). TrisHCl buffer (1 M, pH 8, Catalog No. 51238) was purchased from Lonza AccuGENE (Morristown, NJ).
LV vectors
Tat-containing and Tat-free lentiviral vectors were produced and purified by St. Jude Therapeutics Production and Quality. Tat-free LV vector was prepared by transient transfection of HEK 293T suspension cells in Freestyle media using plasmids that contain the gag-pol-rev and VSVG genes, along with a target gene (aCD-123). The LV vectors were purified by ion exchange chromatography and formulated in phosphate-buffered saline.
Stock solution and working solution preparation
Stock solutions of Tat 1–101 and internal standard (IS) (hTat 1–101) at 1 mg/mL were prepared by weighting ∼3 mg of Tat 1–101 or hTat 1–101, and adding desired volumes of water—0.1% formic acid (FA). Tat 1–12 stock solution (1 mg/mL) was prepared by weighting ∼1–2 mg of Tat 1–12 and adding desired volume of 0.1% FA in water–acetonitrile (50:50). The stock solutions were aliquoted and stored at −80°C for up to 6 months. Working solution of IS (hTat 1–101) at 4 μg/mL and working solution of Tat 1–101 at 2 μg/mL were prepared by diluting the stock solutions with water containing 0.1% FA.
All working solutions were prepared daily. A 10 μg/mL of Tat 1–12 sample was prepared by diluting the stock solution with 0.1% FA in water–acetonitrile (50:50), aliquoted and stored at −80°C for up to 6 months for system suitability test and mass accuracy check. Double blank sample (DBK) without Tat/IS and blank sample with IS only were prepared in Tat-free lentiviral vectors as negative control and interference peak check, respectively.
Sample preparation, denaturation, reduction, and digestion
Calibration standards (STDs) and quality control (QC) sample were prepared freshly by spiking a Tat-free lentiviral vector with the Tat 1–101 working solution at concentrations of 4, 8, 16, 32, 64 ng/mL for STDs and 40 ng/mL for QC samples. Five microliters of the IS working solution was added to each 135 μL of calibration standard, QC, and blank (Tat-free LV) samples to be tested. A vial of Tat-free LV was processed along with other samples as a DBK sample without Tat/IS. One microliter of 0.5 M of DTT in 7.5 M guanidine hydrochloride/1 M TrisHCl pH 8 was added to each of calibration STDs, QCs, blank, and DBK to be tested.
The sample was vortexed and incubated at 37°C at 400 rpm for 30 min. Then, 2 μL of 0.5 M of IAA was added to each vial, vortexed and incubated at 37°C at 400 rpm for 15 min. Next, another 1 μL of 0.5 M DTT was added to the mixture, vortexed and incubated at 37°C at 400 rpm for 15 min. Digestion was performed by adding 6.5 μL of Lys-C (1 mg/mL in 100 mM NH4HCO3 buffer) to each sample, and the sample was incubated at 37°C at 400 rpm for 4 h. After digestion, 1.5 μL of FA was added to each sample vial, vortexed, and kept at −80°C until analysis. The digested samples were analyzed by LC-MS/MS immediately or within 1 week of storage at −80°C.
Instrumentation
WATERS ACQUITY UPLC H Class Bio coupled with Xevo G2-S QTof with UNIFI was used for intact mass analysis of Tat 1–101. The UPLC system was equipped with a direct inject autosampler setting at 10°C and a column oven at 80°C. The mobile phases consisted of A, 0.1% formic acid in water; and B, 0.1% formic acid in acetonitrile. For intact mass, 1 μL aliquot of sample at a concentration of 1 mg/mL was injected into the Waters ACQUITY UPLC Protein BEH C4 Column (300 Å pore, 1.7 μm particle, 2.1 × 50 mm) with a gradient for intact analysis stated in Supplementary Table S1.
Waters Xevo-G2-S mass spectrometer was calibrated using NaF (200–2,000 m/z) and tuned according to manufacturer's recommendation. Detector and lockspray were checked under positive sensitivity mode. Reference lockspray was performed using [Glu1]-Fibrinopeptide B (100 fmol/μL)-Leucine encephalin (200 pg/μL) solution at m/z +785.8421. The parameter for the mass spectrometer was tuned as follows: capillary voltage 2.5 kV, sample cone 120 V, source temperature 140°C, desolvation temperature 600°C, cone gas flow 0 L/h, and desolvation gas flow 800 L/h.
For peptide mapping, Waters ACQUITY UPLC Protein BEH300-C18 (1.7 μM, 2.1 × 100 mm) column was used on the WATERS ACQUITY UPLC H Class Bio coupled with Xevo G2-S QTof. The gradient for peptide mapping is shown in Supplementary Table S2. Waters Xevo-G2-S mass spectrometer was calibrated using NaF (200–1,600 Da), with the source temperature set at 150°C. All other parameters were the same as for intact mass analysis.
Quantitative analysis of residual protein of Tat in Lentiviral samples was performed on WATERS ACQUITY UPLC I Class coupled with Sciex Triple Quad 6500 system. The system was tuned and calibrated with postive polypropylene glycol 2 × 10⁻⁷ M as suggested by the manufacturer. The UPLC system was equipped with a direct inject autosampler set at 10°C. The quaternary solvent blending pumps had two mobile phases: A, 0.1% acetic acid in water and B, 0.1% acetic acid in acetonitrile. Ten microliters of sample was aspirated from the sample well into the autosampler needle, and then injected into a 10 μL sample loop with a full loop injection mode. The sample was loaded onto a Waters BioResolve RPmAB Polyphenyl column (450 Å, 2.7 μm particle, 1.0 × 150 mm).
Peptides were eluted from the column at a flow rate of 100 μL/min with a gradient starting with 10% B for 1 min, 10–12% B over 1 min, 12–15% B over 11 min, and 15–95% B over 1 min. Two MRM transitions at m/z 499.9 → 463.6 for digested peptide Tat 1–12 from Tat 1–101 (declustering potential [DP] = 56 V, entrance potential [EP] = 10.8 V, collision energy [CE] = 18 V, collision cell exit potential [CXP] = 28 V) and 503.9 → 469.6 for digested peptide heavy Tat 1–12 from the internal standard heavy Tat 1–101 (DP = 69 V, EP = 10 V, CE = 19 V, CXP = 25 V) were monitored.
Source parameters were optimized by T infusion of Tat 1–12 check solution and hTat 1–12 solution, respectively, at a flow rate of 7 μL/min. Curtain gas was set at 20 psi, collision gas at 8 psi, ion spray voltage at 4,500 V, and source temperature at 350°C; ion source gas 1 and gas 2 were set at 20 and 50 psi, respectively.
Data analysis was processed using MultiQuant 2.1 with SignalFinder™ algorithm (Sciex). Calibration curve was obtained using peak area ratio of analyte to internal standard against analyte concentration. Linear regression with a weighting factor of 1/x 2 was used for calibration curve.
RESULTS AND DISCUSSION
Intact mass and peptide mapping of Tat 1–101
A typical ion chromatogram of intact mass of Tat bH10 1–101 is shown in Supplementary Fig. S1. A deconvoluted mass of 11574.77 Da was observed, which agrees with the theoretical average molecular weight 11575.22 Da (average mass calculated with
Peptide mapping, a solution of Tat 1–101 in enzyme reaction buffer (100 mM NH4HCO3) at 10 μg/ml was treated separately with four different enzymes, including trypsin, Asp-N, Arg-C, and Lys-C to identify the most applicable enzyme for digestion. Lys-C was selected due to the cleaved peptides of moderate molecule weights. The ratios of Lys-C to substrate and different concentrations of Lys-C were examined, and optimized as 1:20 (Lys-C/substrate).
Digestion conditions were optimized to be incubated for 4 h at 37°C. Basic workflows employed reduction with DTT, alkylation with IAA, proteolysis with Lys-C, and the separation of the resulted peptides and analysis through TOF MS. All eight expected peptides of Tat 1–101 with Lys-C digestion were found. The XIC figures of all peptide peaks are shown in Fig. 1. Peptide Tat 1–12 showed the strongest peak intensity and ideal separation as a precursor ion. Thus, it was selected as the candidate for further MRM studies.
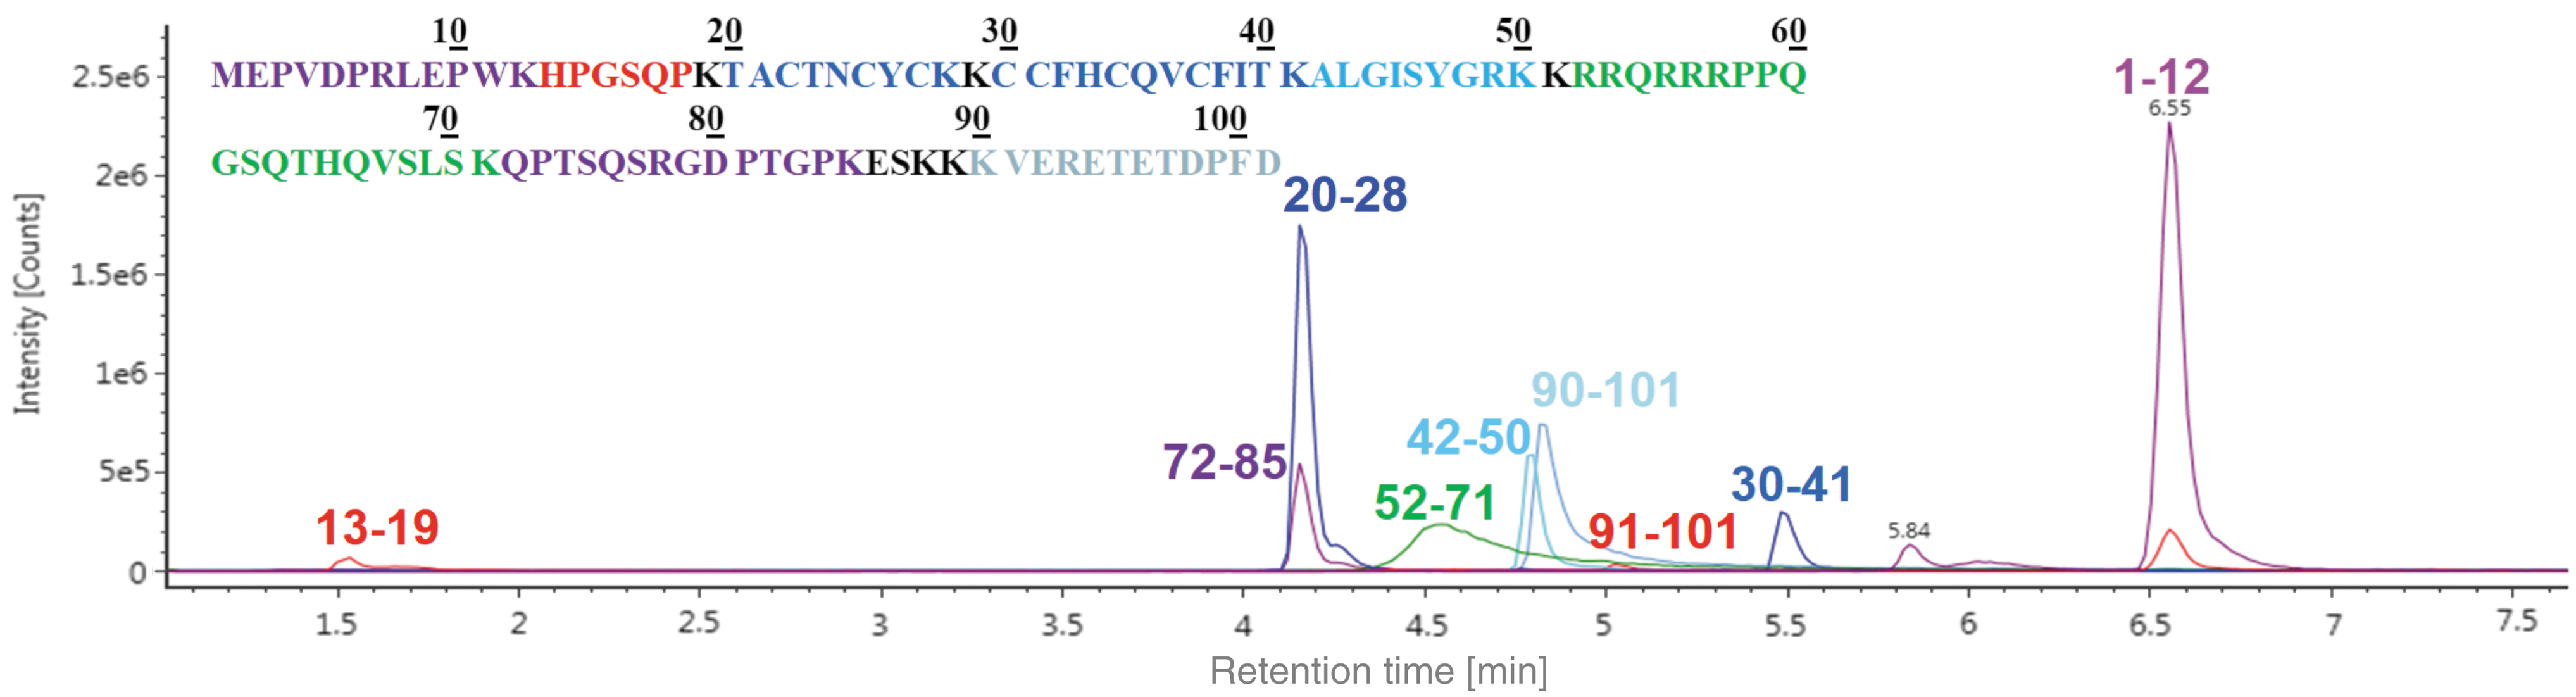
XIC for peptide mapping of Tat 1–101 with Lys-C digestion followed by LC-MS analysis. LC-MS, liquid chromatography–mass spectrometry; Tat, transactivator of transcription.
Different types of columns, Waters ACQUITY UPLC Peptide BEH300 C18, Waters ACQUITY UPLC Peptide CSH C18, and Phenomenex Luna Omega 1.6 μm C18 columns were explored to compare the response of Tat 1–12 for optimized sensitivity. Waters BioResolve RPmAB Polyphenyl column (450 Å, 2.7 μm particle) was selected due to its highest response of interesting peak. Increased sensitivity was observed with a narrow diameter column (1.0 mm) compared with common 2.1 mm diameter column at a lower flow rate of 100 μL/min. For mobile phase optimization, formic acid as a modifier showed lower sensitivity compared with acetic acid.
The reducing agents of DTT and Tris(2-carboxyethyl)phosphine hydrochloride at different concentrations, with or without alkylation agents, were also examined. The condition of DTT/IAA in 7.5 M guanidine/1 M TrisHCl was optimized as reducing/denature conditions. A precursor ion of triply charged Tat 1–12 (m/z 499.9) and a fragment of doubly charged y7 ion (m/z of 463.6) were selected as the MRM transition for Tat 1–12 based on the intensity of the signal (Fig. 2).
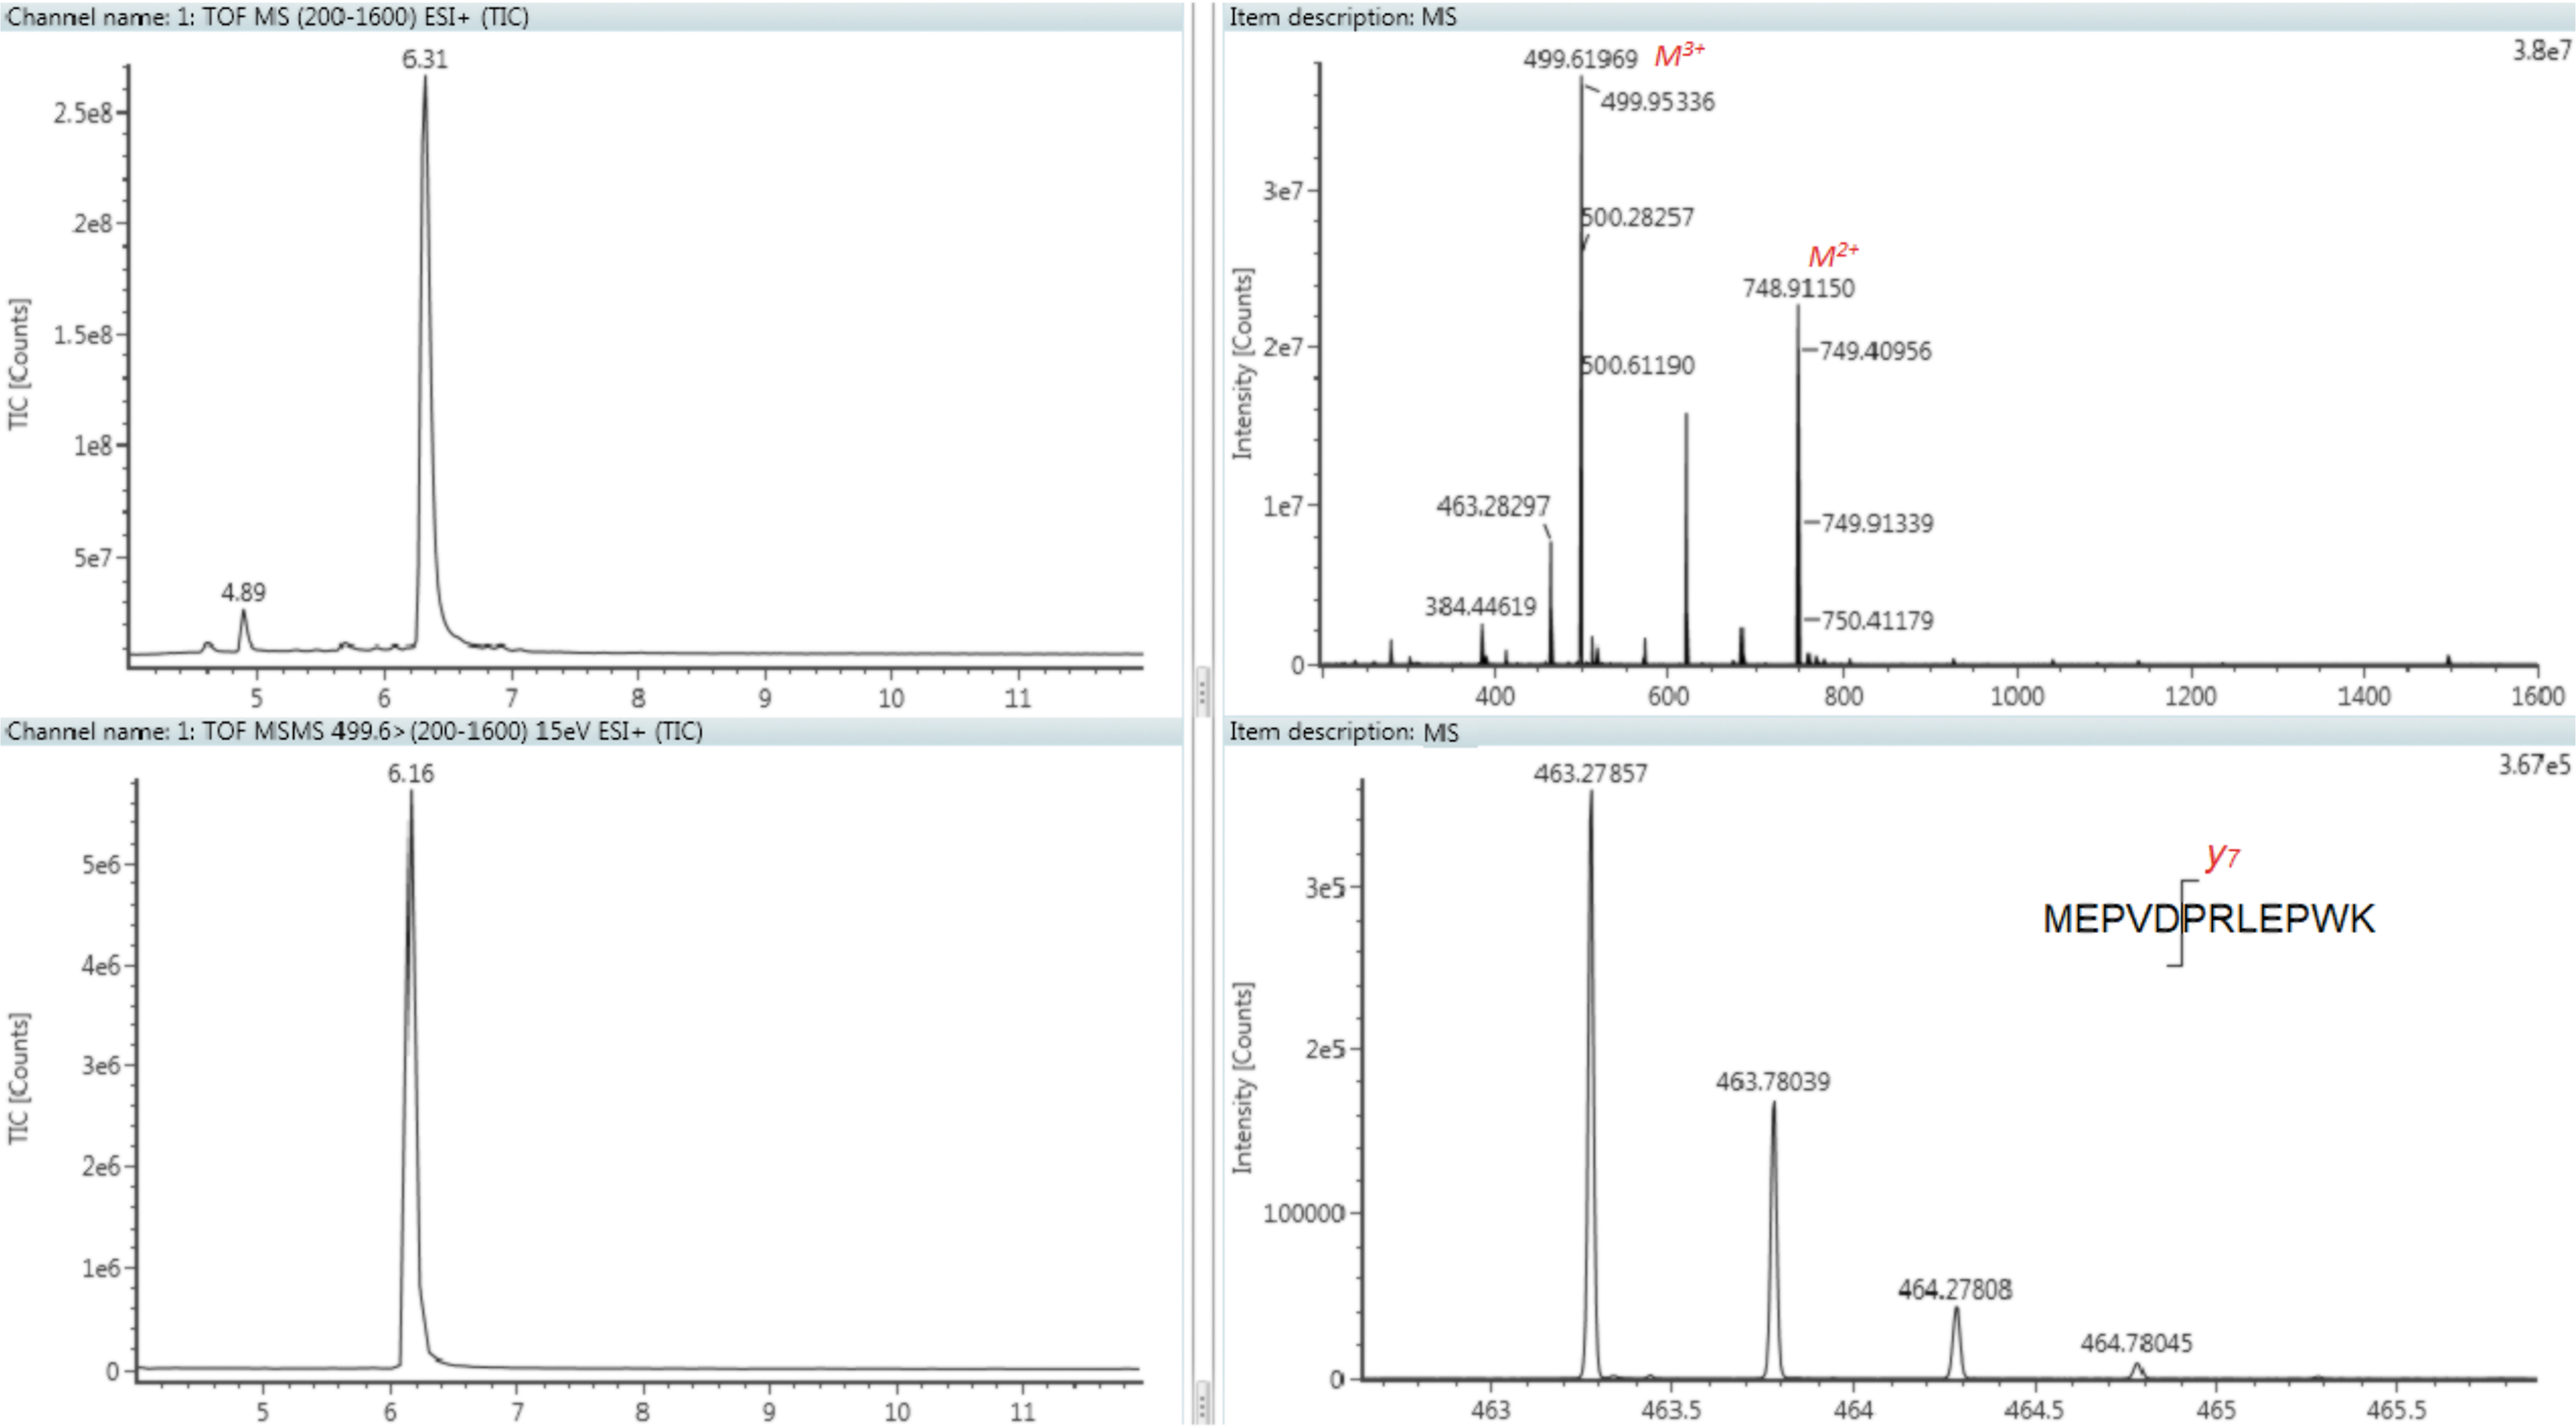
Selection of MS/MS signal of Tat 1–12. Top left: Total ion chromatogram of Tat 1–12 standard; top right: Mass spectrum of Tat 1–12; bottom left: Total ion chromatogram of MS/MS fragment ions from triply charged Tat 1–12, m/z 499.6; bottom right: Mass spectrum of fragment ions from triply charged Tat 1–12.
Internal standard selection
Enzymatic proteolysis and mass spectrometric ionization are susceptible to variability during protein bioanalysis by LC-MS/MS. An internal standard, stable isotope-labeled form of Tat 1–101, was added to all the samples except DBK before reduction/denaturation and digestion to compensate for variability encountered in sample processing and instrumental analysis.
There are three prolines available for heavy labeling in the AA position 1–12 of Tat 1–101. Different types of heavy Tat 1–101 materials with one, two, or three labeled prolines were tested. One 13 C5 and 15 N1 Proline-labeled Tat 1–101 generate only 6 Da difference from its light counterpart, which was not sufficient for clean separation of analyte and IS with the triple quad MS. All three-Proline–labeled Tat 1–101 give a bigger m/z change compared with the light counterpart. However, it was observed that the triply charged b 12 ion (m/z 499.93) generated by in-source fragmentation of the three-Proline–labeled Tat 1–12 (after digestion of the heavy Tat 1–101) had interference to the triply charged Tat 1–12 (m/z 499.92) in the triple quad MS. Thus, the three-proline–labeled Tat 1–101 cannot be used as an internal standard.
Also, the proline at position 3 is not suitable to be labeled as the resulting singly charged b 4 ion has a m/z of 463.58, which is too close to the product ion y 7 of Tat 1–12 (m/z 463.56). Therefore, heavy Tat 1–101 with two isotope labeled prolines at positions 6 and 10 was selected as an internal standard, which generates heavy Tat 1–12 “MEPVDP*RLEP*WK” after Lys-C digestion. The MRM transition of the two Pro labeled Tat 1–12 (triply charged precursor [m/z 503.9] to doubly charged y 7 [m/z 469.6]) had no interference to the analyte MRM transition (m/z 499.9–463.6). Tat protein family is well conserved with prolines at 6 and 10 positions. 16 The two-proline–labeled heavy Tat 1–101 can be possibly used for analysis of other Tat family proteins as an internal standard.
System suitability
System suitability test was performed for each batch of analysis to ensure that the system is functioning correctly as an integrated system at the time of use. Mass accuracy was checked by analyzing a solution of Tat 1–12 peptide (10 μg/mL). The observed mass peaks are all in the range of theoretical m/z 499.9 ± 0.1 Da. System suitability was further performed by analyzing a blank sample (Tat-free LV vector). A blank was digested and analyzed to ensure no carryover or interference background peak or contamination in the LV vector, sample matrix, solutions, and reagents at the time of use. In comparison with the Tat-free LV spiked with Tat 1–101, no interference peaks were observed from the Tat-free LV sample (Fig. 3).
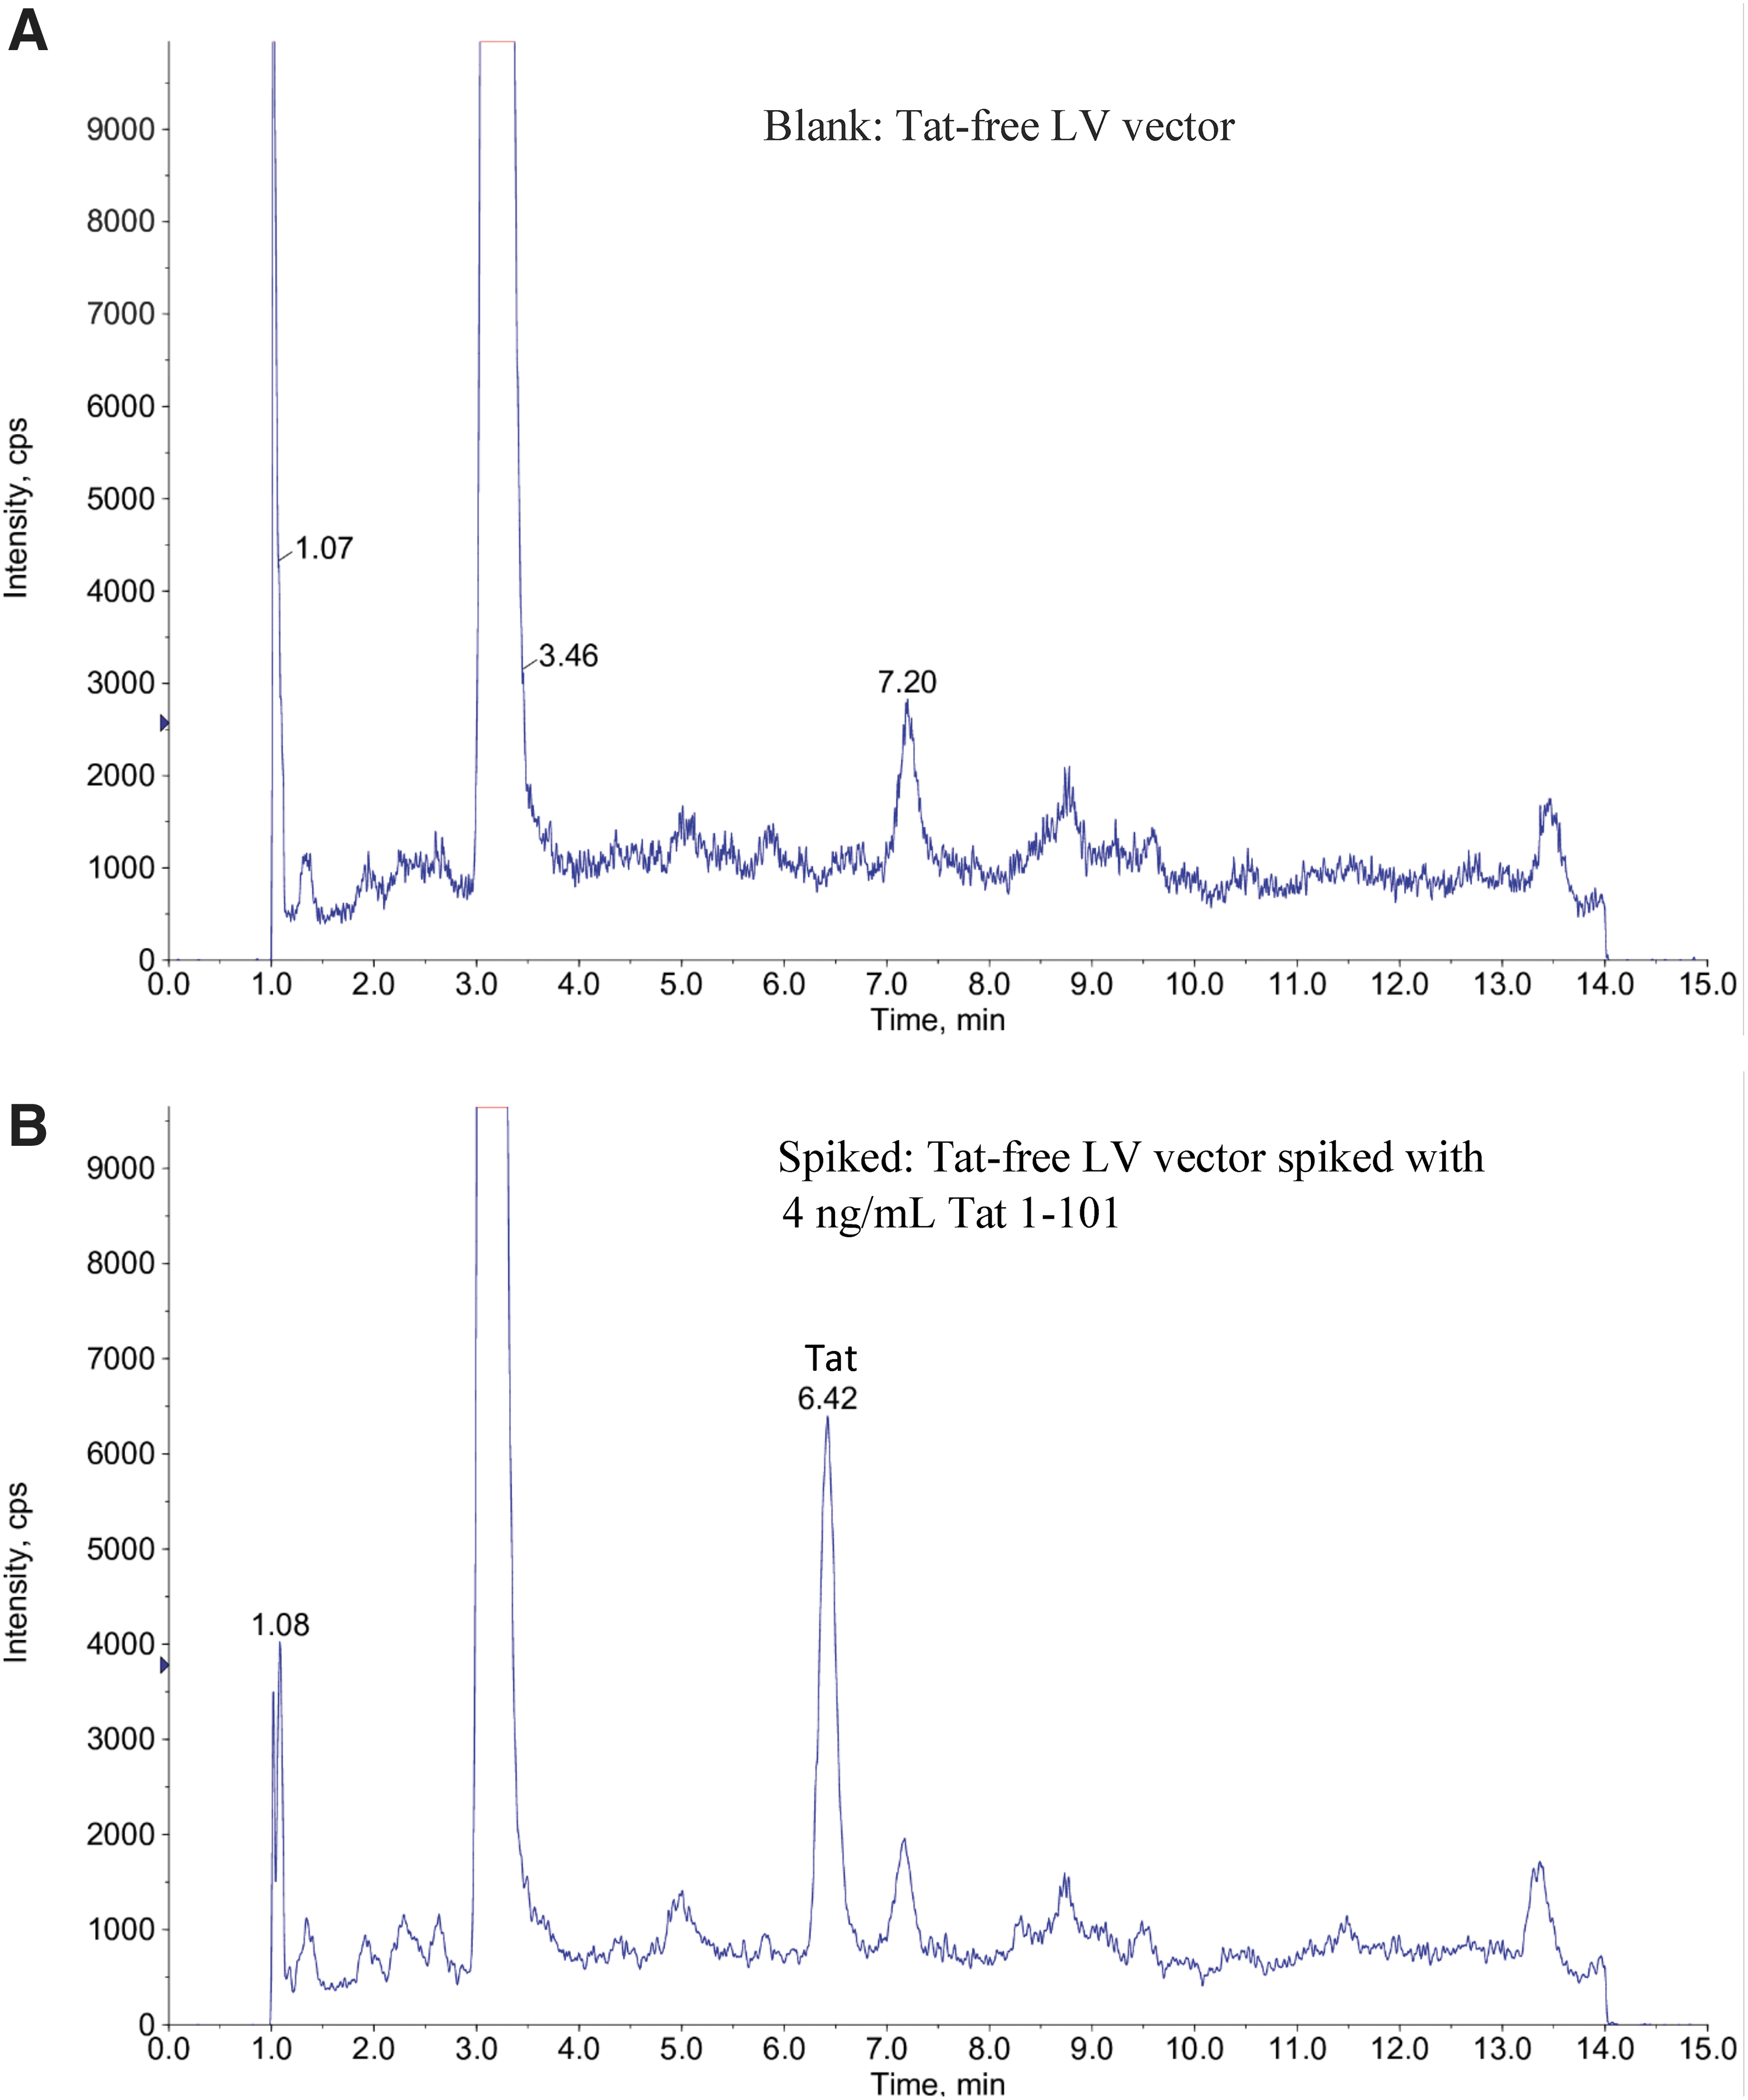
Typical MRM (499.9/463.6) chromatograms of a blank
Specificity and selectivity
Specificity and selectivity are the ability to assess unequivocally the analyte in the presence of related and unrelated components, which may be expected to be present. Typically, these might include impurities, degradants, and the sample matrix. Three batches of Tat-free LV vectors were analyzed to evaluate the selectivity/specificity. No interference peak was observed at the retention times of the analyte (Fig. 4). The data demonstrate that the method is capable of distinguishing Tat from other components present in the LV vectors.
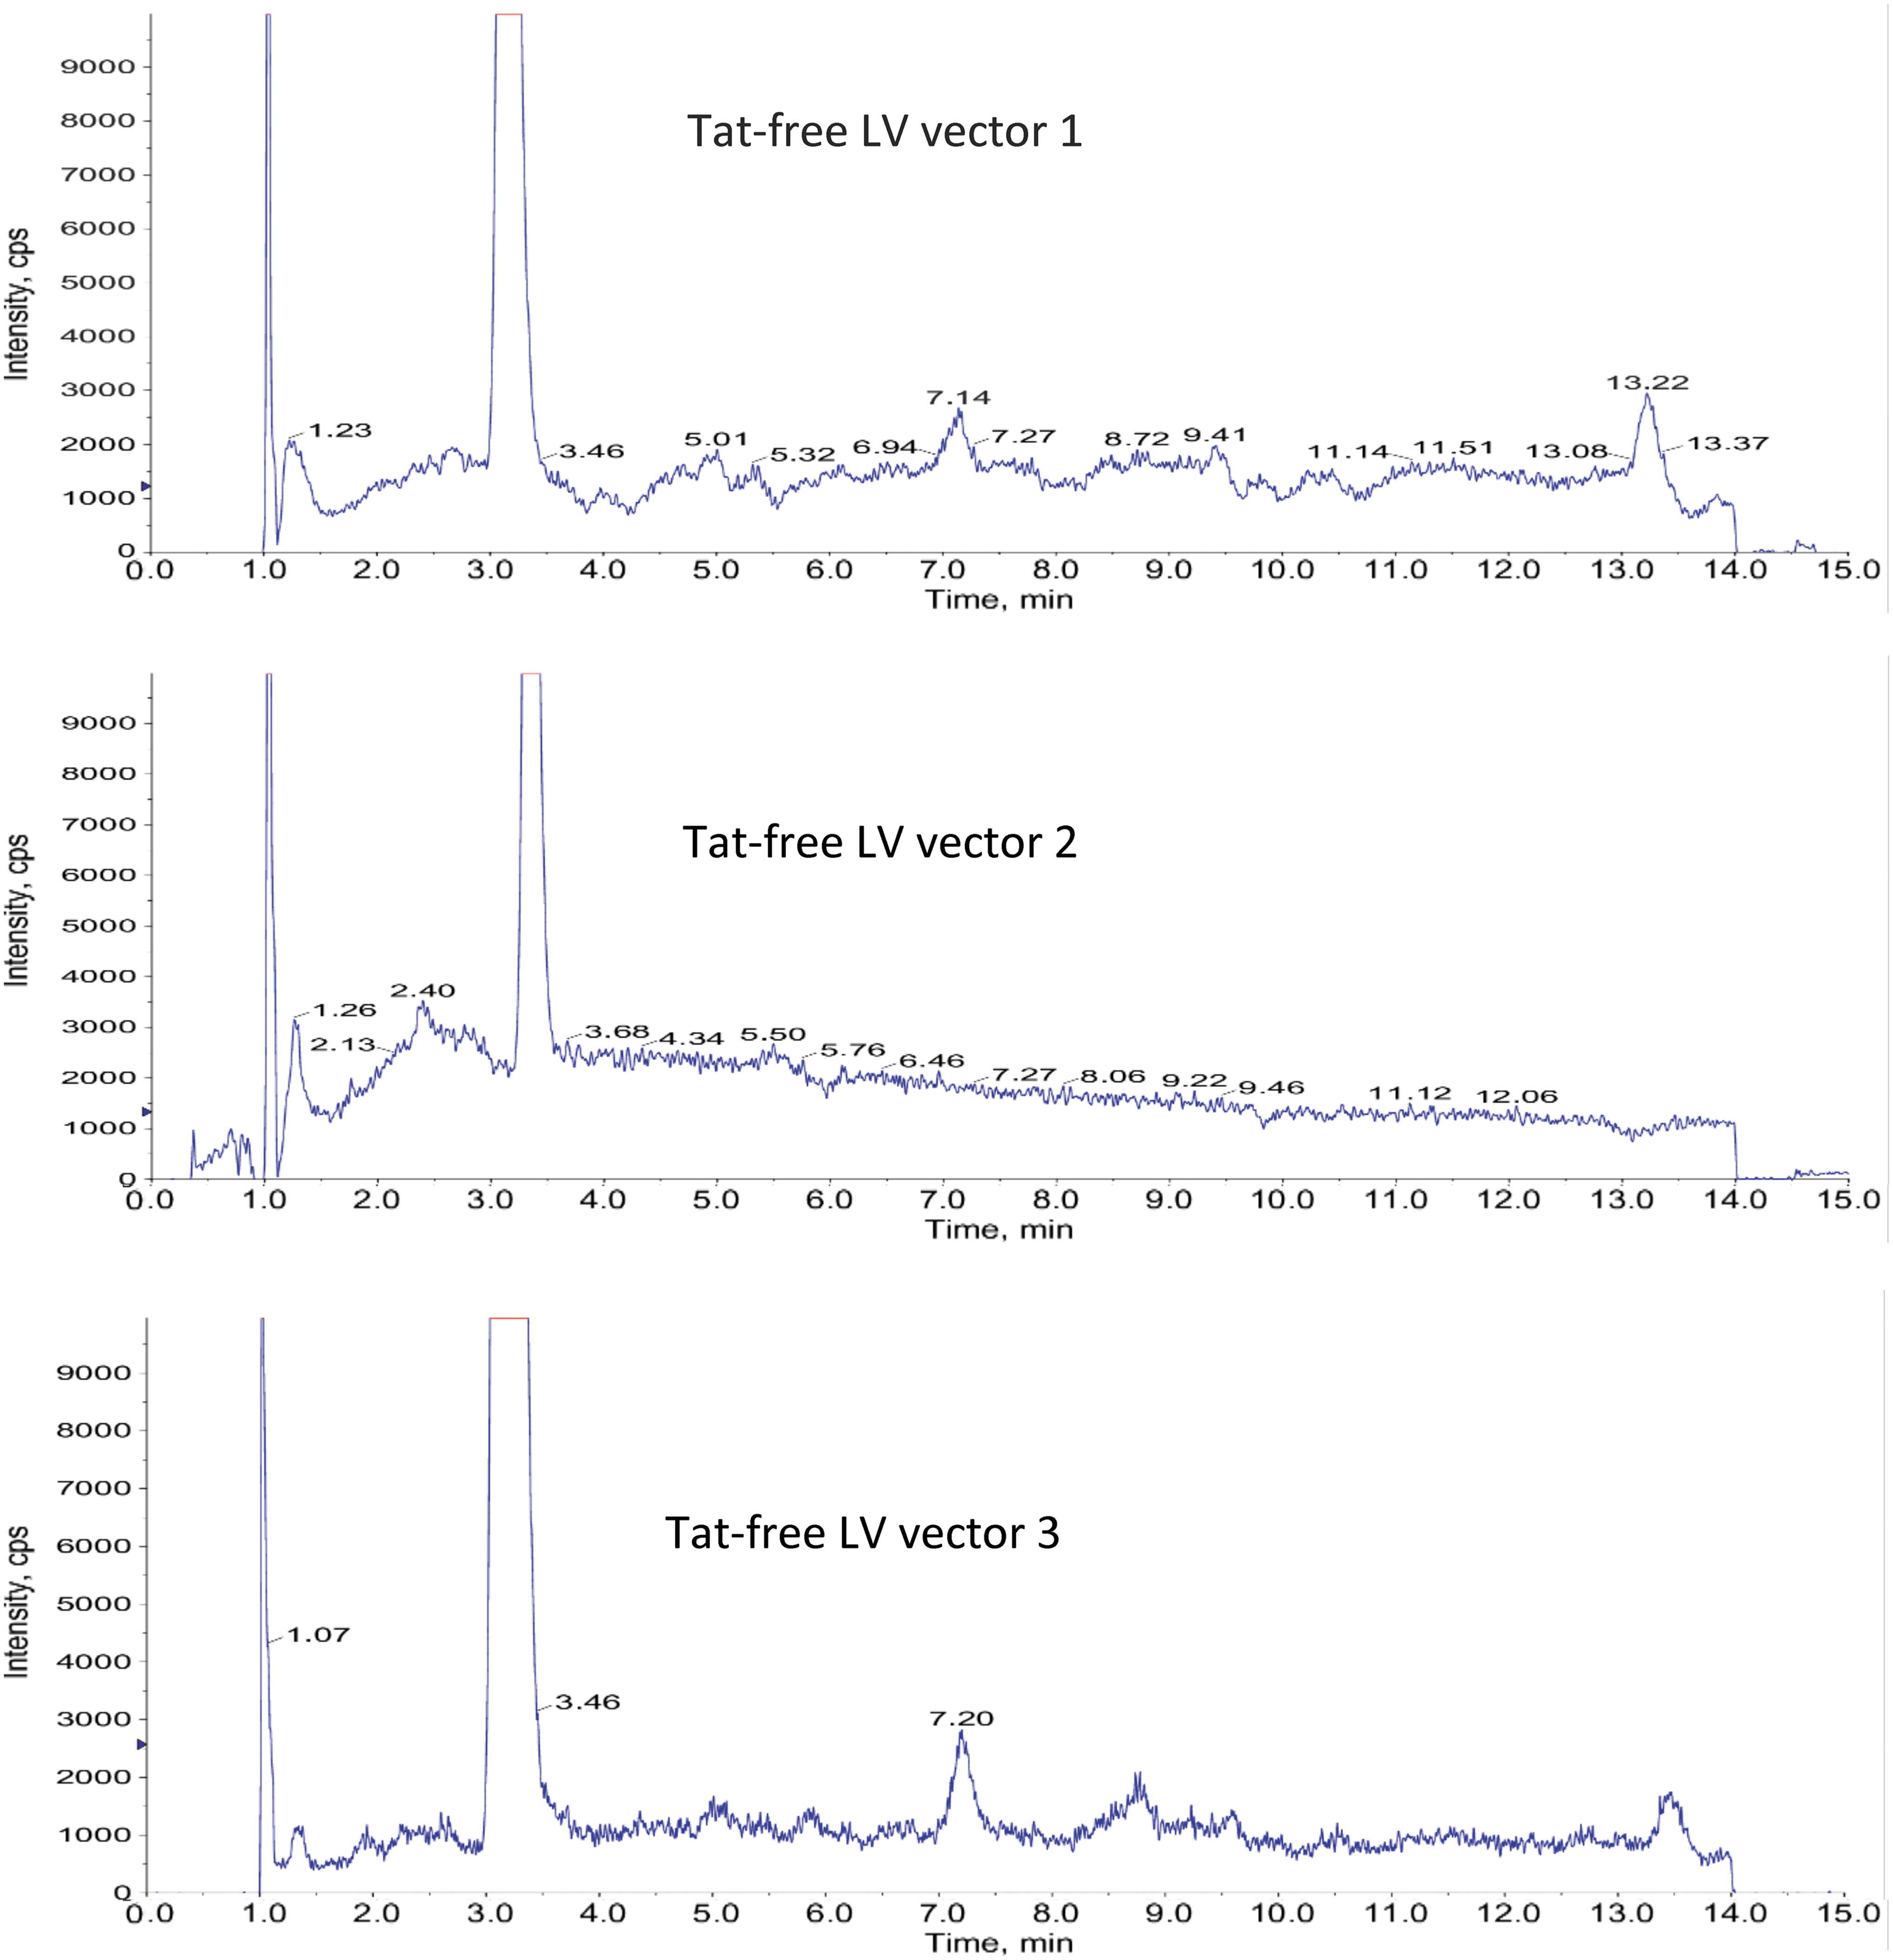
MRM chromatograms of three different lots of Tat-free LV vector samples: No interference was observed at the Tat retention time ∼6.4 min.
Precision and accuracy
The precision of an analytical procedure measures the closeness of agreement (degree of scatter) between a series of measurements. In this study, intrabatch precision was evaluated by processing and analyzing three replicates of a QC sample (a Tat-free LV spiked with 40 ng/mL Tat 1–101). Accuracy of an assay is defined as the degree of closeness of measurements of a quantity to its actual (true) value. Measured concentrations for the QC samples are summarized in Table 1. Intrabatch precision relative standard deviation (RSD) values were 1.5–3.1% in the three independent batches. The QC concentration was measured to be 100.6–108.9% of nominal concentration.
Intrabatch and interbatch precision and accuracy
QC sample was prepared by spiking a Tat-free LV vector with 40 ng/mL Tat 1–101.
LV, lentiviral vector; QC, quality control; RSD, relative standard deviation; Tat, transactivator of transcription.
Interbatch precision and accuracy were tested by processing and analyzing three replicates of a QC sample per day on three different days. Interbatch RSD was 4.3% (Table 1). QC concentration was measured to be 105.9% of nominal concentration in the interbatch accuracy testing. The predefined interbatch accuracy criteria were met. The data demonstrate that this method is reproducible and accurate. Precision and accuracy depend on QC concentration tested. Normally, higher variations may be observed with lower QC concentrations.
Calibration curve and linearity
Calibration curve (standard curve) was obtained by linear regression analysis of peak area ratio of Tat 1–101 to the IS (isotope-labeled heavy Tat 1–101) against the concentration of Tat 1–101 in the LV vector matrix. Five calibrations of standards containing 4–64 ng/mL of Tat 1–101 were prepared in the Tat-free LV vector, the same matrix as the incurred samples. All standard samples were denatured, reduced, and digested the same way as incurred samples. The correlation coefficients were 0.995–0.999 for the three independent analytical batches (Table 2).
Linearity of three batches
The back-calculated concentrations of the calibration standards were 92.0–107.5% of the nominal values. The data demonstrated that the method was linear over a Tat 1–101 concentration range of 4–64 ng/mL. In this work, 4 ng/mL was selected as the lower limit of quantitation (LLOQ) as it was sufficient for the purpose of analyzing residual Tat in our LV product. In fact, concentration <4 ng/mL could be used as LLOQ, generating a signal-to-noise ratio (S/N) >10.
Limit of detection
The limit of detection (LOD) was evaluated as the concentration of Tat 1–101 in LV vector at which the analyte can produce a S/N of 3. A S/N of 40 was observed for a spiked sample of 4 ng/mL Tat 1–101 in LV (Fig. 3B). Therefore, the LOD for Tat 1–101 is estimated to be 0.3 ng/mL.
Matrix effect
A matrix effect is defined as an alteration of the analyte response due to interfering and often unidentified and invisible components in the sample matrix. The matrix effect is evaluated by analyzing QC samples prepared using matrix from different sources/lots. Three independent Tat-free LV vectors spiked with Tat 1–101 (40 ng/mL) were analyzed. Data demonstrate that sample matrix and LV had no impact on assay results for residual Tat. Table 3 displays three distinct batches of LV with varying protein levels, ranging from 143 to 963 mg/mL. Despite the diverse protein compositions of the three LV vectors, all spiked samples were measured accurately with <15% deviation from the expected values.
Matrix effect
CONCLUSIONS
Ensuring the safety and efficacy of lentiviral vectors (LVs) is crucial for successful gene therapy. Detection and quantification of residual proteins are an essential part of this process. The LC-MS/MS method has emerged as a promising analytical tool in this field due to its high sensitivity, specificity, and accuracy. The reported LC-MS/MS method is capable of analyzing residual Tat protein in LV vectors.
Considering the highly conserved sequence for the Tat variants in the N-terminal region, this method, along with the use of 6P, 10P-isotope–labeled heavy Tat 1–101, has the potential to be used for other Tat protein families. The methodology of MRM of protein-digested peptides used can also be applied to other residual protein analyses in complex biotherapeutic products. Sample matrix effects are minimum with MRM. In this work, only one QC level was tested for accuracy. When the product progressed to later stage such as phase 2/3 clinical trials, multiple QC levels (Low, middle, and high) and multiple analysts may be involved.
The LC-MS/MS method is a reliable and efficient alternative or an orthogonal approach to ELISA for detecting residual Tat protein in LV vectors for gene therapy. Although ELISA has been widely used for protein analysis, it presents several challenges for detecting Tat protein. These include the lack of commercially available high-quality antibodies specific to the Tat Bh10, crossreactivity of Tat antibodies with other proteins in LV, and matrix effects of the sample. In addition, ELISA is time-consuming due to the multiple manual handling steps required, limiting its utility in high-throughput settings.
In contrast, LC-MS/MS offers high specificity by detecting unique mass-to-charge ratios of target peptides derived from the target protein, making it a more accurate method for detecting Tat protein. It requires minimum manual handling and is less sensitive to the reagents used in comparison with ELISA. The LC-MS/MS performance and reliability make it a valuable tool for ensuring the safety and efficacy of LVs in gene therapy.
Footnotes
ACKNOWLEDGMENTS
The authors thank Dr. Michael Meagher, Dr. Timothy Lockey, Dr. Alicia Powers, and Dr. Jason Drury for providing the lentiviral vectors and for discussion. They are grateful to Dr. Catherine Willis, Ms. Shirley Steward, Dr. Shanthi Vadali, and Ms. Kendra Huseman for analytical support.
AUTHORs' CONTRIBUTIONS
Y.L. designed conceptualization, performed analysis, wrote the article, and drew the figures; C.-X.Z. performed supervision, conceptualization, methodology, data analysis and interpretation, and editing of the article; P.R. synthesized and purified the proteins/peptides light/heavy standards; Y.L. and Z.R. contributed to data investigation, instrument, and software supporting; A.S. and F.F. reviewed and edited the article.
AUTHOR DISCLOSURE
No competing financial interests exist.
FUNDING INFORMATION
Funding for this project was provided by the American Lebanese Syrian Associated Charities (ALSAC).
SUPPLEMENTARY MATERIAL
Supplementary Figure S1
Supplementary Table S1
Supplementary Table S2
References
Supplementary Material
Please find the following supplemental material available below.
For Open Access articles published under a Creative Commons License, all supplemental material carries the same license as the article it is associated with.
For non-Open Access articles published, all supplemental material carries a non-exclusive license, and permission requests for re-use of supplemental material or any part of supplemental material shall be sent directly to the copyright owner as specified in the copyright notice associated with the article.