
Abstract
Currently, adeno-associated virus (AAV) is one of the primary gene delivery vectors in gene therapy, facilitating long-term in vivo gene expression. Despite being imperative, it is incredibly challenging to precisely assess AAV particle distribution according to the sedimentation coefficient and identify impurities related to capsid structures. This study performed the systematic methodological validation of quantifying the AAV empty and full capsid ratio. This includes specificity, accuracy, precision, linearity, and parameter variables involving the sedimentation velocity analytical ultracentrifugation (SV-AUC) method. Specifically, SV-AUC differentiated among the empty, partial, full, and high sedimentation coefficient substance (HSCS) AAV particles while evaluating their sedimentation heterogeneity. The intermediate precision analysis of HE (high percentage of empty capsid) and HF (high percentage of full capsid) samples revealed that the specific species percentage, such as empty or full, was more significant than 50%. Moreover, the relative standard deviation (RSD) could be within 5%. Even for empty or partially less than 15%, the RSD could be within 10%. The accuracy recovery rates of empty capsid were between 103.9% and 108.7% across three different mixtures. When the measured percentage of specific species was more significant than 14%, the recovery rate was between 77.9% and 106.6%. Linearity analysis revealed an excellent linear correlation between the empty, partial, and full in the HE samples. The AAV samples with as low as 7.4 × 10¹¹ cp/mL AAV could be accurately quantified with SV-AUC. The parameter variable analyses revealed that variations in cell alignment significantly affected the overall results. Still, the detection wavelength of 235 nm slightly influenced the empty, partial, and full percentages. Minor detection wavelength changes showed no impact on the sedimentation coefficient of these species. However, the temperature affected the measured sedimentation coefficient. These results validated the SV-AUC method to quantify AAV. This study provides solutions to AAV empty and full capsid ratio quantification challenges and the subsequent basis for calibrating the AAV empty capsid system suitability substance. Because of the AAV structure and potential variability complexity in detection, we jointly calibrated empty capsid system suitability substance with three laboratories to accurately detect the quantitative AAV empty and full capsid ratio. The empty capsid system suitability substance could be used as an external reference to measure the performance of the instrument. The results could be compared with multiple QC (quality control) laboratories based on the AAV vector and calibration accuracy. This is crucial for AUC to be used for QC release and promote gene therapy research worldwide.
INTRODUCTION
Adeno-associated virus (AAV) is one of the most important vectors in gene therapy because of its high safety, low immunogenicity, long-term stable expression, and good tropism. Formulating gene therapy drugs depending on AAV vectors is a crucial mainstream direction. 1 This includes Glybera, 2 Luxturna, 3 Zolgensma, 4 Roctavian, 5 Upstaza, 6 Hemgenix, 7 and Elevidys. 8 However, severe and life-threatening adverse events have been a concern, particularly the systemic administration of high-dose in the AAV gene therapy (1 × 10¹⁴ vg/kg or higher). 9 The recombinant AAV (rAAV) comprises a virus capsid and a single-stranded or complimentary DNA genome. The rAAV package contains three capsid-packaged DNA fragments: complete capsid-packaged DNA (full), partial capsid-packaged DNA fragments (partial), and empty capsid unpackaged DNA (empty). Because of product-related impurities, concerns are associated with empty and partial virus particles in gene therapy products. These affect the purity and enhance the immunogenicity of the product while competing with the full virus particles for binding receptors on infected cells. This inhibits the transduction of full virus particles, thereby increasing the total virus delivery dosage. 10 Currently, empty capsids have been also discussed as a decoy to decrease the immune response to the AAV product. 11 Therefore, quantitative analysis of these impurities is a crucial quality AAV indicator. Besides, continuous monitoring of empty, partial, and full virus particles enhances the process consistency. 12 –14 Almost no difference exists in particle size among the empty, partial, and full virus particles. Therefore, identifying AAV empty particles, partial particles, and full particles ratios faces many challenges.
The analytical ultracentrifugation (AUC) method has been utilized in protein and DNA analysis. 15 –17 Based on the Svedberg equation and an approximate solution to the Lamm equation, the sedimentation coefficient and percentage of different particles can be distinguished by changing the shape of the boundary region using centrifugal force. 18 During biological macromolecule sedimentation, sedimentation velocity analytical ultracentrifugation (SV-AUC) tracks the boundary region of sample sedimentation. In short, the SV-AUC method enables data collection during sedimentation rather than when it ends. The AAV particles significantly distinguish in sedimentation coefficients based on different packaged DNA fragment sizes. Therefore, the AUC method can accurately differentiate and quantify AAV particles with varying packaging states. Thus, it is the gold standard for identifying AAV empty capsid ratio. 19 We systematically used the SV-AUC method to estimate the AAV empty, partial, and full capsid ratio, including specificity, precision, accuracy, linearity, etc., and promote the quality control of AAV gene therapy drugs. Although many AAV serotypes have diverse gene therapy products developed by various companies, the empty capsid sedimentation coefficient of different AAV serotypes is about 60–65S. 20 However, the AUC system suitability substance for AAV needs improvement. The proposed methodology provides the basis to establish the cross-AAV serotype AUC empty capsid system suitability substance. The potential instrument system deviation between laboratories may be resolved by observing the sedimentation coefficient and fraction difference of empty capsid system suitability substance. This substance can track multiple instrument performance parameters and accelerate the global research and development process of gene therapy drugs.
MATERIAL AND METHODS
Samples and instruments
The rAAV samples, such as the high percentage of full capsid (HF) samples (Fig. 1a), empty capsid (E) samples (Fig. 1b), high percentage of empty capsid (HE) samples, and blank control solutions, were prepared by Shanghai Belief BioMed Technology Co., Ltd. The HF samples produced by triple-transfection method, HEK293 cells were cotransfected using poly-ethyleneimine and a predefined mixture of the three plasmids ITR vector with gene of interest, AAV rep/cap (AAV843, also named XL32.1 21 ) and Ad helper plasmid), and AAV vectors were harvested at 48–72 h post-transfection. Cell lysis solution containing rAAV was clarified by filtration, then the rAAV was purified sequentially by affinity chromatography and anion-exchange chromatography, concentration by ultrafiltration, and diafiltration into phosphate-buffered saline. For the production of empty capsid samples, two plasmids, an AAV rep/cap (AAV843), and Ad helper plasmid were transfected into the HEK293 cells with poly-ethyleneimine. After 48–72 h, the cells were harvested. Cell lysis solution containing empty rAAV was clarified by filtration, then the rAAV was purified by affinity chromatography, concentration by ultrafiltration, and diafiltration into phosphate-buffered saline. These samples were uniformly distributed by the National Institute for Food and Drug Control, China (NIFDC), and the capsid titer was determined by Bio-layer interferometry (BLI). 22
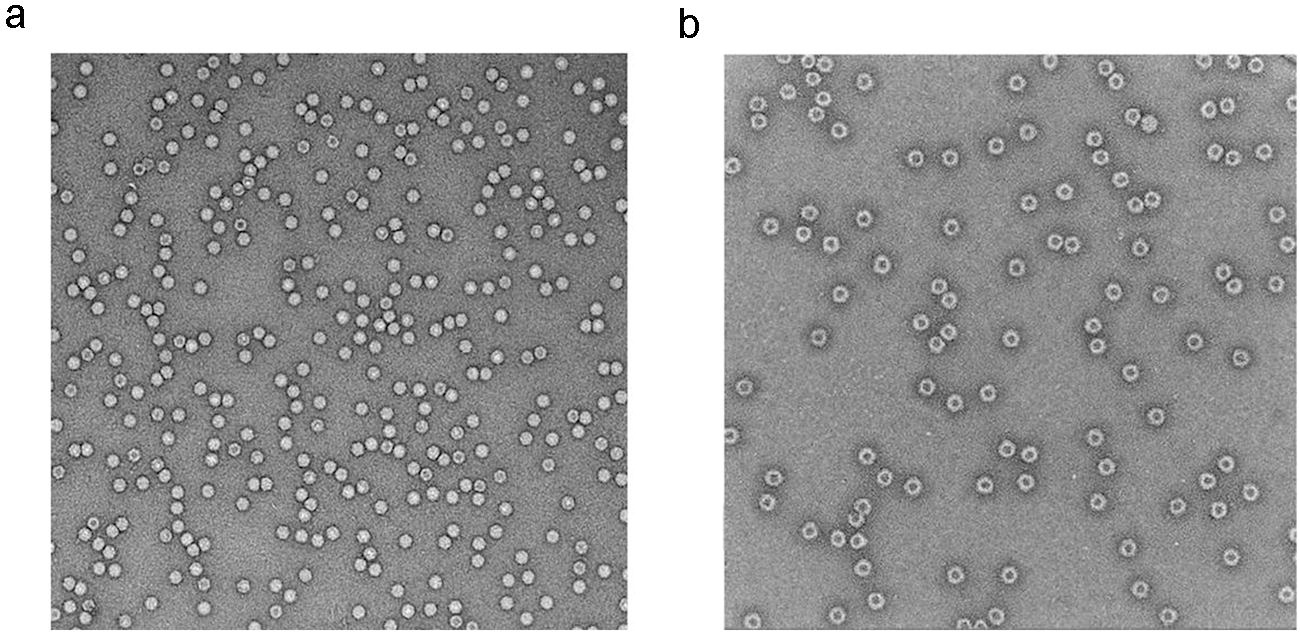
AAV vector quantification by electron microscopy.
The HE samples were obtained by mixing HF and empty capsid samples at a 1:1 ratio. The HF samples, including the empty, partial, and full capsids, showed a titer of about 5.56 × 10¹² cp/mL (
Experimental method
We used a 12-mm charcoal-filled Epon centerpiece (general centerpiece) with a blank control solution and a sample loading volume of 400 and 380 μL, respectively. The experimental temperature was equilibrated for about 1 h and controlled at 20 ± 0.1°C. The AN-50Ti rotor was used, and real-time scanned absorbance data at 16,000 rpm and 230 nm were collected. Once the samples were added into the sample cell, the cell must be matched to within a balancing difference of 0.5 g. Next, the assembled sample cells were loaded and aligned into the AUC rotor, ensuring parallel positioning with the centrifugal force direction. The absorbance of the HF, HE, empty capsid samples, and blank control solutions in the specificity test was detected using the AUC UV-vis absorption detector at 260 and 280 nm. Other testing parameters, including wavelength, temperature, etc., remained unchanged. The empty and full particles could be distinguished using the absorption value (A value) ratio at 260 and 280 nm. The 260/280 value for full AAV particles is 1.4, and 0.6 for the empty AAV particles. 18 The accuracy samples are obtained by mixing HF and empty capsid samples at 1:3, 1:1, and 3:1, respectively. Each sample was tested in triplicate, and the recovery rate was determined. The HE and HF samples with 3.71 × 10¹² cp/mL divided into six aliquots in the intermediate precision experiment were performed by two different analysts on different days. The HE samples were diluted to 5.56 × 10¹² cp/mL (150% AAV), 4.45 × 10¹² cp/mL (120% AAV), 3.71 × 10¹² cp/mL (100% AAV), 2.97 × 10¹² cp/mL (80% AAV), 2.22 × 10¹² cp/mL (60% AAV), 1.11 × 10¹² cp/mL (30% AAV), and 7.4 × 10¹¹ cp/mL (20% AAV) in the linearity analysis. In limit of quantification (LOQ) test, the HE samples were diluted to 7.4 × 10¹¹ cp/mL (20% AAV) and tested. We used different temperatures (19 or 21°C), cell alignments (deviation of 5° to the left or right), wavelengths (225 or 235 nm), and reused samples (after multiple rounds of centrifugation) in the robustness experiment. The empty capsid samples, divided into six aliquots, were tested independently by four analysts in three separate laboratories to establish a system suitability substance.
Data analysis
All the data for each sample with the suffix “RA” were selected and imported into the Sedfit software (sedfit16p36). Next, we selected the Continuous C(s) Distribution Model, followed by inputting the relevant parameters. Moreover, the red line was moved to the peak position of the sample meniscus, checked, and fitted. The bottom was 7.2 cm, and the confidence level was 0.68. The position of the first green line (near the meniscus) was at Meniscus + 0.1 ∼ 0.15 mm, and the second green line (near the Bottom) was at 7.1 cm. RMSD ≤ 0.005 was the best, and ≤0.01 was acceptable. The information on the individual peaks of the fitted spectrum was recorded. Finally, the graphs were plotted and superimposed using GraphPad Prism 9 and GUSSI software.
RESULTS
Confirmation of AAV specificity
For HE and HF samples, 16,000 rpm had better separation than 10,000 rpm and could better differentiate different AAV particles (Supplementary Fig. S1A, B). As the sedimentation coefficient of empty AAV for different serotype ranges between 60 and 65S, 19 peaks 0, 2, and 7 were considered the empty capsid peaks with sedimentation coefficients of 61, 60, and 59S, respectively. The blank control peak is random (Fig. 2a). Comparing the 280 and 260 nm signals revealed that the signal values at peaks 0, 2, and 7 at 280 nm were higher than those at 260 nm. Therefore, peaks 0, 2, and 7 were analyzed as empty AAV (Figs. 2b, c, d).
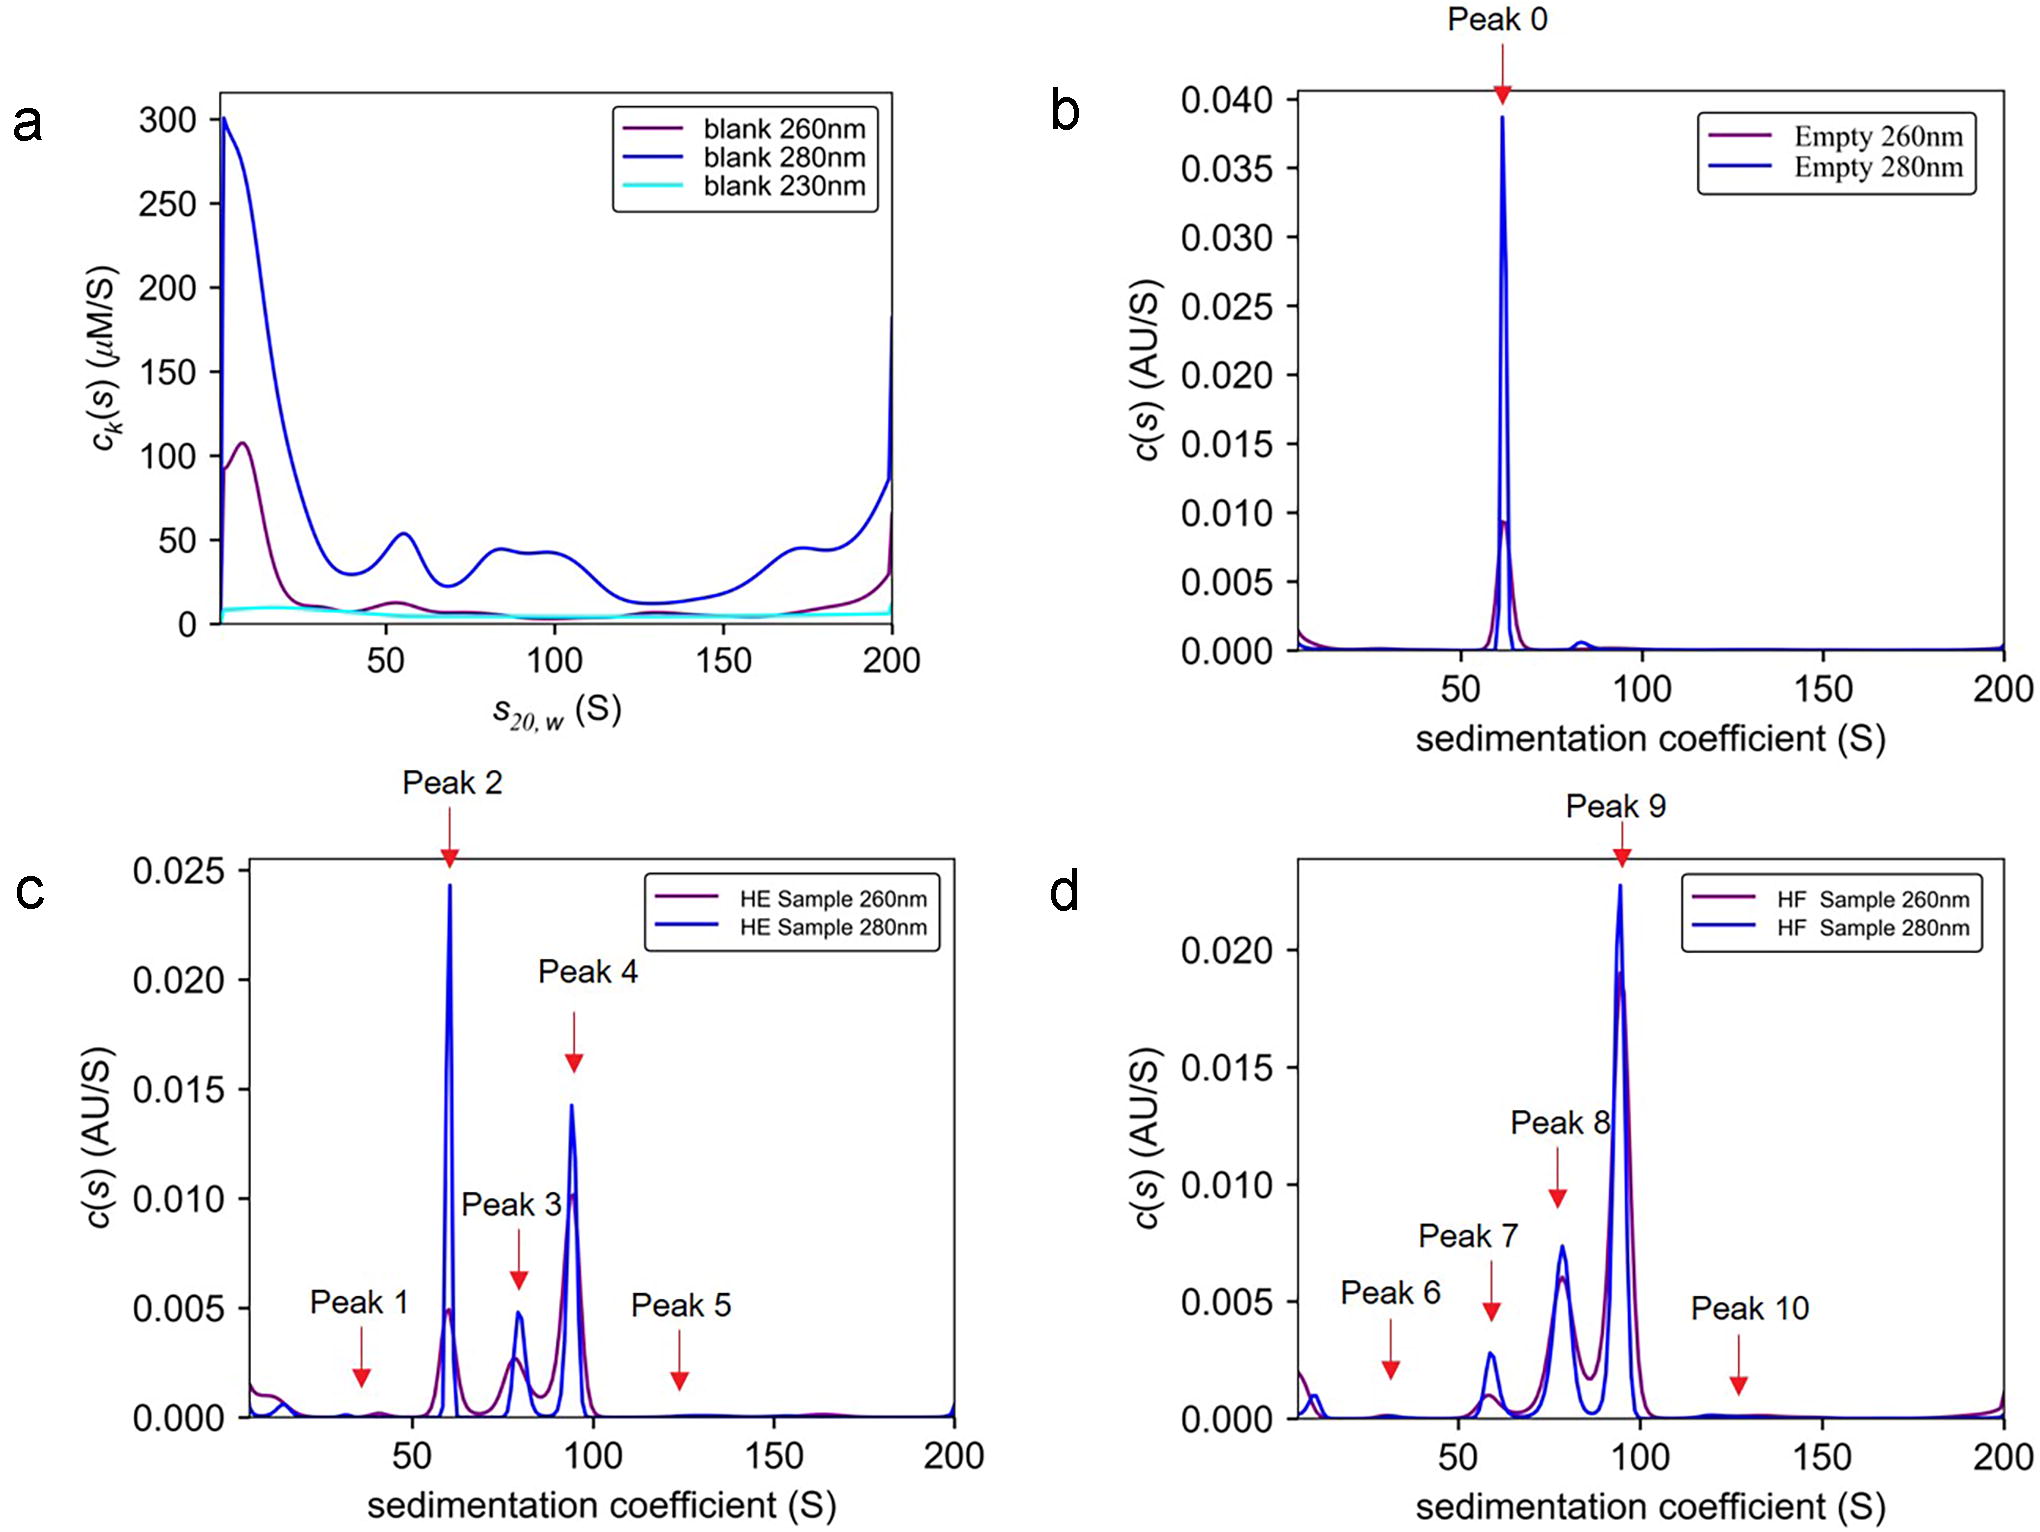
The confirmation of AAV empty particles, partial particles, full particles, and HSCS particles in HE, HF, empty capsid samples, and blank control solutions.
In addition, the sedimentation coefficient size had a linear relationship with the fragment length (y = 0.0074x + b, x is the nt number of the packaged DNA fragment, b is the determined value of the empty capsid sedimentation coefficient, and y is the theoretical sedimentation coefficient of full AAV). 23 The packaged genome length in the HF sample was 4500 nt, and the formula substitution value was approximately 94S. Therefore, the theoretical sedimentation coefficient of full AAV was 94S, and peaks 4 and 9 were full AAV peaks, recording a sedimentation coefficient of 94S. Peaks 3 and 8 (between 60S and 94S) were partial AAV peaks. In contrast, peaks 5 and 10 were high sedimentation coefficient substances (HSCS) (>120S) (Figs. 2a, b, c, and d).
Additional calculation of the absorption ratio at A260/A280 confirmed peaks 0, 2, and 7 as empty AAV particle peaks (A260/A280 = 0.6) and peaks 4 and 9 as full AAV particle peaks (A260/A280 = 1.4) (Table 1). In contrast, peaks having less than 50S were low sedimentation coefficient substances (LSCS). Therefore, the SV-AUC method effectively differentiated among the empty (61S), partial (between 61S and 94S), full (94S), HSCS (>120S), and LSCS (<50S) AAV particles.
The Validation of Empty and Full Particles in Adeno-Associated Virus Samples. Peaks 0, 2, and 7 Demonstrate Empty Particles Peaks (260/280 nm = 0.6). In Contrast, Peaks 4 and 9 Characterize Full Particles Peaks (260/280 nm = 1.4)
HE, high percentage of empty capsid; HF, high percentage of full capsid.
Intermediate precision experiment
Three repeatability experiments were carried out for HE and HF samples (six parallel samples, three days, and two analysts). The repeatability results are represented in Figure 3, and the percentage and sedimentation coefficient consistency of empty, partial, and full in each experimental group was as expected. Notably, the average percentage and SD of empty, partial, and full in HE samples of 18 aliquots was 58.7 ± 0.6%, 14.7% ± 0.7%, and 24.3% ± 0.8%, with an RSD of 1.0%, 4.8%, and 3.2%, respectively. Furthermore, statistical analysis of the 18 intermediate precision results of empty, partial, and full in HE samples indicated average and SD sedimentation coefficients of 60.0 ± 0.2, 81.0 ± 0.4, and 94.8 ± 1.1 (S), with an RSD of 0.4%, 0.5%, and 1.1%, respectively (Supplementary Table S1a). The mean and SD of the percentage of empty, partial, and full for the intermediate precision of the HF sample of 18 aliquots were 3.71 × 10¹² cp/mL, 17.3% ± 0.4%, 31.9% ± 2.4%, and 48.8% ± 2.5%, with an RSD of 2.5%, 7.4%, and 5.0%, respectively. Moreover, the mean and SD of the empty, partial, and full sedimentation coefficients in HF samples were 59.2 ± 0.1, 77.5 ± 0.3, and 92.7 ± 0.9 (S), with an RSD of 0.7%, 0.7%, and 1.3%, respectively (Supplementary Table S1b). Overall, the C(s) distribution diagram superposition of the repeatability results of HE and HF samples indicated good overall data consistency (Supplementary Fig. S2A-F).

The intermediate precision of HE and HF samples.
The RSD could be within 5% when the percentage of specific species, including empty capsid or full capsid, was more significant than 50%. For empty capsid or partial capsid with a percentage of less than 15%, the RSD of the percentage could be within 10%. Therefore, empty/full capsid ratios for HE and HF were consistent.
Accuracy experiment
After mixing the empty capsid samples and HF samples in three different ratios, we performed the SV-AUC experiment. We calculated the theoretical percentage of mixed samples depending on the average percentage and capsid titer of HF and empty capsid samples. The recovery rate is obtained by the measured percentage to the theoretical percentage ratio. The recovery rates of empty particles, partial particles, and full particles in the mix empty capsid samples (E): HF = 1:3 samples were 103.7 − 108.6%, 77.9 − 89.5%, and 104.2 − 106.6%, respectively. The recovery rates of empty particles, partial particles, and full particles in the mix empty capsid samples (E): HF = 2:2 samples were 103.9 − 104.8%, 88.5 − 93.1%, and 97.0 − 100.7%, respectively. Moreover, empty particles, partial particles, and full particles recovery rates in the mix empty capsid samples (E): HF = 3:1 sample were 103.8 − 105.0%, 122.4 − 134.0%, and 68.7 − 78.0%, respectively. The superposition of the C(s) distribution maps from three mixed samples indicated good consistency (Supplementary Fig. S3A-C and Table 2).
Sedimentation Coefficients, Percentages, and Recovery Rates of Adeno-Associated Virus Particles within Three Different Mixed Solutions
Means empty capsid samples.
HF, high percentage of full capsid.
Thus, the accuracy recovery rates of empty particles ranged from 103.9% to 108.7% across three different mixtures. The recovery rate was between 77.9% and 106.6%, with the measured percentage of specific species more significant than 14%. The recovery rate of partial particles and full particles were >110% or <80% since their percentages were <10% in the mix empty capsid samples: HF = 3:1 sample, and the separation of two peaks (partial particles and full particles) was not good.
Linearity analysis and LOQ confirmation
We set the AAV titers in the samples as the abscissa, and the AUC absorption value (A value) of each peak was ordinated to generate a linear graph. The correlation coefficients (R 2) of empty particles, partial particles, and full particles in the HE sample were 0.9992, 0.9985, and 0.9991, demonstrating a significant linear correlation (Figs. 4a, b, c). The superposition of the C(s) distribution diagram of the seven linear results revealed a gradual decline of the signal value of C(s) with a titer decrease (Fig. 4d and Supplementary Table S2a).
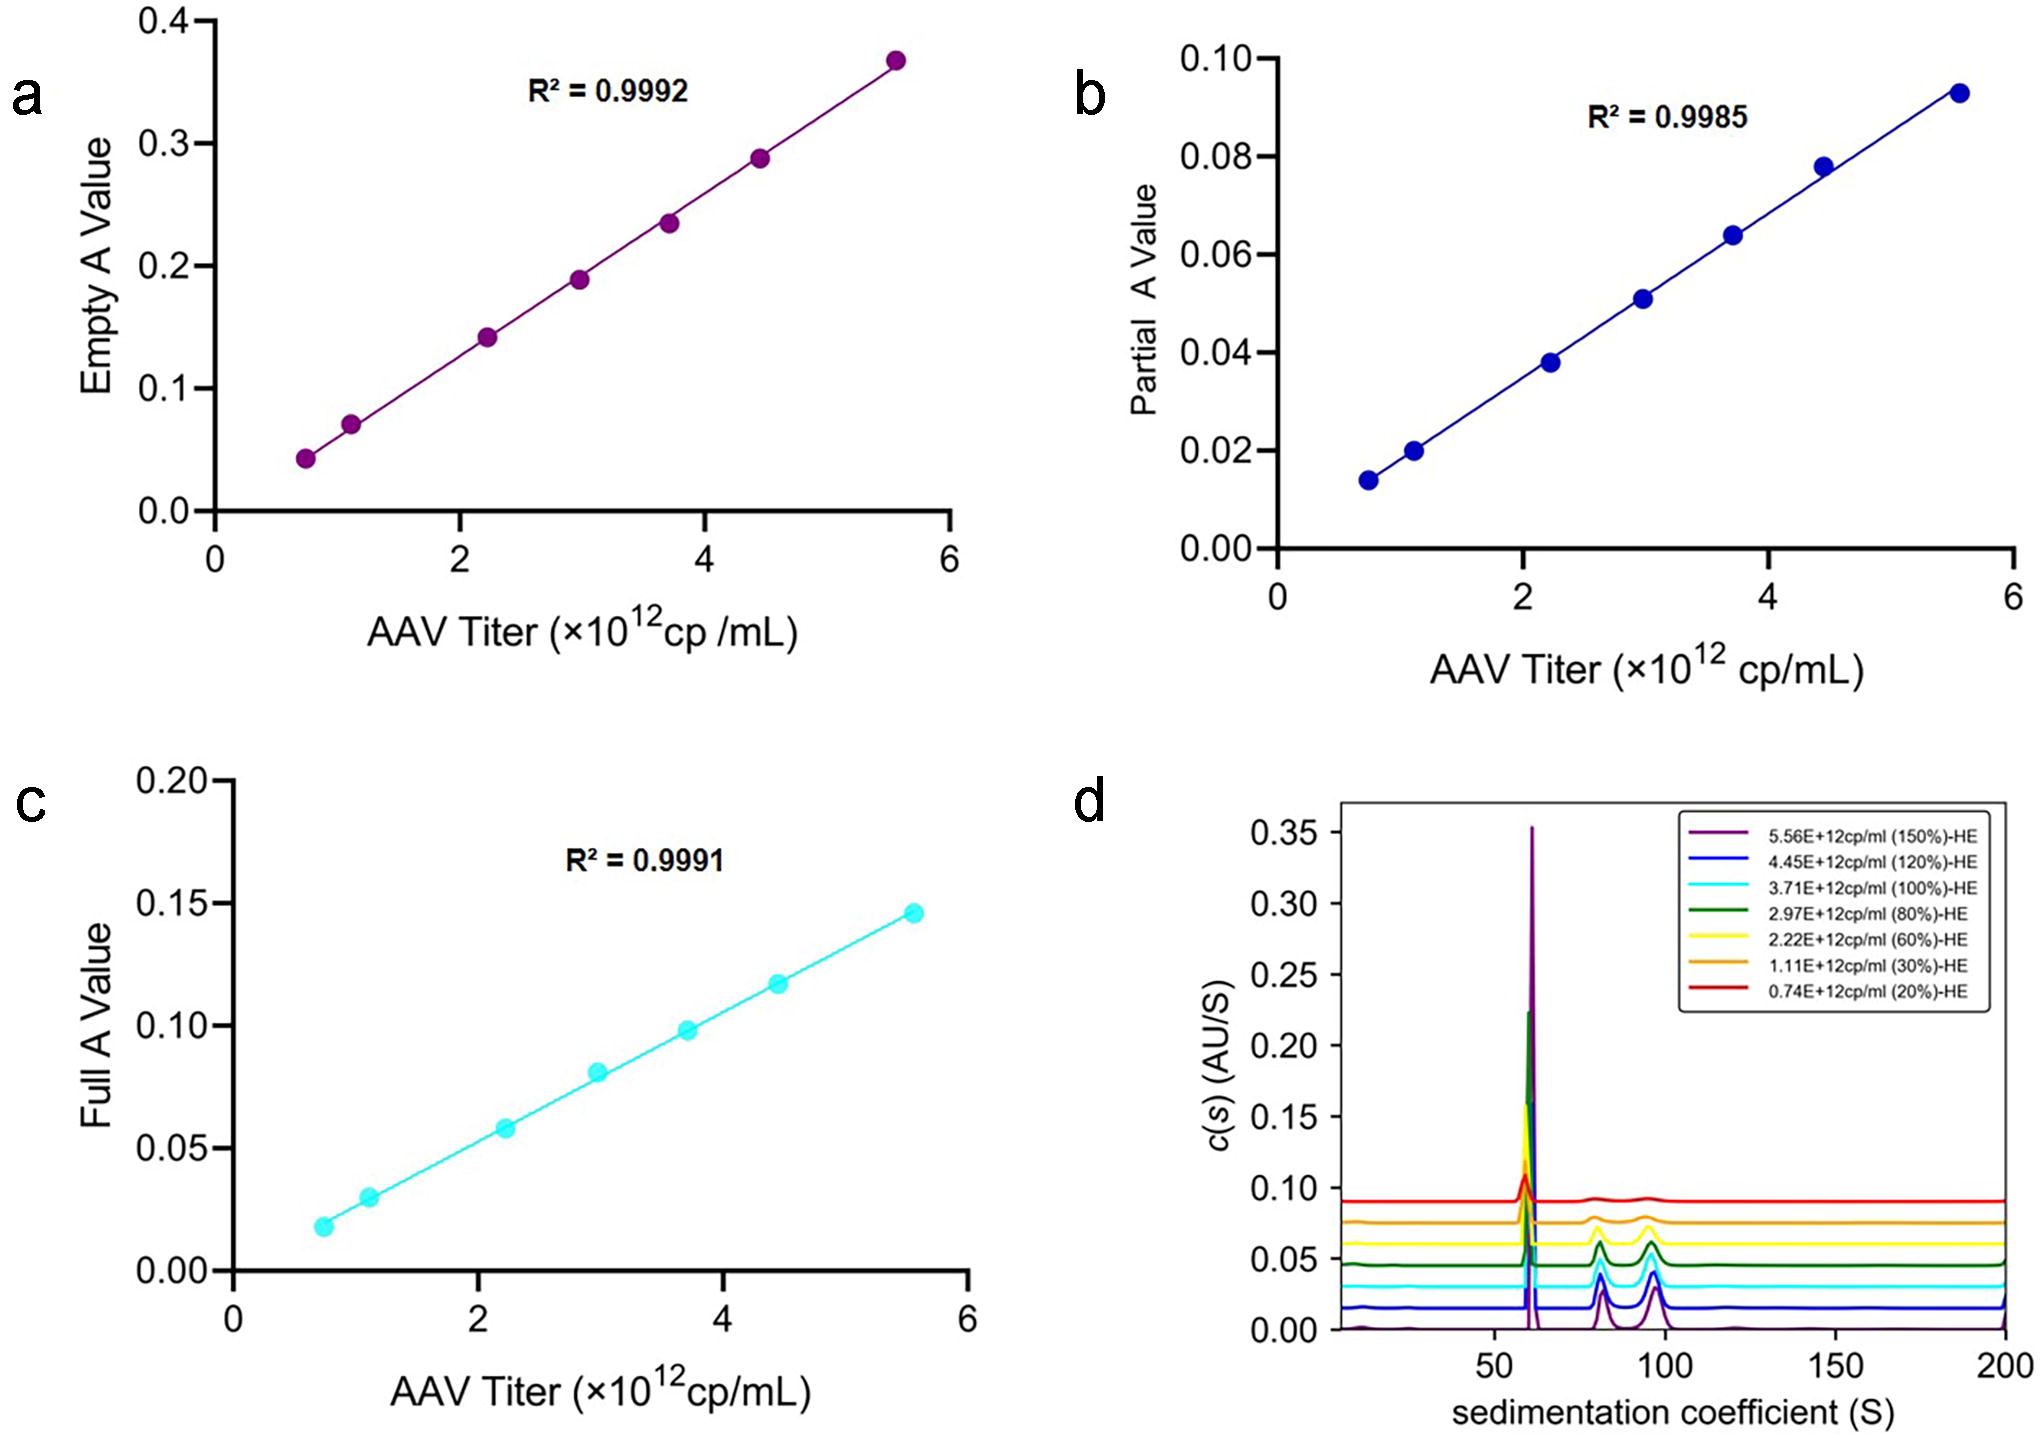
The linearity among various AAV titers of HE samples. The abscissa was the percentage of sample titer, and the ordinates were the AUC A value factors of the empty particles, partial particles, and full particles peaks
We adopted the lower AAV titer of diluted HE samples with a titer of 7.4 × 10¹¹ cp/mL (∼0.078 optical density [OD] at 230 nm) to investigate the LOQ of the SV-AUC method. The average percentage and SD of empty particles, partial particles, and full particles were 56.1% ± 0.6%, 17.5% ± 0.5%, and 22.6% ± 0.5%, respectively, at the rotor speed of 16,000 rpm. In addition, the empty particles, partial particles, and full particles recovery rates were 98.9 − 101.2%, 105.7 − 111.9%, and 90.7 − 94.4%, respectively (Supplementary Table S2b). The superposition of the C(s) distribution diagram revealed good overall data consistency (Supplementary Fig. S4). Empirically, a signal of approximately 0.1 OD can help analyze the sedimentation boundary shape of various species. 24 Therefore, the 7.4 × 10¹¹ cp/mL titer was set as its LOQ, with a similar or a higher level satisfying the detection requirements.
Parameter variables’ analysis
The extent to which the test results were affected was explored through minor test condition changes. We tested HE samples at 19, 20, and 21°C. The percentage and sedimentation coefficient of HE samples detected under three different temperatures are represented in Figures 5a and 5b. The measured value of the sedimentation coefficient becomes slightly larger as the experimental temperature increases. This was reflected within the C(s) distribution diagram (Supplementary Fig. S5C and Supplementary Table S3a). The C(s) distribution diagram superposition of individual groups indicated good data consistency (Supplementary Fig. S5A, B).
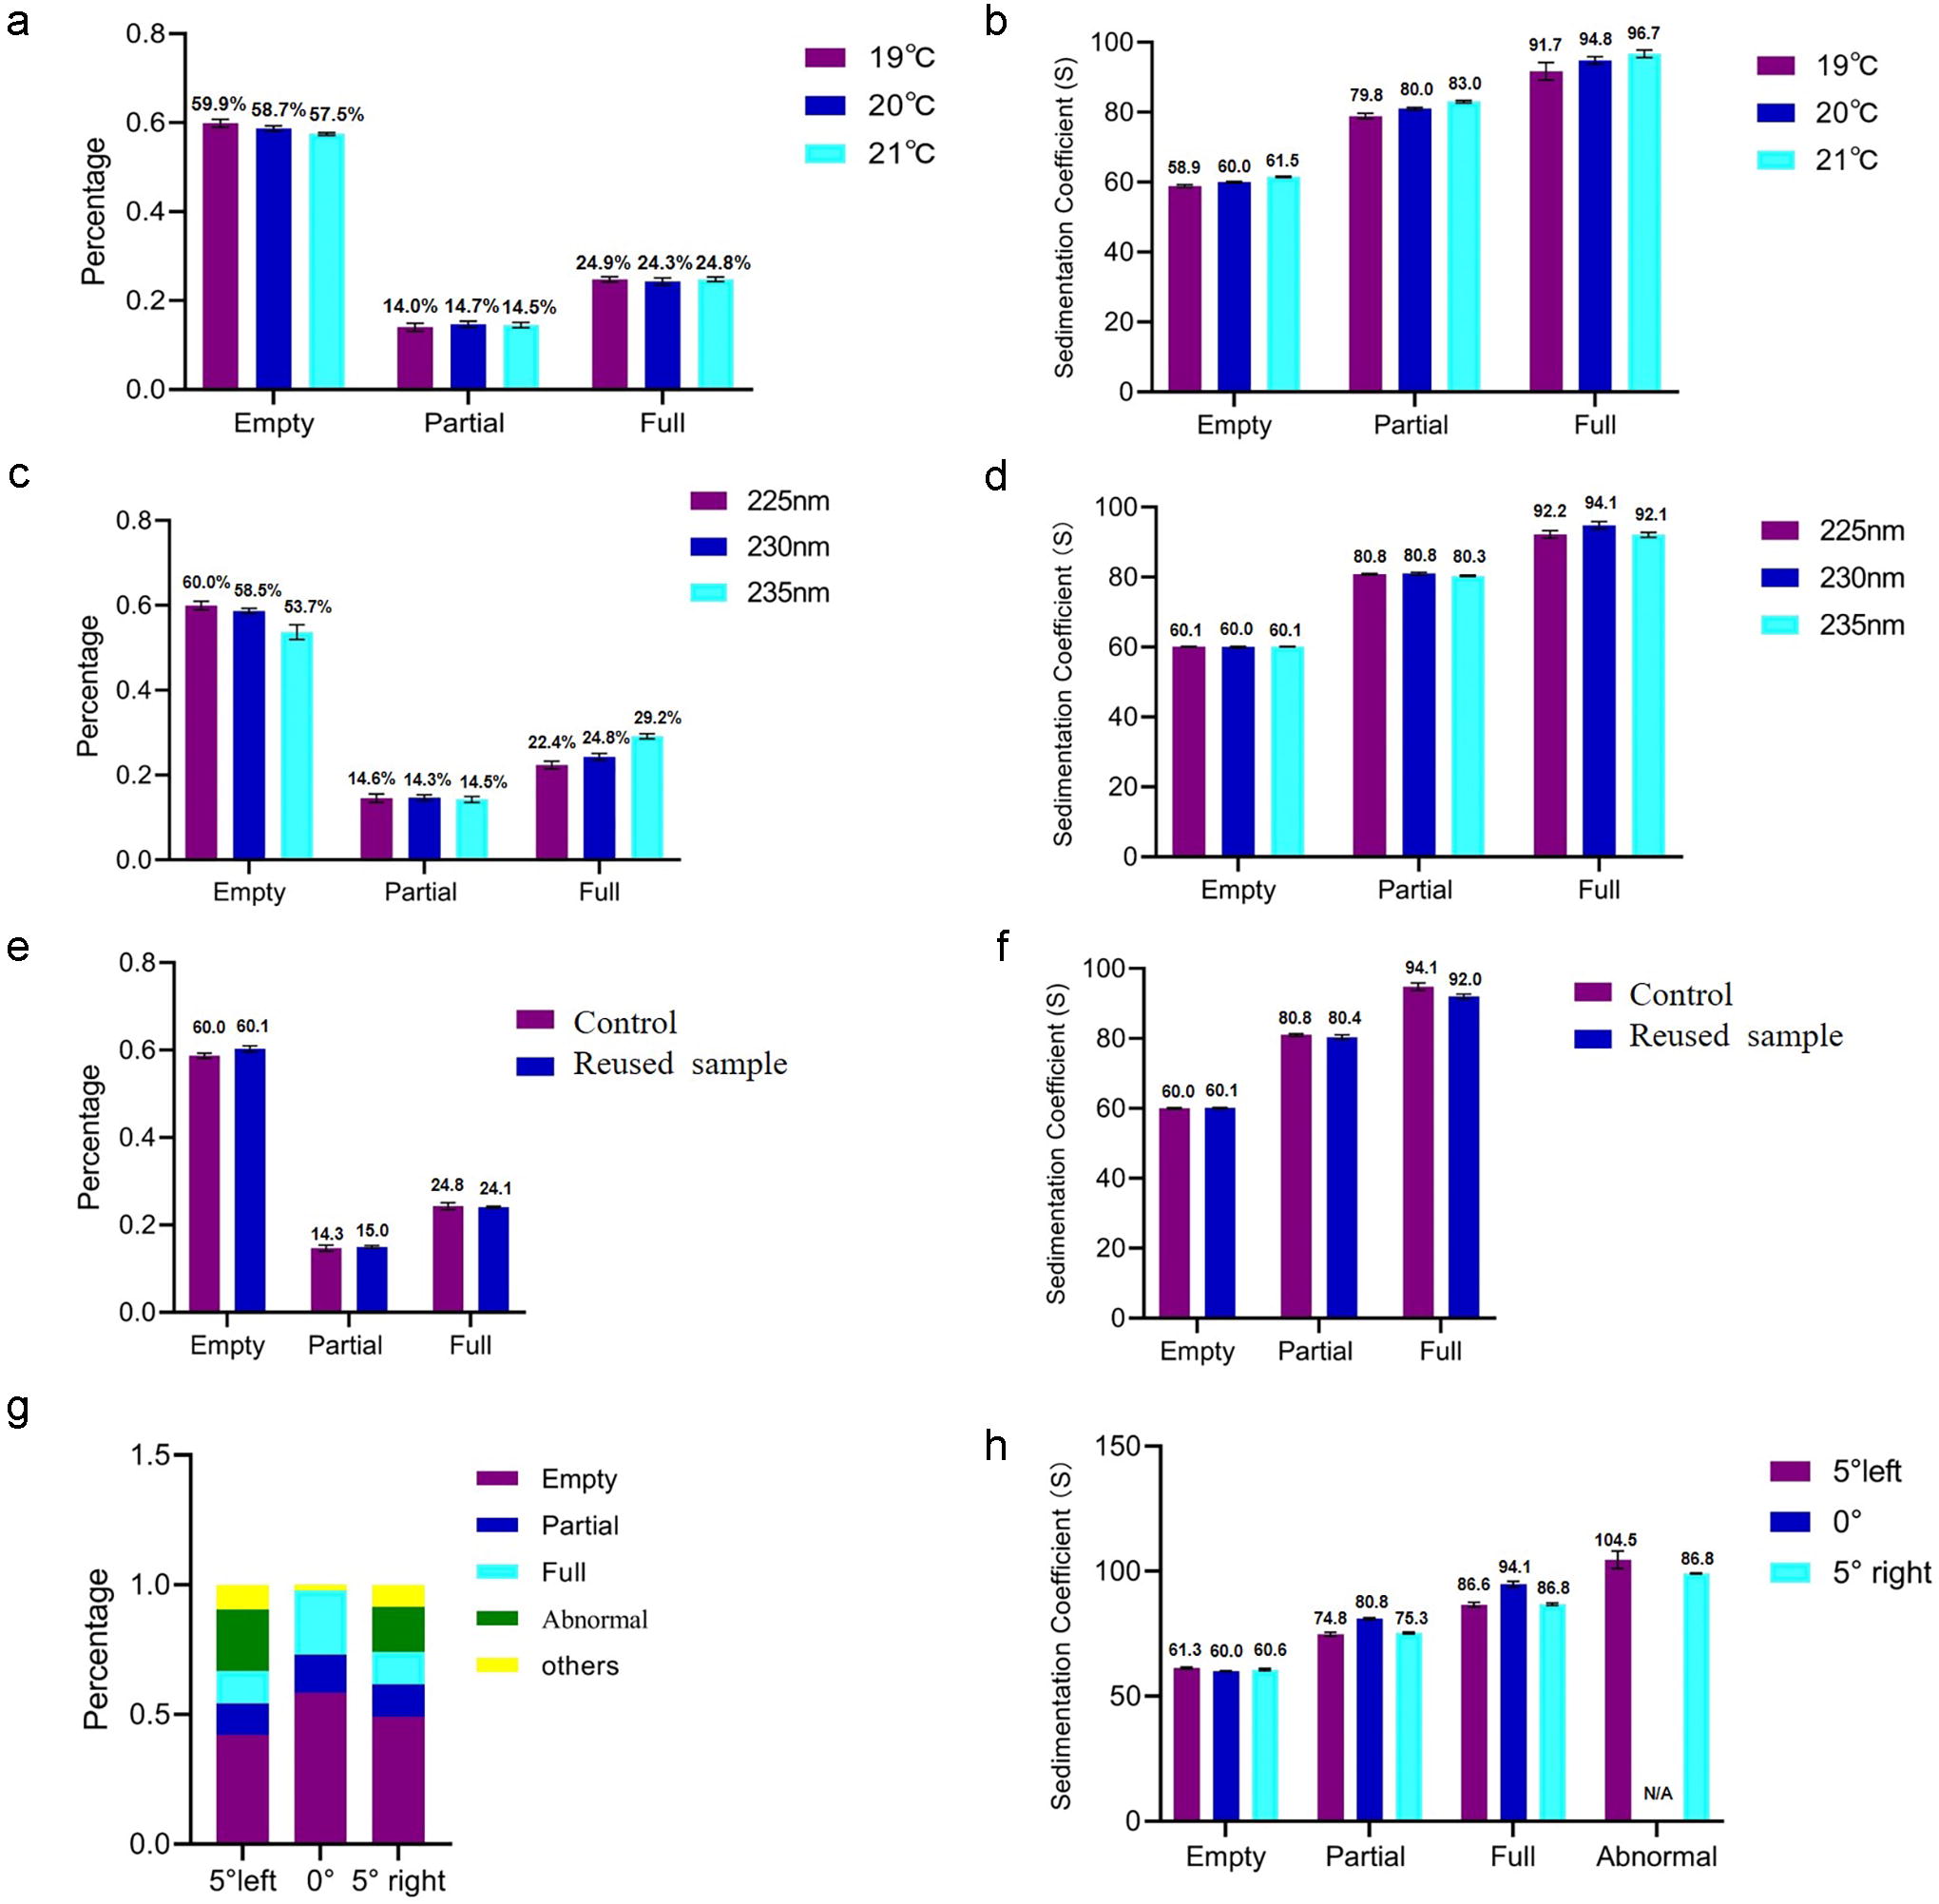
The parameter variables analysis of the AUC-VS method.
We tested HE samples at 225 nm and 235 nm. The average percentage of empty particles, partial particles, and full particles was 60.0%, 14.6%, and 22.4%, respectively, at the detection wavelength of 225 nm. These values were in good agreement with the 230 nm detection results. However, the average percentage of the three species was 53.7%, 14.3%, and 29.2% at 235 nm, with gaps between values and the 230 nm detection results (Figs. 5c, d and Supplementary Table S3b). Furthermore, the C(s) distribution diagram superposition of individual groups indicated good data consistency (Supplementary Fig. S5D, E). Interestingly, testing the recovered samples revealed no change in the percentage (Figs. 5e, f and Supplementary Table S3c). Moreover, the C(s) distribution diagram superposition was excellent (Supplementary Fig. S5F), indicating that the same sample undergoes centrifugation with similar retest results.
We adjusted cell alignment in the rotor deviating 5° to the left or right to investigate the effect on the results. Under poor cell alignment conditions, abnormal peaks appeared (Fig. 5g). The cells deviated 5° to the left, and the mean sedimentation coefficients of empty, partial, full, and abnormal peaks were 61.3, 74.8, 86.6, and 104.5S, respectively. The cells deviated 5° to the right, and the mean sedimentation coefficients of the four species were 60.6, 75.3, 86.8, and 99.1S, respectively (Fig. 5h). Moreover, the appearance of abnormal peaks directly affected the accurate detection of empty particles, partial particles, and full particles. The average percentage of these four species was 42.2%, 12.1%, 12.5%, and 23.8%, respectively, after deviating 5° to the left. When deviated 5° to the left, the average percentage was 49.2%, 12.3%, 12.5%, and 17.4% (Supplementary Table S3d). The abnormal results of the three parallel samples were highly consistent, whether the cell alignment was left or right (Supplementary Fig. S5G, H). However, the C(s) distribution diagram superposition of three cell alignments indicated poor data consistency (Supplementary Fig. S5I).
We analyzed the effect of minor parameter changes in sample volume, and the Quartz window replaced the sapphire component on the test results. According to these minor changes, the results showed good consistency in the sedimentation coefficient and percentage (unpublished data).
Collaborative calibration of system suitability substance
We calibrated a system suitability substance using the SV-AUC method across multiple laboratories to ensure its accuracy and confirm the system suitability. The system suitability substance was uniformly distributed by the National Institute for Food and Drug Control, China (NIFDC) among three laboratories and four analysts. The results of four repeatability experiments are shown in Figure 6, and the overall percentage and sedimentation coefficients showed excellent consistency. The average percentage of the 24 aliquots of empty particles with 3.71 × 10¹² cp/mL was 95.0% ± 2.6%, with an RSD of 2.7% and an average sedimentation coefficient of 61.4S ± 0.4S (Supplementary Table S4). The SV-AUC is a candidate method for the release testing of empty/full capsid ratios, and the system suitability substance calibration further improved the QC arsenal.
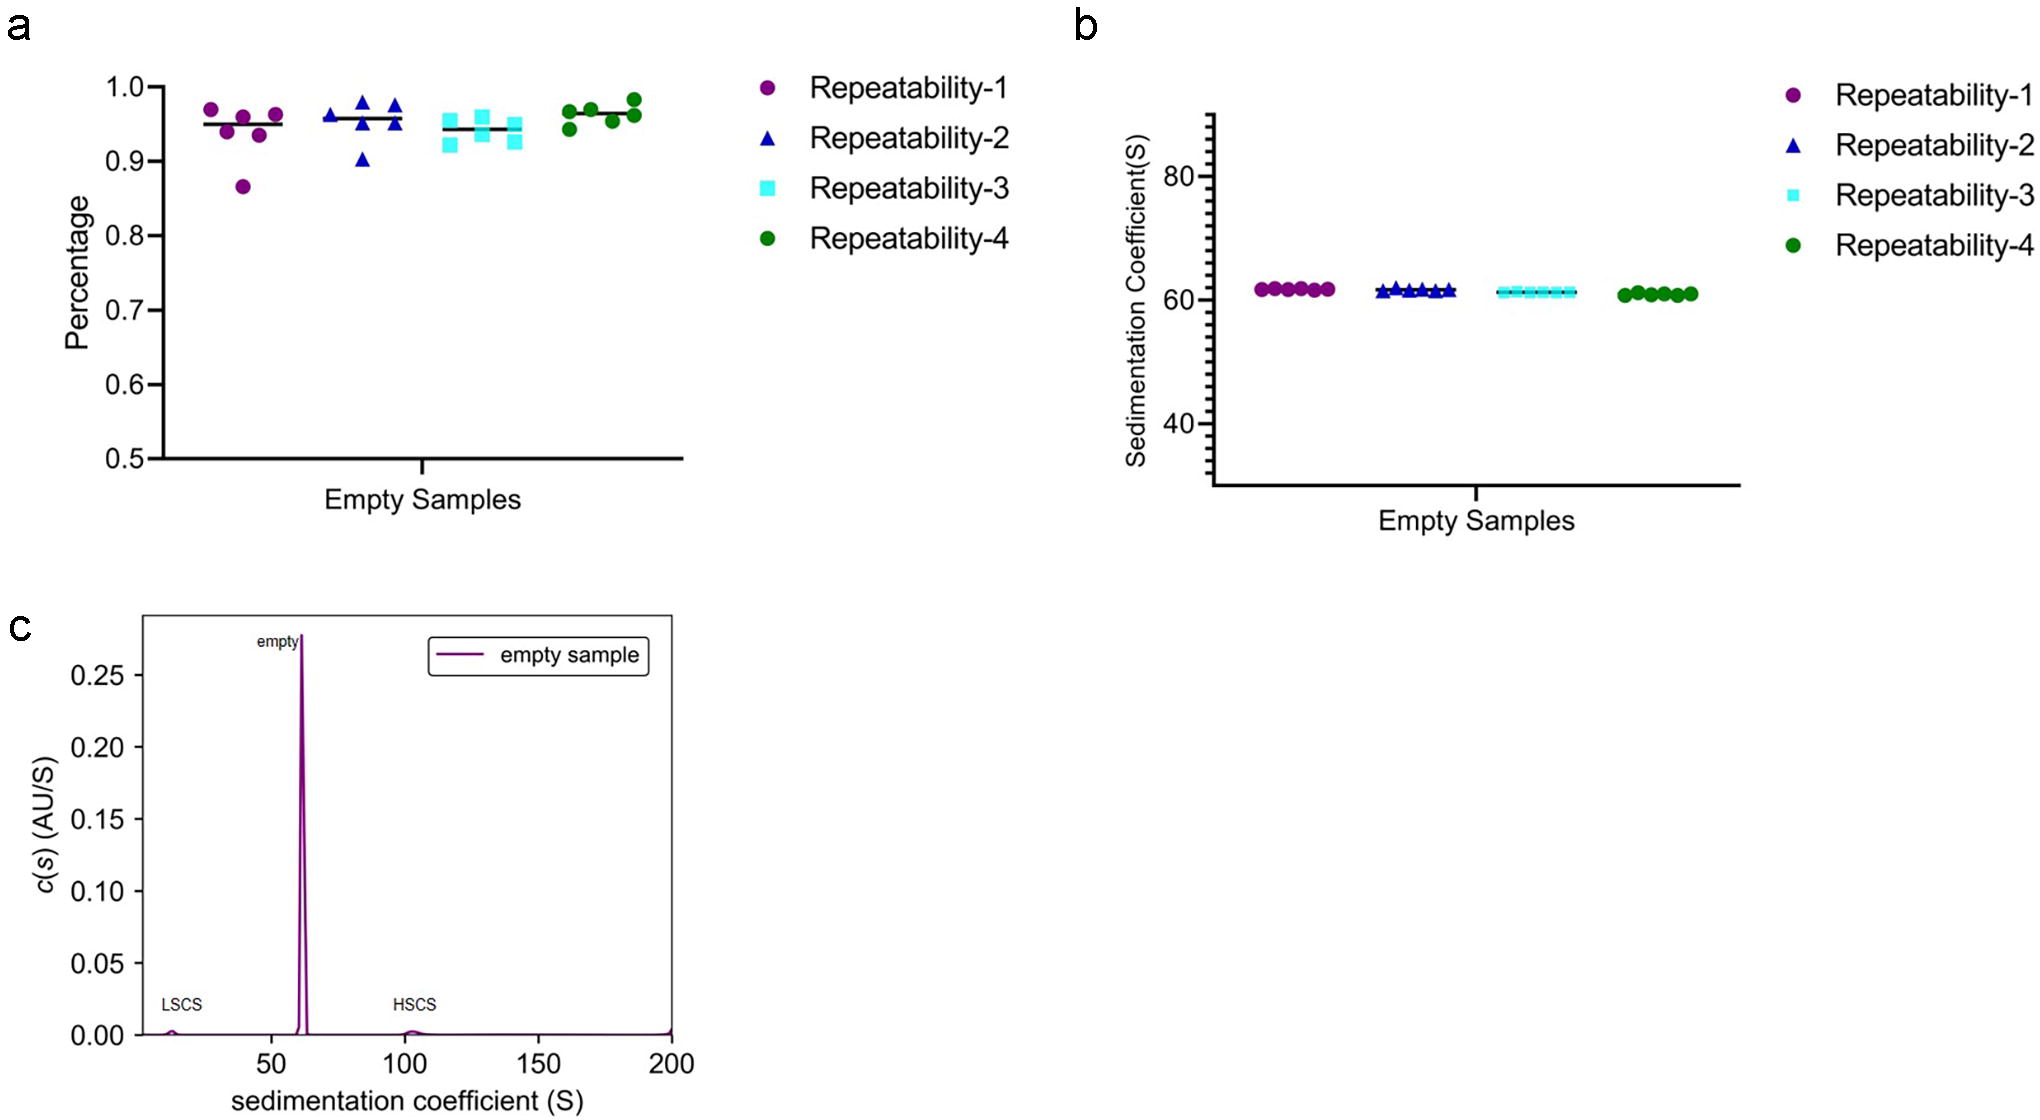
Four analysts collaboratively calibrated the system suitability substance across three laboratories.
DISCUSSION
This study is the systematic methodological validation of SV-AUC for empty/full capsid ratios of AAV. The study provides a basis for analyzing these ratios in gene therapy products, establishing AAV empty capsid system suitability substance, and accelerating the research of gene therapy drugs. The AAV empty capsid system suitability substance could become an external reference to measure the instrument’s performance. The results can be compared with multiple QC laboratories depending on the AAV vector and calibration comparison accuracy. Potential challenges can be overcome, although multi-instrument comparison deviations appear stochastic. For a given instrument, they are systematic, with the results being very similar across repeated experiments. 25 In the protein field of SV-AUC, BSA was used as a reference for multilaboratory comparison. The sedimentation coefficient repeatability in the same instrument for the same sample and the reproducibility between different instruments and laboratories were better than 1%, consistent with the calibration results of the AAV empty capsid system suitability substance. 26 The percentage of SV-AUC repeatability data was slightly better than that of the AAV empty capsid system suitability substance at small protein fractions such as BSA. The reason could be the spatial structure complexity of the AAV particle, employing and highlighting the importance of AAV external reference to ensure SV-AUC method reliability of system suitability. Furthermore, the system suitability substance could be performed periodically after routine maintenance, instrument service, or repair.
According to the sedimentation velocity formula and the Svedberg equation, the SV-AUC resolution primarily depends on the difference between the sedimentation coefficients of the particles. This is also associated with the square of the centrifugal speed. 27 In short, high speed provides a better resolution of different particles. We compared the separation of HE and HF samples at 10,000 rpm and 16,000 rpm, respectively, and observed that 16,000 rpm was more suitable for multicomponent separation. However, we should simultaneously consider the relationship between particle separation and data scans when setting an appropriate rotor speed. A high speed translates to a shorter sedimentation process and data collection time. We adopted 16,000 rpm to explore the AAV particles of empty, partial, full, and HSCS to better understand the AAV product. We also recommend a higher speed (16,000 rpm–20,000 rpm or higher) to explore AAV particles, particularly during the early product development stage. This process is critical to remove product-related impurities. There is no or low ratio of empty and partial AAV particles in the later stages of product development. Thus, a slightly lower test speed could be used since more samples could be detected simultaneously.
We detected the absorbance values of the same sample at 260 and 280 nm. The C(s) signal of the empty and full at 280 nm is higher than at 260 nm, indicating which peak is empty particles. The empty and full particles peaks are also determined using the 260/280 ratio absorption values. 19,23 In addition, the sedimentation coefficient of full particles is calculated using the linear calculation formula depending on the therapeutic gene fragment length. Moreover, the fragment length is reversely determined using the sedimentation coefficient to estimate the AAV package heterogeneity. 23
We mixed empty capsid samples and HF samples based on the different ratios and calculated the empty particles, partial particles, and full particles recovery rates, which was as expected. The intermediate precision results of HE and HF samples showed good consistency. The linearity study revealed an excellent linear correlation of empty particles, partial particles, and full particles correlation coefficients in HE samples. The sedimentation coefficient values of AAV were slightly smaller after serial dilution, possibly due to hydration. The LOQ was 7.4 × 10¹¹ cp/mL, and the titer could satisfy the requirements of most AAV quantifications. Sedfit will be prone to form a false peak during low titer. The measured sedimentation coefficient value changes slightly when the temperature is minimally adjusted. This is primarily due to the viscosity and density of the solution change because of varying temperatures.
The percentage of empty particles and full particles changes slightly in contrast to 230 nm using the wavelength of 230 ± 5 nm to detect AAV. The overall test result of 225 nm is closer to 230 nm than 235 nm. Meanwhile, there are certain advantages of using 230 nm for AAV detection, including the high absorption of AAV samples at 230 nm, thereby detecting lower AAV titers. In addition, AAV capsid absorption is strong at 230 nm, but nucleic acids are comparatively weak. The genome is packaged in the capsid, providing some shielding effect for nucleic acids. Therefore, DNA absorbance on AAV at 230 nm can be significantly underestimated. Hence, 230 nm can identify the empty/full capsid ratios without tedious alteration. Besides, the percentage detected at 230 nm is consistent with the corrected results at 280 nm. 28 Thus, 230 nm is a frequently used wavelength in AUC experiments corresponding to a bright Xenon flash lamp emission spectrum peak. The lamp intensity has its peak at 230 nm. 29 The lamp intensity spectrum should be checked periodically for intensity drops, as oil vapor dirt on the diffusion pump can gradually accumulate on the xenon flash. The optics must be cleaned when the intensity becomes low, as indicated in the AUC Service Manual. 30
A slight deviation of 5° to the left or right in the cell alignment within the rotor affects the overall results. A deviation in the alignment angle enhances the HSCS percentage, affecting the relative percentage of other AAV components. 28,31 Mechanical tools, including Spin CAT manufactured by Spin Analytical (South Berwick ME 3908 USA), relevant and customized tools, 32 or corresponding optical alignment tools can help align. 33 Therefore, the data consistency is improved by alignment using related tools. 31,34
In terms of sample volume demand, the SV-AUC methodological validation sample consumption is relatively high; using reused samples may save the overall sample consumption. Our study tested the reused samples and observed that the percentage did not change, indicating the ability to conduct repeated re-tests using AUC. In addition, Takahiro Maruno et al. described that the BS-AUC method could decrease the overall number of samples required for AAV detection to 1/50 of SV-AUC samples at 230 nm, 35 which could save more samples.
CONCLUSIONS
The AAV empty/full capsid ratio is systematically validated depending on SV-AUC. Moreover, the AAV empty capsid system suitability substance could become an external reference to determine the performance of the instrument. This is a significant milestone for QC release and is crucial for promoting AAV gene therapy development.
AUTHOR DISCLOSURE
The authors have declared no conflict of interest.
FUNDING INFORMATION
This work was financially supported by the Non-profit Central Research Institute Fund of the Chinese Academy of Medical Sciences (2023-PT350-01), the National Key R&D Program of China (2023YFC3403305), and the National Drug Standard Improvement Project of China (2024S14).
SUPPLEMENTARY MATERIAL
Supplementary Figure S1
Supplementary Figure S2
Supplementary Figure S3
Supplementary Figure S4
Supplementary Figure S5
Supplementary Table S1
Supplementary Table S2
Supplementary Table S3
Supplementary Table S4
References
Supplementary Material
Please find the following supplemental material available below.
For Open Access articles published under a Creative Commons License, all supplemental material carries the same license as the article it is associated with.
For non-Open Access articles published, all supplemental material carries a non-exclusive license, and permission requests for re-use of supplemental material or any part of supplemental material shall be sent directly to the copyright owner as specified in the copyright notice associated with the article.