
Abstract
A potential therapeutic approach for cancer treatment is target oxidative phosphorylation and glycolysis simultaneously. The matrix protein of vesicular stomatitis virus (VSV MP) can target the surface of mitochondria, causing morphological changes that may be associated with mitochondrial dysfunction and oxidative phosphorylation inhibition. Previous research has shown that mitochondrial abnormalities can direct glucose metabolism toward glycolysis. Thus, after treatment with VSV MP, glycolysis inhibition is necessary to completely block glucose metabolism and eradicate cancer. Here, to inhibit glycolysis, the 2-deoxy-D-glucose (2-DG), a synthetic glucose analog was used to combine with VSV MP to treat cancer. This study aims to determine how VSV MP affects the glucose bioenergetic metabolism of cancer cells and to evaluate the synergistic effect of 2-DG when combined with VSV. Our results indicated that in U87 and C6 glioblastoma cell lines, VSV MP caused mitochondrial membrane potential loss, cytochrome c release, and glucose bioenergetics metabolism reprogramming. When combined with 2-DG, VSV MP synergistically aggravated cell viability, apoptosis, and G2/M phase arrest. Meanwhile, the combination therapy exacerbated ATP depletion, activated AMPK, and inhibited mammalian target of rapamycin signaling pathways. In addition, 2-DG treatment alone induced autophagy in glioblastoma cells; however, VSV MP inhibited the autophagy induced by 2-DG in combined treatment and finally contributed to the enhanced cytotoxic effect of the combination strategy in U87 and C6 cancer cells. In the orthotopic U87 glioblastoma model and subcutaneous C6 glioblastoma model, the combined treatment led to significant tumor regression and prolonged survival. A potent therapeutic approach for treating glioblastoma may be found in the combination of VSV MP and glycolytic inhibitors.
INTRODUCTION
Vesicular stomatitis virus (VSV) is an enveloped single-stranded RNA virus belonging to the Rhabdoviridae family. Because of its capacity to selectively replicate and destroy tumor cells, VSV has been proposed as an oncolytic virus for antitumor treatment. 1,2 In the absence of other viral components, the matrix protein (MP) was assembled independently of VSV and induced cytopathogenic effects. MP of VSV not only can interact with Rae1-Nup98 complexes and subunit of transcription/repair factor TFIIH to suppress the beta interferon gene and antiviral genes 3 –5 but also initiated apoptosis via the mitochondria-associated (intrinsic) pathway 6,7 ; however, the activation mechanism is still not fully understood.
Previous studies have revealed a mitochondrial-targeting motif within the VSV MP, which is caused by the N terminus of MP targeting the mitochondrial surface. 8 This interaction may change the mitochondrial shape and impact the organelle’s ability to carry out oxidative phosphorylation and other key bioenergetic functions of the cell. 8 –10 In many cancer cells, mitochondrial defects can alter glucose metabolism toward glycolysis. 11 –16
Glioblastoma is a highly therapy-resistant cancer with an intense proliferation rate in the brain. 17,18 Patients with glioblastoma have an overall survival of only 1–2 years after diagnosis. 17,18 To meet their great metabolic needs, some glioblastoma cells harbor super enhancers that act on genes encoding enzymes or transporters involved in glycolysis, oxidative phosphorylation, the pentose phosphate pathway, and fatty acid synthesis. 19,20 In response to energy-related demands and microenvironmental changes, glioblastoma cells can flexibly switch between mitochondrial respiration, glycolytic metabolism, and other metabolic processes, and therapies targeting only one metabolic pathway are typically ineffective at killing these cells. 19,21,22 In this context, targeting multiple core metabolic systems simultaneously may potentially reduce resistance mechanisms. Therefore, simultaneous targeting of oxidative phosphorylation and glycolysis may represent a potential cancer therapy. 23,24
The VSV MP can target mitochondria; thus, we investigated the combination of the VSV MP with glycolysis-targeted drugs. The molecule 2-deoxy-D-glucose (2-DG) is a frequently used antiglycolytic agent. When phosphorylated by hexokinase, 2-DG forms the nonhydrolyzable substrate 2-DG-P and subsequently accumulates in cells and further inhibits glycolysis and restricts glutamine utilization. 24 –27 Inspired by these investigations, we hypothesize that VSV MP can target mitochondria and promote glycolysis. Combined VSV MP with 2-DG may be an effective approach for inhibiting bioenergetic and biosynthetic processes in some types of cancer cells. Thus, we verified the hypothesize to investigate the effects of VSV MP and 2-DG combination treatment on the glioblastoma U87 and C6 cancer cell lines. Meanwhile, we explore whether VSV MP has the potential to alter the glucose metabolism. If so, it is necessary to further explore the mechanism of VSV MP in altering glucose metabolism and clarify the pathways of 2-DG when synergetic with VSV MP. This work may provide a new option for glioblastoma treatment.
MATERIALS AND METHODS
Cell cultures and chemicals
The human kidney embryonic 293 cell line, rat glioblastoma cell line C6, and the human glioblastoma cell line U87 were purchased from the American Type Culture Collection in Rockville. All cells were cultured in Dulbecco’s modified Eagle’s medium (DMEM; D5796, Merck) containing 10% fetal bovine serum (FBS) and antibiotics (penicillin at 100 U/mL and streptomycin at 100 mg/mL). The cells were maintained at 37°C in a humidified environment supplemented with 5% CO2. 2-DG (Sigma-Aldrich) was dissolved in culture media, and PX-478 (Med Chem Express) was dissolved in dimethyl sulfoxide at indicated stored concentration.
Animal
The 6–8 weeks old, female NOD-Prkdc scid IL2rg tm1 /Bcgen (B-NDG) mice were purchased from Biocytogen Inc. The 6-week-old male Wistar rats weighing 250 ± 10 g were purchased from Beijing Vital River Laboratory Animal Technology Company. All animals were fed and bred in a specific pathogen-free environment. All animal experiments were performed according to the animal health care regulations of the ethics committee of Sichuan University.
Antibodies
The following antibodies used in this study were purchased from Cell Signaling Technology: anti-cyclin A2, anti-p-cdc2, anti-cyclin B1, anti-cleaved caspase-3, anti-cleaved PARP, anti-Caspase-3, anti-PARP, anti-p-AKT, anti-AKT, anti-p-ERK, anti-ERK, anti-Cytochrome c, anti-Glut1, anti-LDHA, anti-Hexokinase II, anti-PKM2, anti-HIF-1α, anti-AMPK α, anti-p-AMPK α, anti-mTOR, anti-p-mTOR, anti-p-4EBP1, anti-Beclin 1, and anti-LC3A/B. The anti-p62 antibody was purchased from Abcam, and the monoclonal anti-β-actin antibody was purchased from Sigma. The details of these antibodies were listed in Supplementary Table S3.
Plasmid construction and detection of the expression of VSV MP
As per previous description, the plasmid expression MP of VSV (named VSV MP) was constructed. 28 Briefly, we first amplified the complementary DNA (cDNA) clone encoding VSV MP by PCR, next digested cDNA with BamH1/EcoR1, and then inserted DNA into pcDNA3.1 to generate VSV MP. The pcDNA3.1 plasmid without VSV MP-cDNA was constructed as negative control. The plasmid and liposome were prepared as described previously. 29,30 We transfected the empty plasmid pcDNA3.1 or VSV MP-cDNA-bearing plasmid to U87, C6, and 293 cells as the previous study described in our laboratory. 31 Twenty-four hours after transfection, the expression of VSV MP was examined by reverse transcription-PCR (RT-PCR) and Western blot analysis. 30 The in vivo expression of VSV MP was determined by immunostaining according to the previous study. 28
Orthotopic glioblastoma model
The B-NDG mice were orthotopically implanted with 1 × 10⁴ U87 cells. Tumor burden was evaluated by in vivo bioluminescence imaging after 4 days of tumor implantation (day 0). Animals with success tumor inoculations were randomly grouped into different groups, and all mice were treated from day 0. In different groups, animals were treated with 0.9% normal saline (NS), 50 μg empty plasmid pcDNA3.1/250 μg liposome complexes (e–p), 2-DG (1 g/kg), 50 μg plasmid carrying VSV MP-cDNA/250 μg liposome complexes, or combined with 2-DG (1 g/kg) (VSV MP + 2-DG). The liposome mixture and NS were injected into mice via the tail vein twice per week for 3 weeks, whereas 2-DG was administered daily through an intraperitoneal injection for the duration of 3 weeks as the therapeutic process of xenograft model. To enhance the infection of VSV MP, focused ultrasound (FUS) was used to open the blood–brain barrier (BBB) to fascinate VSV MP crossing. When liposomal mixture was injected, mice were immediately treated with FUS to the brains at the condition of 500 kHz at 0.5 MPa for 60 s. Tumor burden was monitored every 10 days from the first treatment.
For another model, mice were orthotopically implanted with 1 × 10⁴ U87 cells. In total, 50 μg plasmid carrying VSV MP-cDNA/250 μg liposome complexes was administrated via tail vein after 4 and 7 days of tumor inoculation. FUS was used to help liposome cross the BBB, whereas mice without FUS exposure were used as control to test the efficiency of drugs delivery. Next, mice were sacrificed after 7 days of first treatment, the orthotopic tumors were collected, and total RNA was extracted. The mRNA level of VSV MP was detected by quantitative RT-PCR. Primers used were listed as follows: forward: 5′-CGCGGATCCATCATGAGTTCCTTAAAGAAG-3′; reverse: 5′-CGGAATTCTCATTTGAAGTGGCTGATAGAATCC-3′.
Xenograft model
Wistar rats were administered an injection of 1 × 10⁶ C6 cells resuspended in phosphate-buffered saline (PBS) containing 50% Matrigel (BD Biosciences) in the right dorsal flank. All animals were divided into different groups randomly when tumor volume reached 50–100 mm3. Ten days later, animals were treated with 0.9% NS, 50 μg empty plasmid pcDNA3.1/250 μg liposome complexes (e–p), 2-DG (1 g/kg), 50 μg plasmid carrying VSV MP-cDNA/250 μg liposome complexes, or combined with 2-DG (1 g/kg) (VSV MP + 2-DG). The liposome mixture and NS were injected into mice via the tail vein twice per week for 3 weeks; meanwhile, 2-DG was administered daily through an intraperitoneal injection or the duration of 3 weeks as the therapeutic process of xenograft model. The tumor sizes were evaluated every other day. Tumor sizes were calculated using the formula A×B2×0.5236 (A, length; B, width; both measured in millimeters). Daily checks were made for adverse reactions, including diarrhea, anorexia, cachexia, skin ulcers, and toxic death. If it was expected that the mice or rat would become morbidly ill quickly, they were killed by cervical dislocation in accordance with animal ethics guidelines.
Cell viability assay
Cells were seeded in 96-well plates at a density of 5 × 10⁴ and cultured for 24 h in a medium containing 10% FBS in a volume of 100 μL. The cells were pretreated with NS, e–p, or VSV MP. Following transfection for 6 h, the media was replaced with new media containing 2-DG (5 mM) or not. After the indicated time, the medium was replaced and 20 µL of a 5 mg/mL solution of 3-(4,5-dimethylthiazol-2-yl)-2,5-diphenyl tetrazolium bromide (MTT) (Sigma-Aldrich) was added. After incubation for 4 h at 37°C, 150 µL of dimethyl sulfoxide was added to the supernatant, and the mixture was then incubated for an additional 15–30 min. A microplate reader was used to measure the spectrometric absorbance at 540 nm. The results are presented as a percentage of control cells that weren’t treated.
Cell cycle analysis
Cancer cells were seeded in 6-well plates at a density of 2 × 10⁵ cells/mL. The cancer cells were pretreated with NS, e–p, or VSV MP for 6 h. The medium was aspirated and replaced with indicated drugs for 24 h. Cells were trypsinzed, washed twice with PBS before fixing them in 70% ethanol at −20°C for 2 h. And then, cells were stained with 500 μL PI (50 μg/mL)/RNase A (200 μg/mL; KeyGen Biotech) for 30 min at room temperature. Afterward, the cells were centrifuged, rinsed, and suspended in PBS to achieve a final concentration of 1 × 10⁶/mL. We obtained the data using FlowJo software (Tree Star) analysis of 10,000 events identified by a FACS Aria II flow cytometry device (BD Bioscience).
Intracellular ATP measurements
U87, C6, and 293 cells were seeded at 2 × 10⁵ per well in a 12-well plate in duplicate. In total, 24 h after seeding, U87, C6, and 293 cells were pretreated with NS, e–p, or VSV MP for 6 h; and then, the medium was aspirated and replaced with new media containing 2-DG (5 mM) or not. Intracellular ATP levels were determined by measuring luciferase activity using the ATP Determination kit (Sigma-Aldrich). Each well’s data were adjusted so that these were normalized to the amount of protein in its corresponding cell lysate.
Western blot analysis
Cells were harvested and lysed using lysis buffers made of RIPA or NP40. Pierce Chemical Company’s Micro BCA protein assay measured protein concentrations. Using a 10% sodium dodecyl sulfate-polyacrylamide gel, whole-cell protein lysates (20–45 μg/lane) were electrophoresed before being transferred to a nitrocellulose membrane for Western blot analysis. TBS (20 mM Tris and 137 mM NaCl [pH 7.3]) mixed with 0.1% Tween-20 was used to block the membranes. The membranes were then incubated overnight with a primary antibody. Following a wash, the membranes were treated for 60 min with anti-rabbit immunoglobulin G (IgG) or peroxidase-conjugated goat anti-mouse IgG. The Eastman Kodak Company’s Kodak Molecular Imaging Software measured the band’s intensity. The National Institutes of Health’s Image J software was used to determine the band intensities.
Analysis of Beclin 1/Bcl-2 immunoprecipitation
We lysed untreated and treated cells with lysis buffer. The lysed cells were incubated in Protease Inhibitor Cocktail (Roche Applied Sciences) on ice for 1 h. The lysates were centrifuged at 4°C for 30 min in 16,000 g, and the supernatants were collected and precleared with protein-G agarose beads for 2 h. Next, the Bcl-2-conjugated agarose (Santa Cruz; 1:20 dilution) or IgG antibody was added and incubated overnight in 4°C. Next day, the immunoprecipitants were washed, successively resuspended in reducing agent-containing loading buffer, and boiled for 5 min. Finally, samples were further analyzed with Western blot using anti-Bcl-2 antibody, anti-Beclin 1 antibody, and anti-β-actin antibodies.
Quantitative assessment of apoptosis in vivo
Briefly, fresh tumors were isolated and embedded in Cryo Embedding Medium (Head Biotechnology) in −18°C for 30 min. Then, tissues were cut into 5-mm-thick sections and mounted onto glass slides. Before stain proceeding, tissue-loaded sections were immersed into PBS buffer for 10 min to remove Cryo Embedding Medium. The sections were next treated with 0.5% triton-X100 buffer for 20 min and blocked with 10% goat serum for 1 h. Thereafter, sections were successively stained with Hoechst 33258 and Cell Event Caspase-3/7 Green Detection Reagent (Life Technologies) substrate for 30 min. Fluorescence microscopy (Leica) was used to examine tumor slices for the presence of apoptotic cells.
Terminal deoxynucleotidyl transferase dUTP nick-end labeling
An in situ fluorescent terminal deoxynucleotidyl transferase dUTP nick-end labeling (TUNEL) assay was used to analyze apoptotic U87 and C6 cells according to the manufacturer’s guideline. The plated cells were treated with NS, e–p, or VSV MP for 6 h, with or without 2-DG for another 24 h. Next, the cells were washed with PBS, and fixed with 2% PFA solution, permeabilized with 0.1% Triton X-100 buffer. Thereafter, TUNEL regent was added to the plated cells and incubated at 37°C for 1 h in the dark. Finally, cells were washed with PBS and imaged after treated with sealing reagent. Fluorescence microscopy (Leica) was used to illustrate the presence of apoptotic cells.
Annexin V/PI assay
The flow cytometry was used to assess the proportion of apoptotic cells with Annexin V and propidium iodide staining. After treated as described above, those cells underwent detaching by Trypsin/EDTA, washing with PBS, and resuspending in Annexin V binding buffer (BD Biosciences). Next, cancer cells were incubated in FITC-labeled Annexin V and propidium iodide (BD Biosciences) for 15 min. The number of Annexin V+/PI- and Annexin V+/PI+ events/μL was quantified using flow cytometry (Apogee Flow).
Mitochondrial membrane potential assay
To measure the loss of mitochondrial membrane potential (MMP), we used the cationic dye JC-1. To assess the level of MMP damage, we use the kit (Beyotime Biotechnology) and its accompanying protocols. After 20 min of incubation at 37°C, 6 × 10⁵ cells in 0.5 mL medium were stained with 0.5 mL JC-1 staining working solution and centrifuged (600 g) at 4°C for 3–4 min to remove the supernatant. After resuspending the cells in the right quantity of JC-1 staining buffer, they were washed twice with the JC-1 staining buffer. Flow cytometry (Apogee Flow) and the CytExpert software were used to identify JC-1. Green stains show JC-1 monomer in apoptotic cells with depolarized MMP, whereas red stains show JC-1 aggregates in undamaged mitochondria. To assess MMP, the ratio of red/green fluorescence intensity was obtained.
Quantitative RT-PCR
According to Zhou et al., 28 total RNA isolation from cells was performed. RNA quality control was performed by using Agilent’s 2100 Bioanalyzer. Total RNA was isolated as directed by the manufacturer using an Isogen RNA extraction kit (Nippon Gene). cDNA was obtained after genome DNA erased and RNA reverse-transcribed via PrimeScript™ RT reagent kit (Takara). Primers were designed to amplify cDNA using the following sequences (Supplementary Tables S1 and S2). As an internal control, we used the β-actin gene with the following primers: Forward primer, 5′-CTTCCTGGGCATGGAGTCCT-3′; Reverse primer, 5′-GGAGCAATGATCTATCTT-3′. Oligo-deoxythymidine primers and the GoScript reverse transcription kit (Promega) performed reverse transcription on total RNA (1–5 μg). After reverse transcription, the GoTaq qPCR Master Mix kit and specific primers (Promega) were used to amplify cDNA amplicons using an Mx3000P Stratagene system. Each gene’s mRNA expression was compared with control genes (β-actin) to determine how much of each gene was expressed.
Glucose and lactate quantifications
Cell supernatants were analyzed to determine metabolite concentrations using a Glucose (GO) Assay Kit (Sigma-Aldrich) and a Lactate Assay kit (Sigma-Aldrich). The experiments were conducted following the instructions provided by the manufacturer. After 6 h of e–p or VSV MP incubation, the medium was replaced with complete DMEM medium. Proteins were isolated from cells, and cell supernatants were tested at each time point. For each assay, the glucose consumed or lactate produced in the cell culture medium was calculated as the absolute of the measured value minus the original value in the medium (compared to time zero). The final results were represented as nmol consumed per μg of protein, normalized to the total amount of protein in the well (nmol/μg).
Statistical analyses
The data are presented as the mean ± standard error of mean of replicate analyses from at least three independent experiments unless otherwise indicated. The Student’s t-test was performed to analysis difference between two groups. One-way analysis of variance was used when comparing more than two groups. All statistical analyses were performed using the industry-standard statistical software (SPSS, version 13). A p value <0.05 was considered statistically significant.
RESULTS
VSV MP and 2-DG combination treatment decreases U87 and C6 cancer cell viability
To ascertain if 2-DG modifies the cytotoxic effect of VSV MP, cell viability of U87, C6, and 293 cells treated with VSV MP alone, 2-DG alone, or in combination was examined over 3 days (Fig. 1A). The results showed that both 5 mM 2-DG or VSV MP treatment alone showed cytotoxicity to U87 and C6 cancer cells. The combination therapy of the two drugs induced enhanced cancer cell inhibition in both glioblastoma cell lines. However, in 293 cells, neither VSV MP nor 2-DG had any effect, and the combination of the two drugs led to a slight additive inhibitory effect compared with that in the NS or e–p groups (no significant difference). These findings demonstrated that the combined VSV MP and 2-DG treatment was cytotoxic to human cancer cell lines, whereas normal cells were relatively unaffected by the treatment. We sought to determine whether treatment with VSV MP and 2-DG affects the distribution of C6 and U87 cells in various cell cycle stages in light of the connection between the cell cycle and the potential for cell death. After 24 h of 2-DG treatment, the VSV MP-treated cancer cells had lower G0/G1 fractions and significantly greater G2/M fractions than the e–p-incubated cancer cells (Fig. 1B, C). Incubation with VSV MP alone did not affect the cell cycle distribution of C6 or U87 cells. According to the Western blot results, 2-DG treatment significantly reduced the levels of p-cdc2 (Try15), cyclin B1, and cyclin A2 in VSV MP-treated C6 and U87 cells compared with those in cells exposed to either drug alone (Fig. 1D, E).
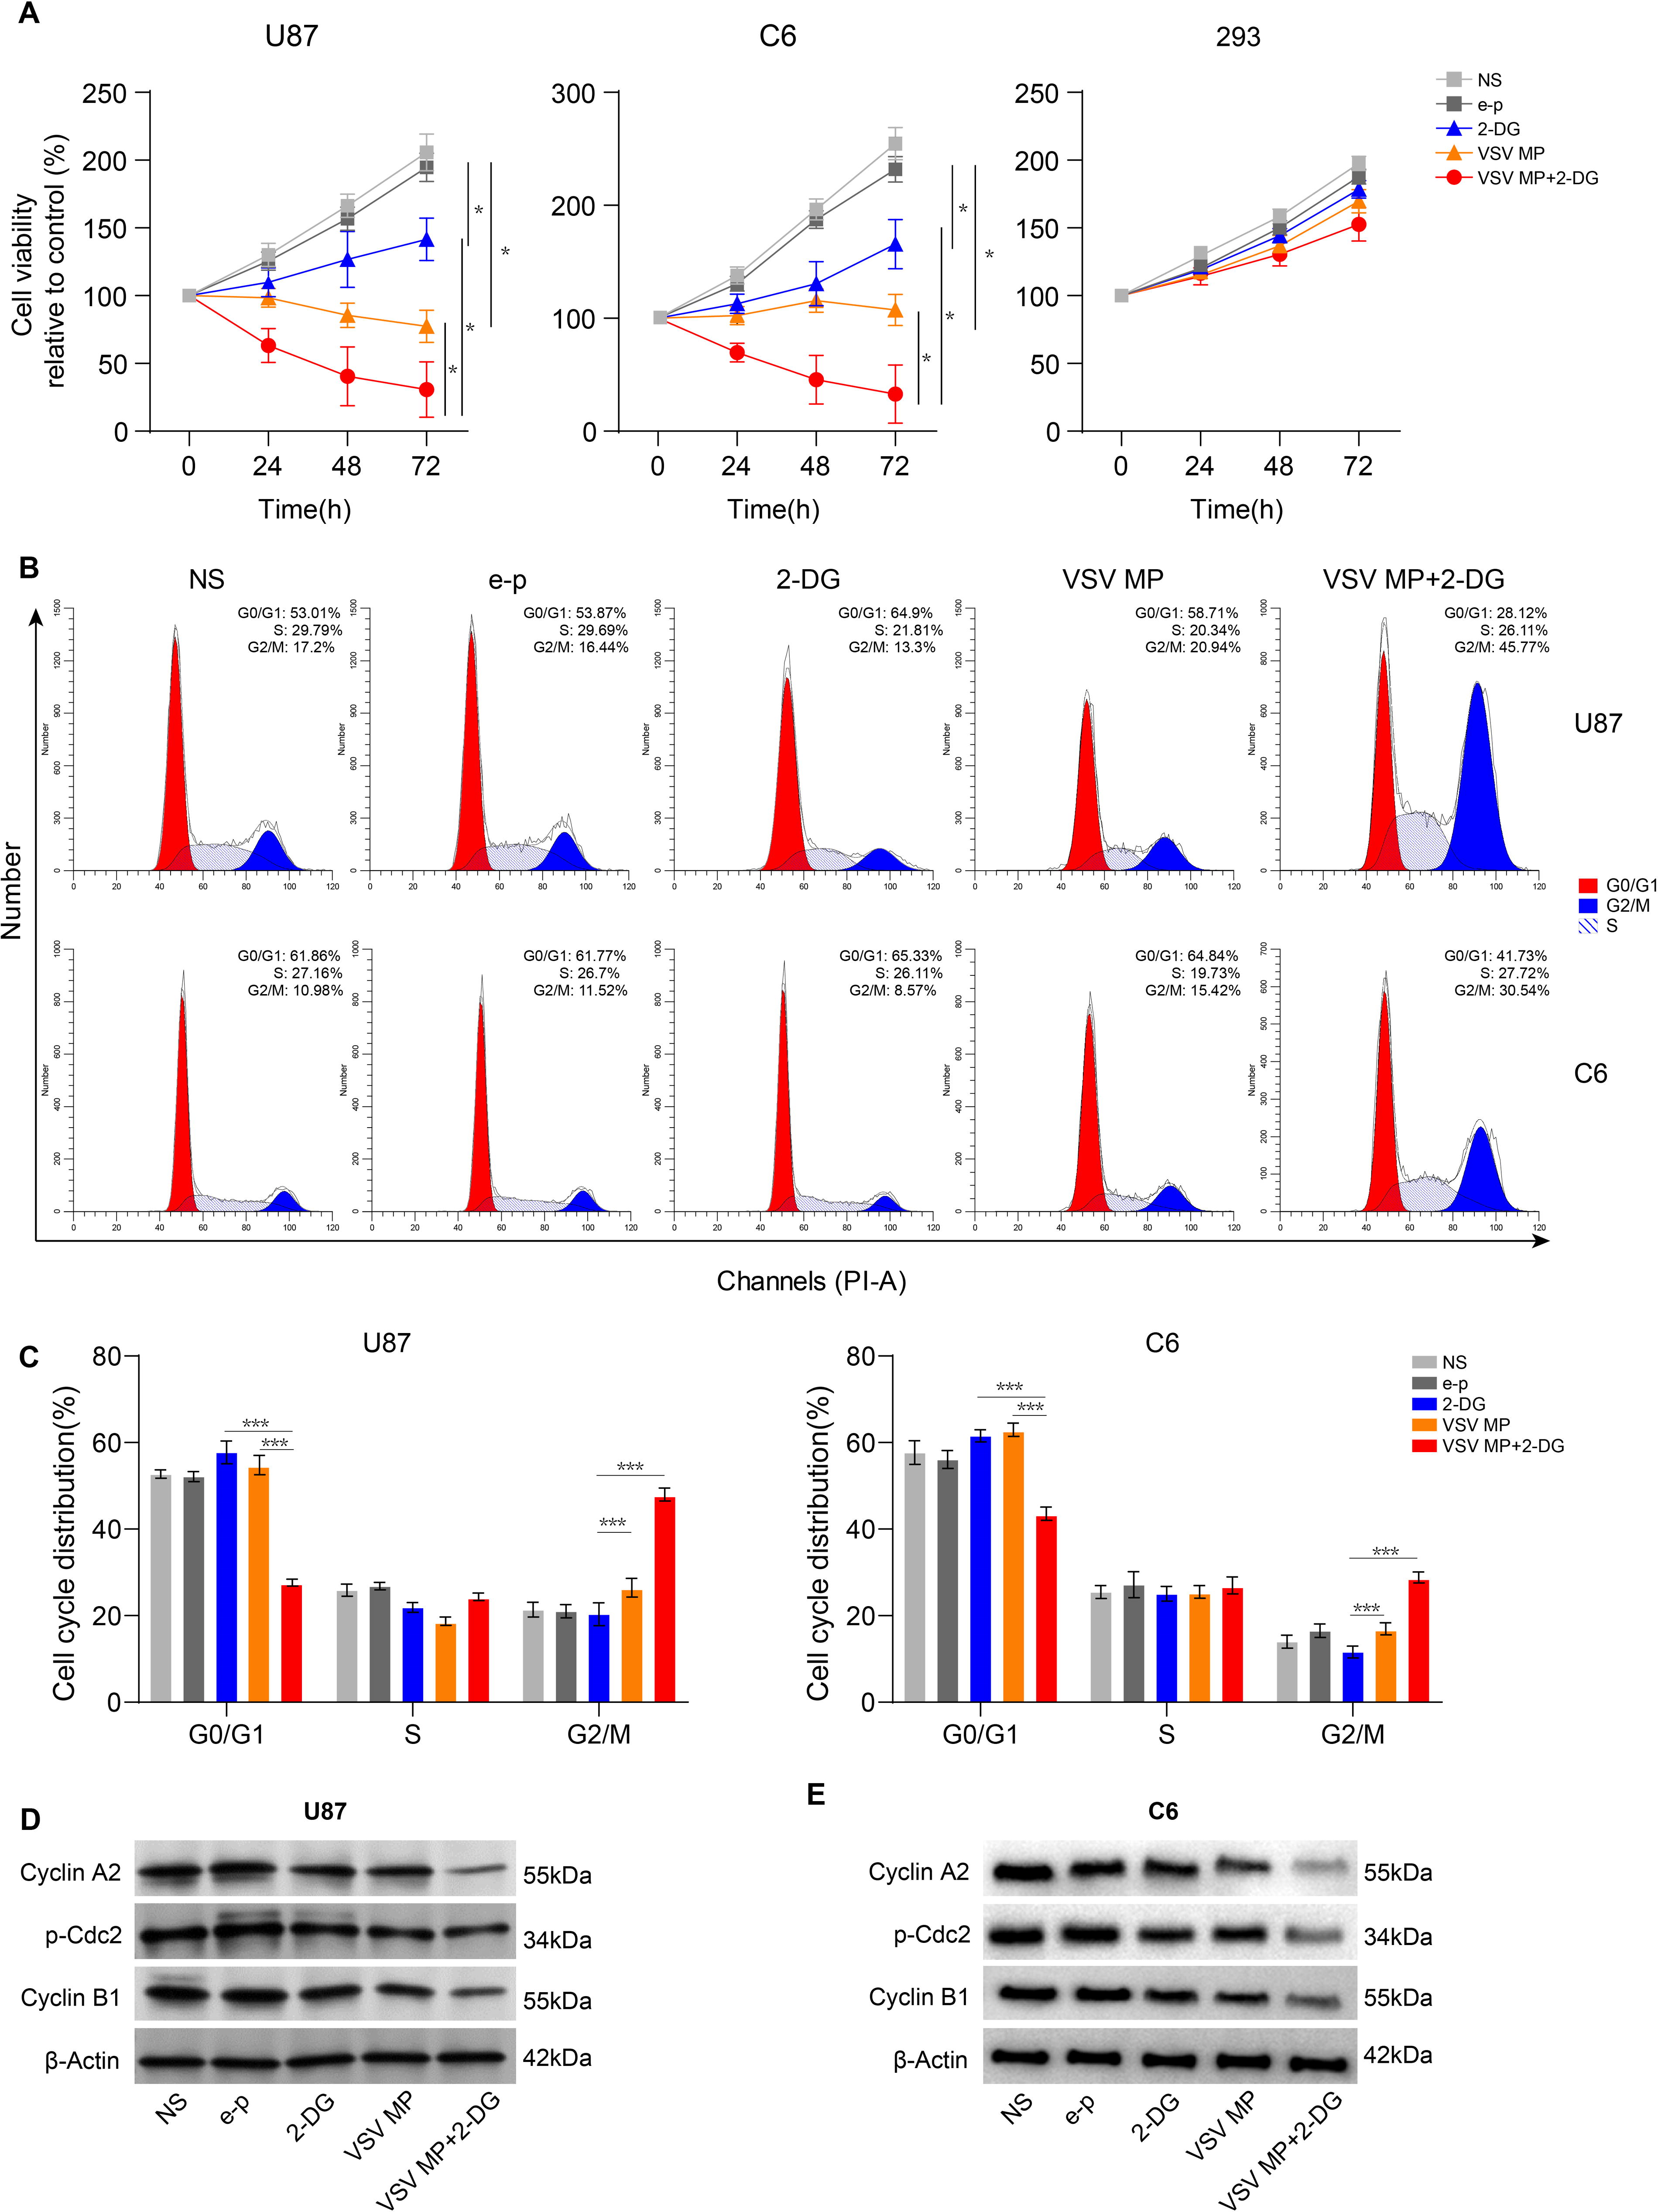
VSV MP and 2-DG inhibit cancer cell viability and induce cell cycle arrest. U87, 293, and C6 cells were seeded in plates. Twenty-four hours later, cells were incubated with NS, e–p, VSV MP for 6 h, and the medium was aspirated and replaced medium with or without 2-DG (5 mM).
Effect of VSV MP and 2-DG on U87 and C6 tumor growth in vivo
To determine whether 2-DG potentiates the antitumor activity of VSV MP in vivo, we established U87 orthotopic tumor to assess the effects of combined therapy (Fig. 2A). To enhance the blood–brain crossing for liposome, focused ultrasound (FUS) was immediately used after liposomal mixture injection, which has been proved to be able to induce blood-brain barrier (BBB) opening in noninvasive manner. 32,33 After mice experienced FUS exposure, VSV MP has success in transfected tumor cells compared with mice without FUS administration (Supplementary Fig. S1). In the orthotopic U87 model, administration of 2-DG or VSV MP alone inhibited tumor growth slightly but was less effective than the combined treatment (Fig. 2B, C). Meanwhile, mice treated with VSV MP combined with 2-DG obtained longest survival when compared with any one of these two drugs treated alone (Fig. 2D). These findings suggested that the liposome has crossed BBB success, and the combined therapy was feasible and effective for brain tumor treatment. Furthermore, a superior tumor inhibition from combined therapy was observed in the C6 model (Supplementary Fig. S2A, B), and such efficacy was corroborated with the findings in the orthotopic tumor treatment model. which was corroborate results of orthotopic tumor model and demonstrating the favorable effectiveness of VSV MP combined with 2-DG in vivo.
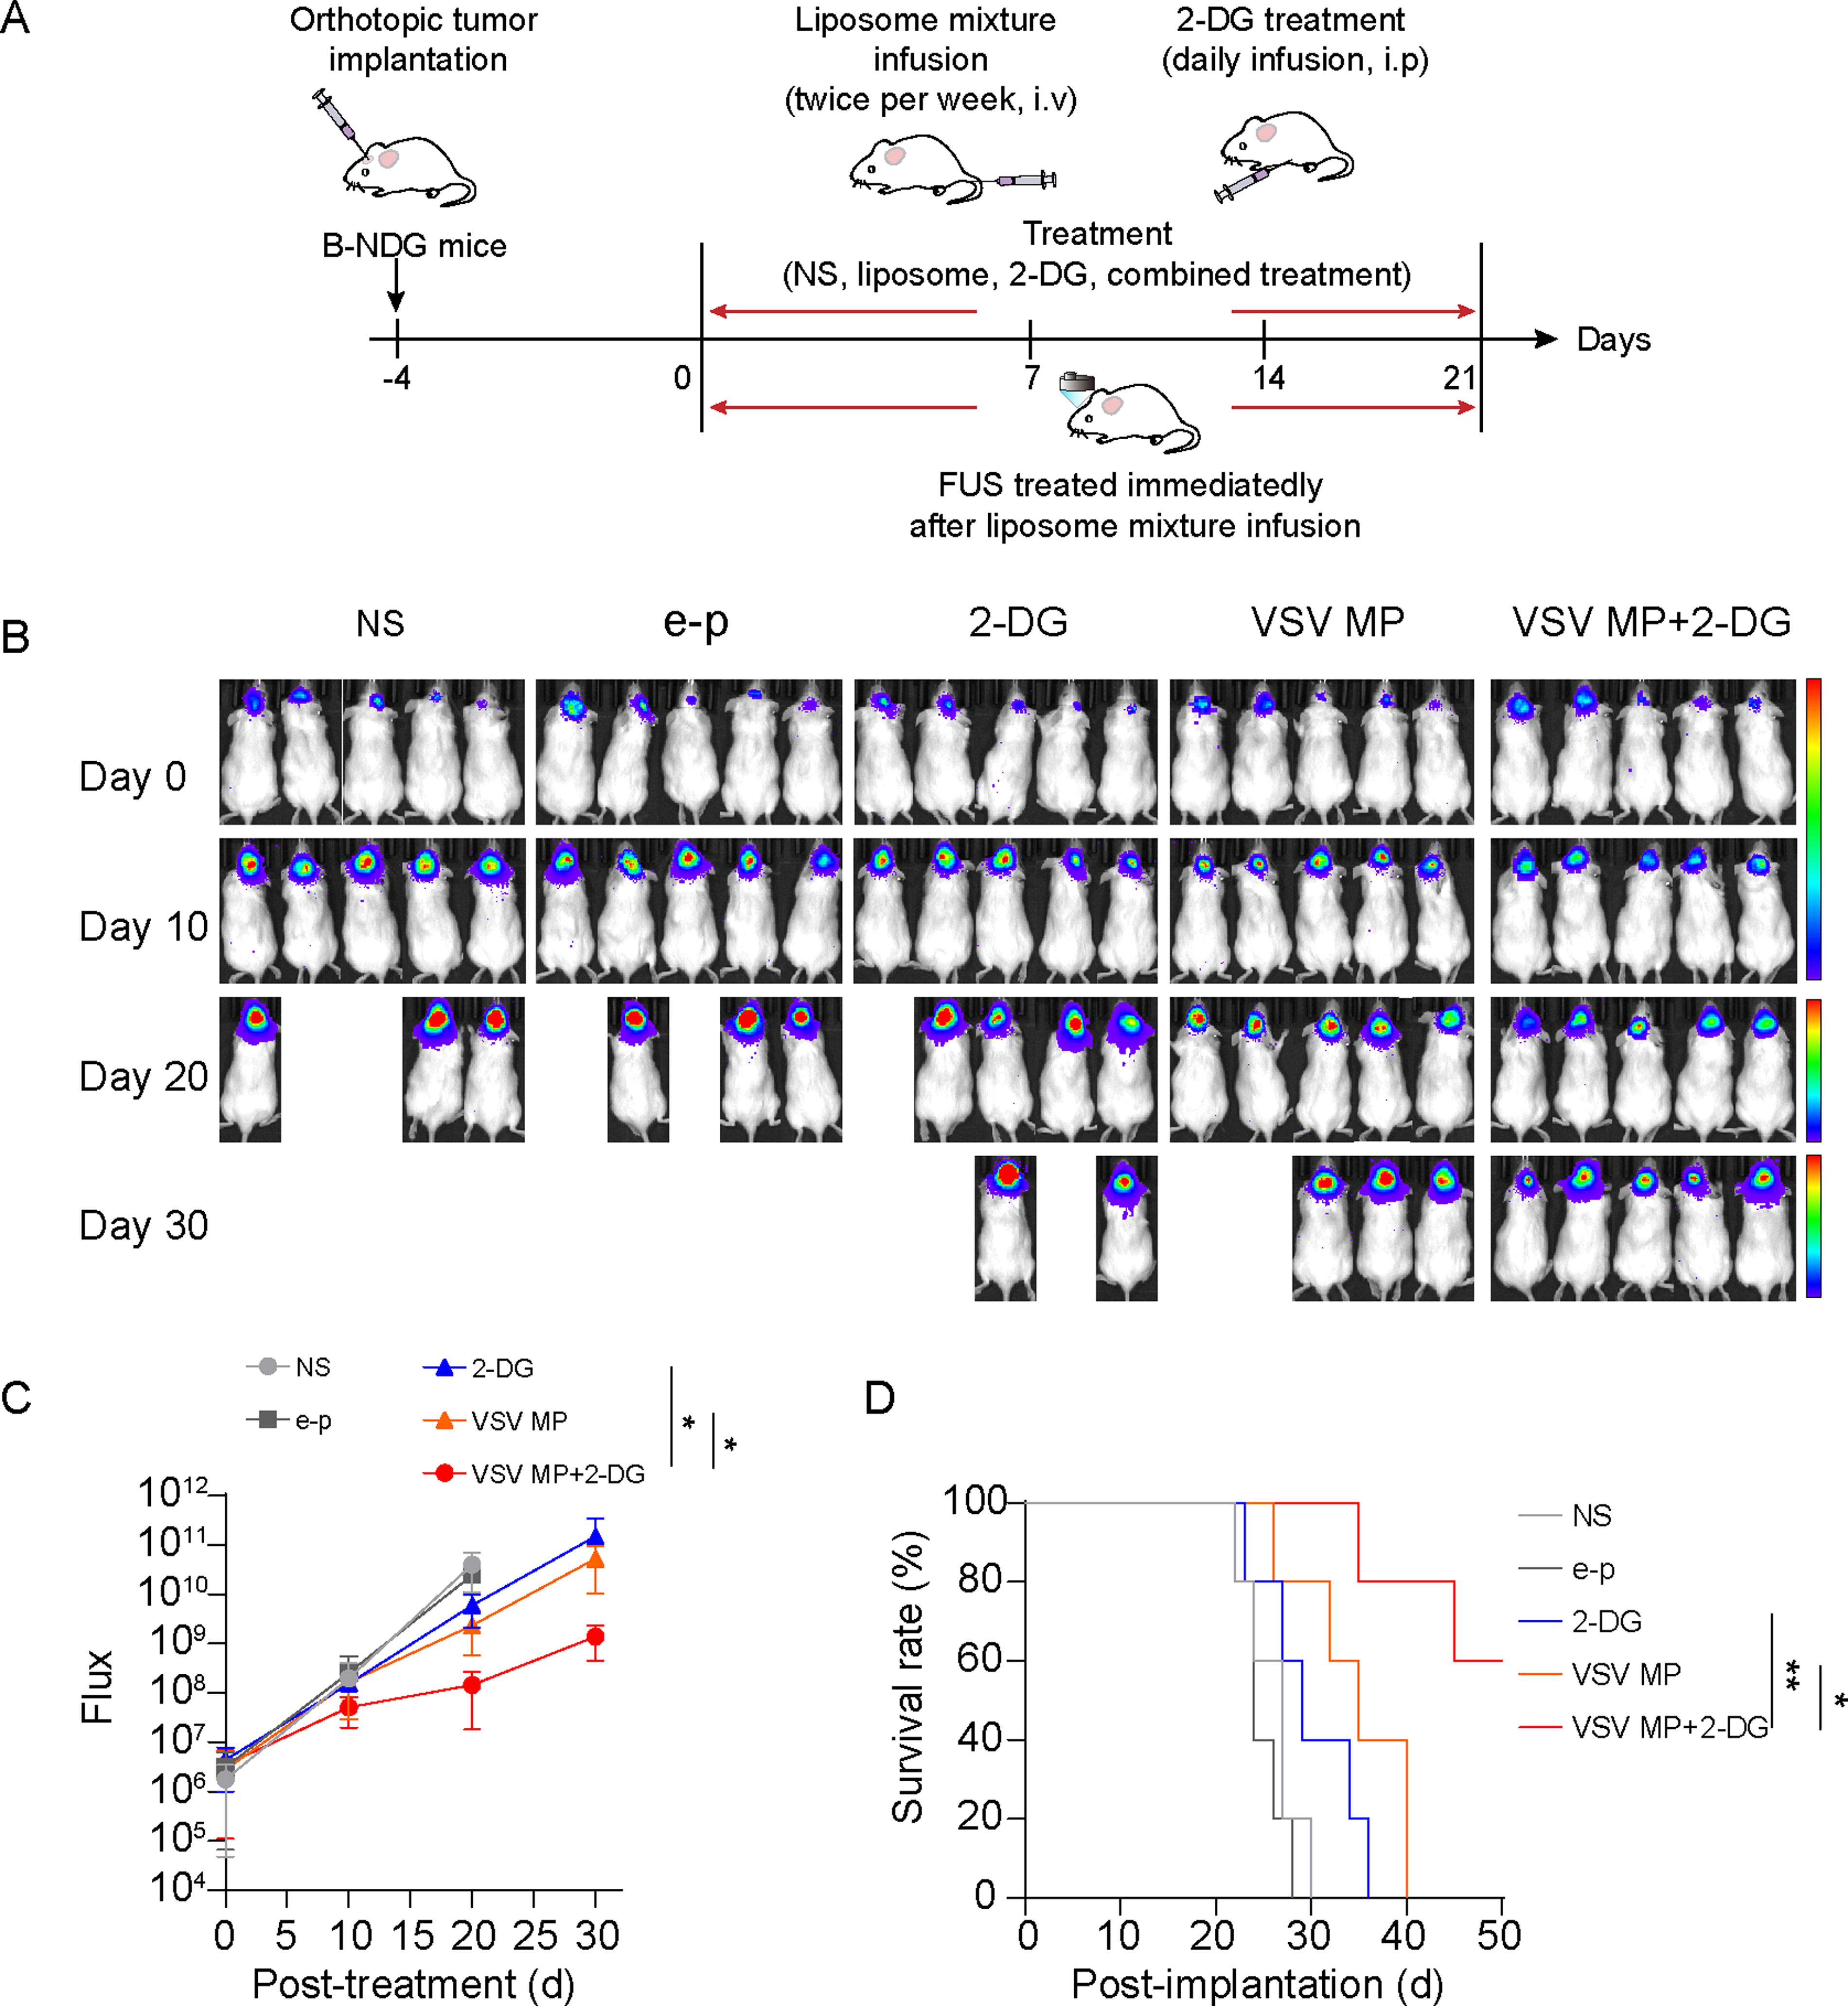
Combined treatment with VSV MP and 2-DG inhibits U87 and C6 tumor growth.
Apoptosis analysis
These encouraging results prompted us to further detect the potential mechanism of VSV MP and/or 2-DG in tumors. The apoptosis of tumor cells was detected after tumor cells were treated with different drugs. 2-DG administration has increased the apoptosis of tumor cells slightly but less than VSV MP treatment alone (Fig. 3A). Interestingly, when 2-DG was combined to the VSV MP-transfected glioblastoma cells, both U87 and C6 cells apoptosis were obviously increased (Fig. 3A). Furthermore, early DNA fragmentation linked to apoptosis was detected using a TUNEL assay. The TUNEL assay revealed that VSV MP treatment alone promoted tumor cell apoptosis, and the combined treatment caused a significant increase of apoptotic cells with strongly positive nuclei after 24 h of treatment (Fig. 3B, C). Similar results were found in C6 cells (Fig. 3D, E). Meanwhile, we also observed the more Caspase-3/7 activity after C6 tumor treated by VSV MP in vivo, especially when combined with 2-DG, the activity of caspase-3/7 was further evaluated (Supplementary Fig. S3A, B). Moreover, expressions of the apoptosis-related proteins cleaved caspase-3 and poly (ADP ribose) polymerase (PARP) were enhanced after VSV MP treatment or combined with 2-DG, which supported the findings above (Fig. 3F).
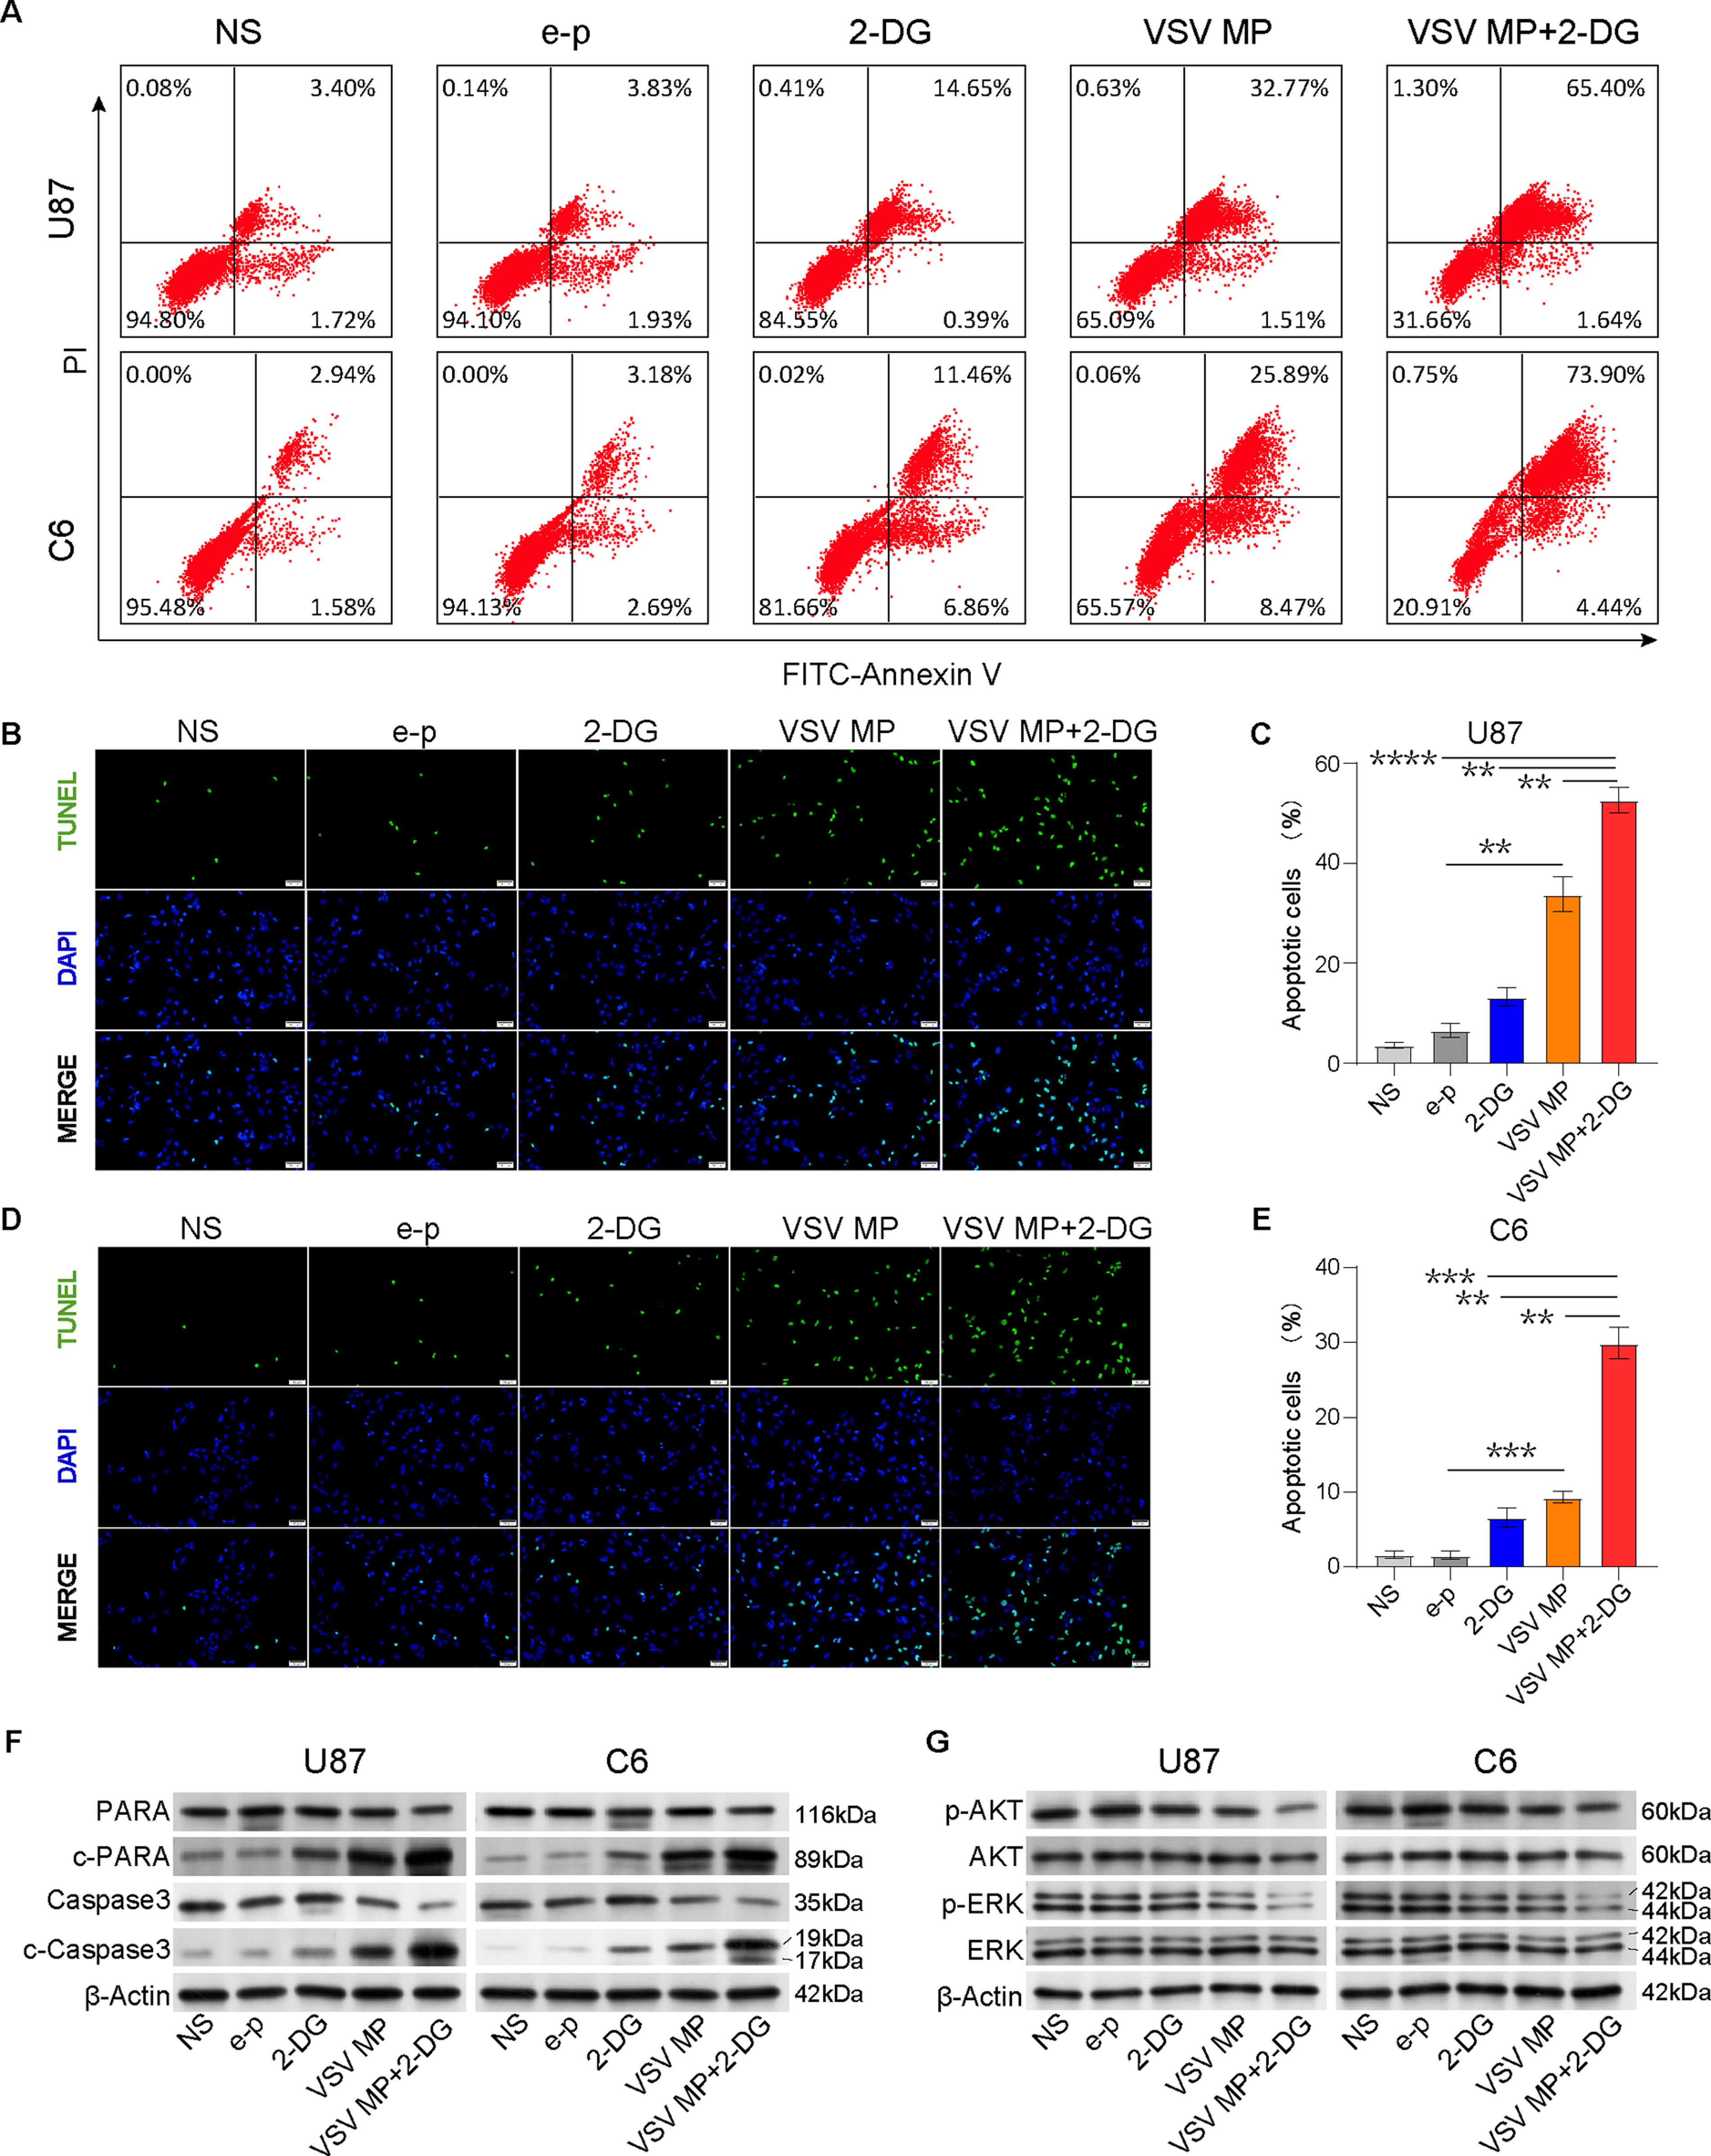
2-DG synergizes with VSV MP to induce apoptosis in U87 and C6 cancer cells in vitro. Cells were incubated with NS, e–p, VSV MP for 6 h, and the medium was aspirated and replaced medium with or without 2-DG (5 mM). After 24 h of treatment of 2-DG, cells were harvested and underwent apoptosis analysis.
Previous studies have shown that both PI3K/Akt and MEK1/2/ERK signaling are associated with apoptosis, cell cycle distribution, and glucose metabolism in glioblastoma. 34 –37 To investigate whether VSV MP and/or 2-DG affected the MEK1/2/ERK and PI3K/AKT pathways, we examined the phosphorylation status of AKT and ERK and their protein expression levels. Monotherapy with 2-DG did not noticeably impact AKT or ERK phosphorylation levels. Similarly, VSV MP monotherapy slightly suppressed AKT and ERK phosphorylation in the cell lines, but the difference was not significant (Fig. 3G). Interestingly, when we combined these drugs, the AKT and ERK phosphorylation levels were significantly lower than those in the group treated with VSV MP alone (Fig. 3G).
VSV MP and 2-DG combination treatment promotes mitochondrial dysfunction, increases membrane permeability, and depletes intracellular ATP
As shown previously, the VSV MP can target the surface of mitochondria. 8 We next determined whether the VSV MP alters mitochondrial function and whether the combination of 2-DG and VSV MP exacerbates mitochondrial function.
The intracellular ATP levels in U87 and C6 cells were tested (Fig. 4A). Compared to e–p or control treatment, treatment with 2-DG or VSV MP alone modestly decreased the intracellular ATP concentration after 24 h in both U87 and C6 cells. Importantly, compared with the VSV MP or 2-DG treatment, the combination of VSV MP and 2-DG significantly decreased the intracellular ATP concentration (p < 0.05). We found that ATP production in the combination treatment group was ∼50% greater than that in the e–p group in U87 cells and 60% greater than that in the e–p group in C6 cells. Interestingly, the combination treatment reduced the intracellular ATP concentration in 293 cells by 20%. These results demonstrated that VSV MP and 2-DG cotreatment caused metabolic stress in cancer cells but not normal cells.

The combination of 2-DG and VSV MP deteriorates mitochondrial function. U87 and C6 cells incubated with NS, e–p VSV MP for 6 h, and replaced medium with or without 2-DG (5 mM) for 24 h. (
Mitochondrial dysfunction can cause the rupture of the outer mitochondrial membrane, transmembrane potential loss, cytochrome c release from the intermembrane space, and subsequent activation of apoptotic caspases. 38,39 Therefore, we explored the effect of VSV MP and/or 2-DG on the mitochondrial transmembrane potential (Fig. 4B) and cytochrome c release (Fig. 4C). To investigate the MMP (ΔΨmt) in C6 and U87 cells, we stained the cells with JC-1. According to our previous results, VSV MP treatment decreased the ΔΨmt of C6 and U87 cancer cells, and the increase in JC-1 aggregates is shown by the green dots on the graph (Fig. 4B). Although 2-DG treatment only had a slight effect on the ΔΨmt in C6 and U87 cells, when cells were treated with both 2-DG and VSV MP, the ratio of red to green fluorescence significantly increased. These results suggest that compared with treatment with VSV MP or 2-DG alone, treatment with VSV MP and 2-DG led to a decrease in the mitochondrial transmembrane potential.
It is well established that decrease in the mitochondrial transmembrane potential can trigger cytochrome c release from mitochondria. In U87 and C6 cells, cytochrome c released into the cytosol in the combined treatment group was found to be approximately three times greater than that in the VSV MP-treated group. In the 2-DG-treated group, cytochrome c released into the cytosol was not significantly elevated compared with that in the e–p group (Fig. 4C).
VSV MP treatment promotes aerobic glycolysis in U87 and C6 cells
Mitochondrial dysfunction and viral infection in some cancer cells may cause a metabolic shift from oxidative phosphorylation (OXPHOS) to glycolysis. U87 and C6 cells were incubated with the VSV MP or e–p to examine whether the VSV MP alters cellular metabolism. Lactate production and glucose consumption were measured 24 h after VSV MP treatment. Our study showed that VSV MP treatment increased lactate production and glucose consumption (Fig. 5A) while decreasing ATP production. Western blotting and quantitative real-time PCR were carried out in VSV MP-treated cells with cDNA or whole-cell lysates to examine the expression levels of glycolysis-related genes. After 24 h of incubation with the VSV MP, the transcription of glycolysis-associated genes was increased (Fig. 5B), including glucose transporter (GLUT1), the M2 isoform of pyruvate kinase (PKM2), hexokinase II (HK2), and pyruvate dehydrogenase lipoamide kinase isozyme 1 (PDK1). Meanwhile, the expression of glycolytic enzymes (HK2, PKM2, GLUT1, and LDHA) were also elevated after cancer cells treated with VSV MP (Fig. 5C, D). Hypoxia-inducible factor 1alpha (HIF1-α), which is known to be a glycolysis regulator, was obviously upregulated after a series doses of VSV MP-cDNA transfected into U87 and C6 cells but decreased when the dose of administrated VSV MP-cDNA was greater than 2.0 μg pcDNA3.1-VSV MP/10 µg liposome complex (Fig. 5E, F). HIF1-α was stabilized by VSV MP at the initial stage but upregulated in time-dependent manner (Fig. 5G, H). To further validate findings above, PX-478 was used to inhibit HIF-1α when U87 and C6 cells treated with VSV MP. The results showed that PX-478 decreased HIF-1α expression and inhibited glycolytic enzymes simultaneously in concentration-dependent manner (Fig. 5I, J). These findings suggested that VSV MP regulated HIF-1α signaling pathway, changed mitochondrial function, and enhanced glycolysis in U87 and C6 cells.
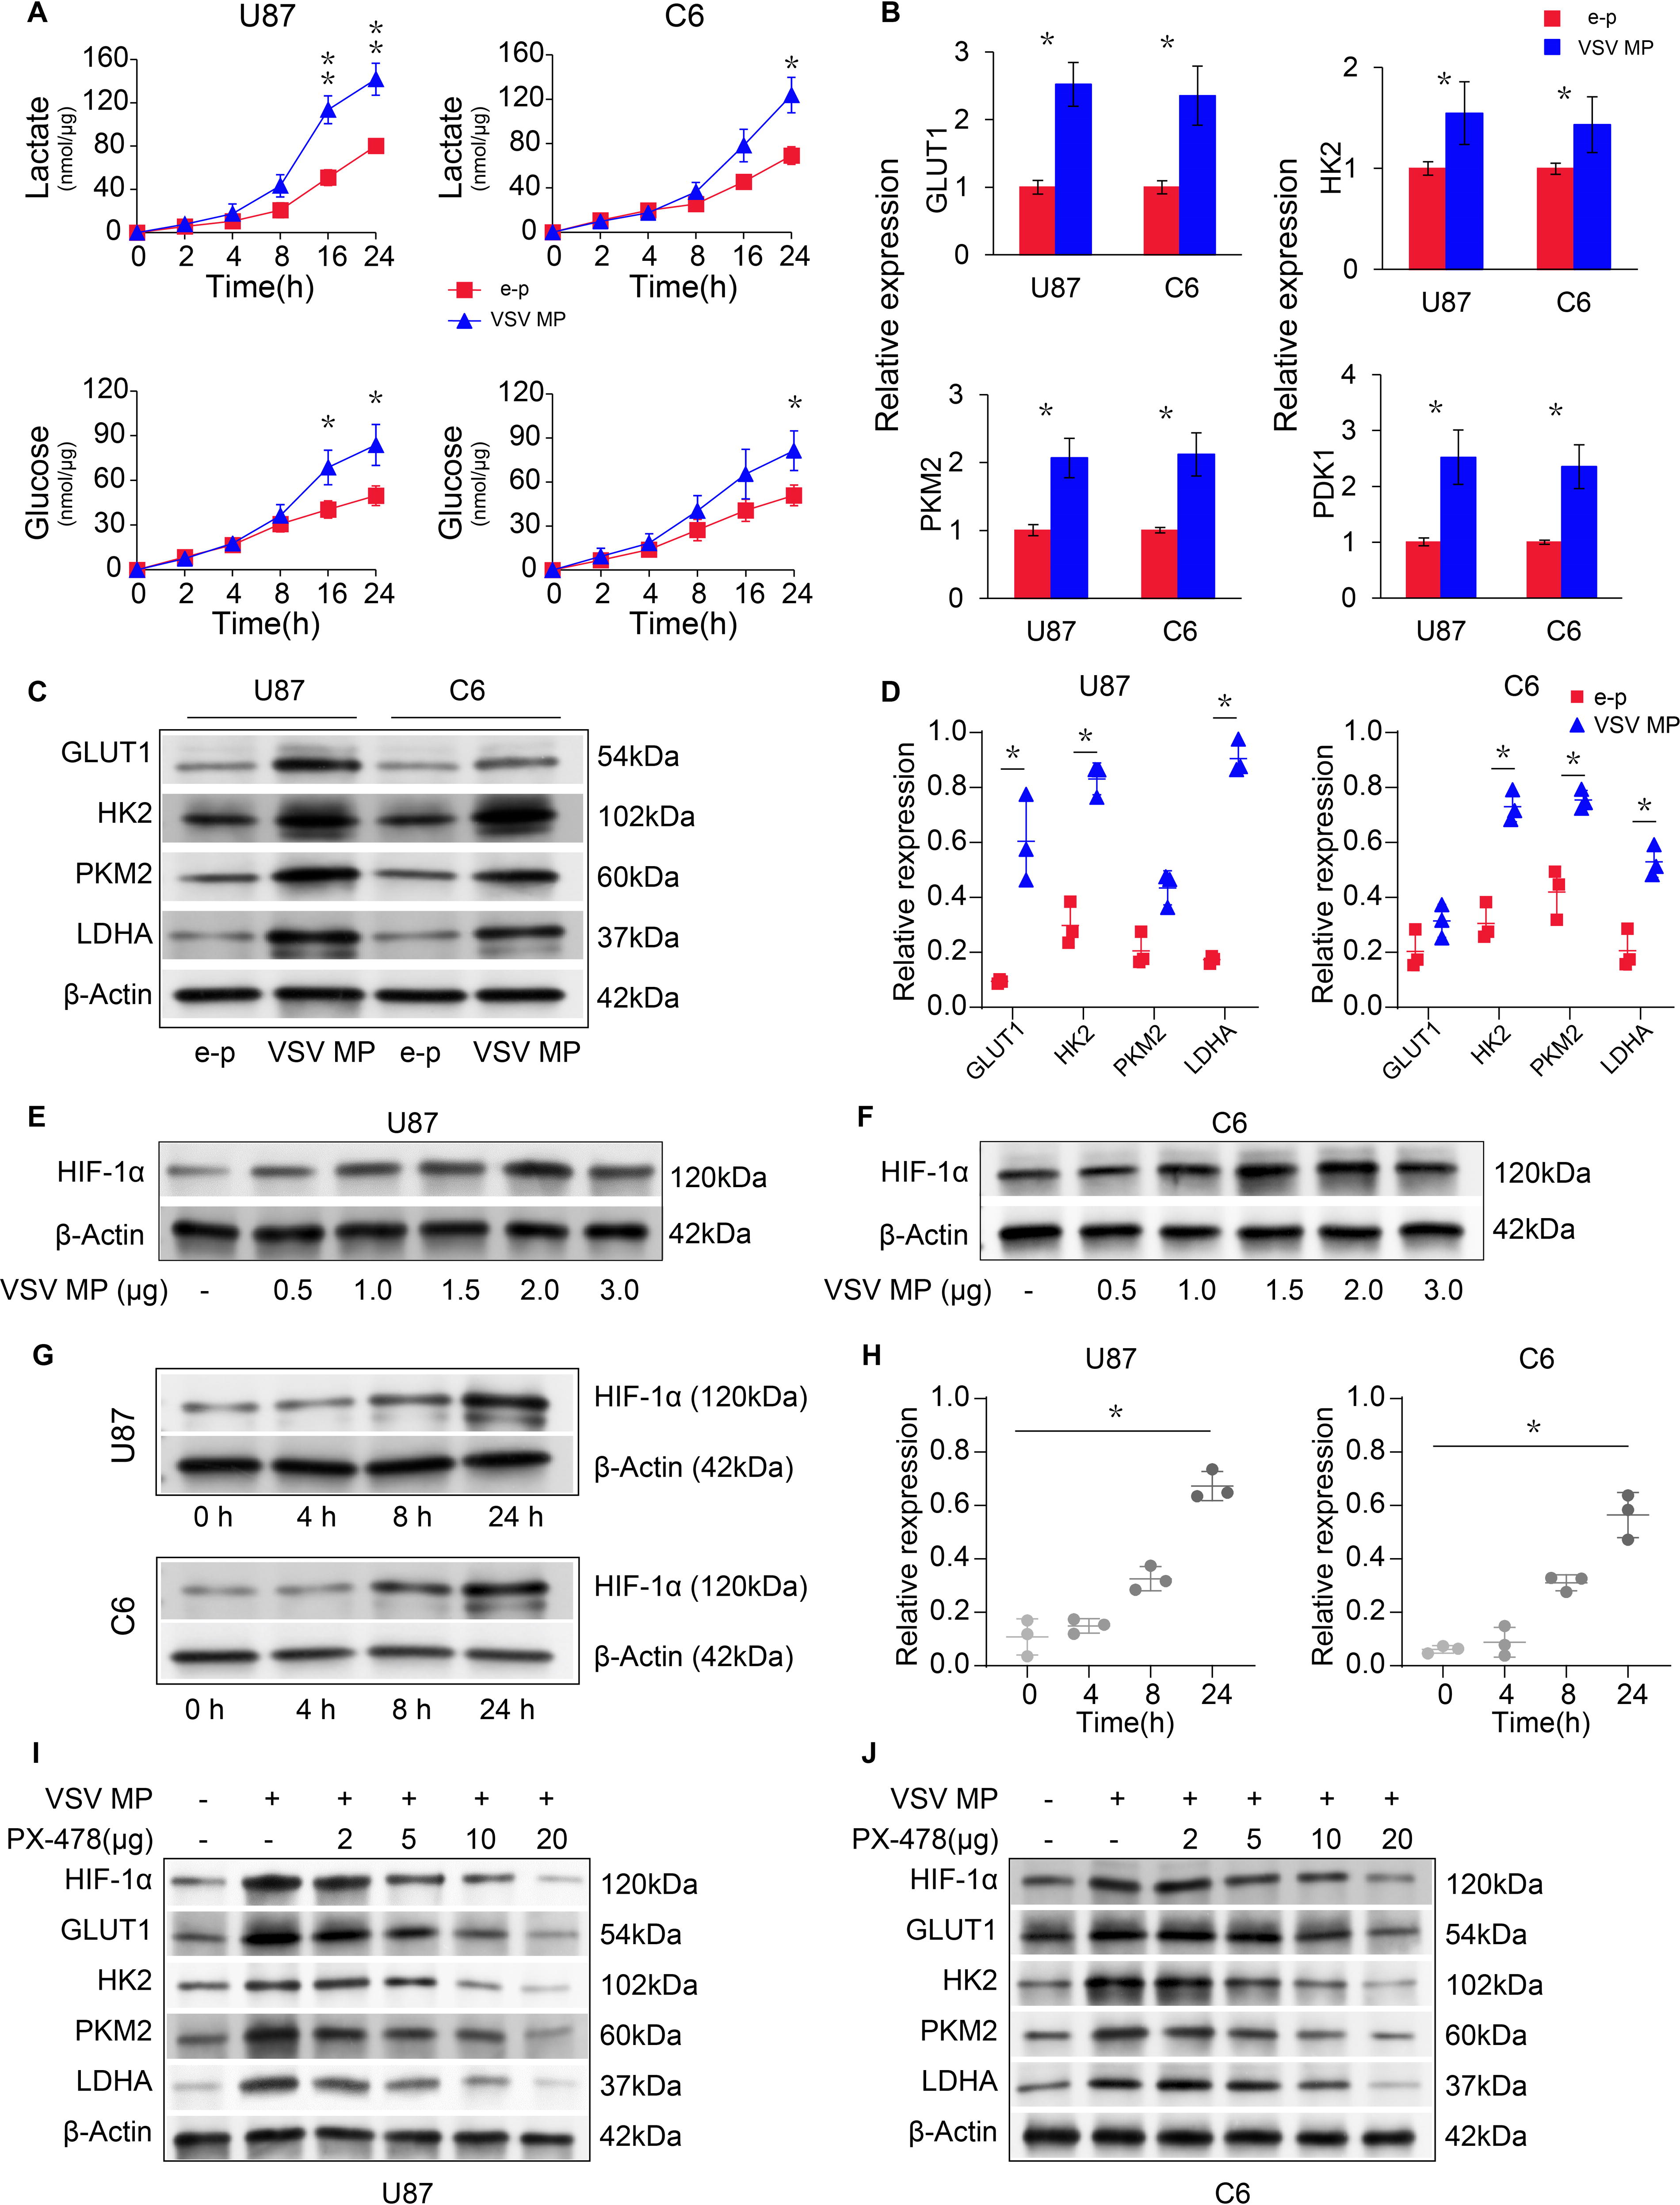
VSV MP promotes glycolysis via the HIF-1α signal pathway in cancer cells.
VSV MP and 2-DG combination treatment regulates the AMPK/mammalian target of rapamycin/autophagy pathway
AMPK, a Ser/Thr protein kinase complex, plays an important role in monitoring the bioenergetics of cancer cells. 40 A key regulator of cell metabolism is the downstream protein mammalian target of rapamycin (mTOR), which is known to be negatively regulated by AMPK. 41 In our research, although 2-DG or VSV MP alone decreased intracellular ATP levels and led to AMPK phosphorylation (Fig. 6A, B), 2-DG or VSV MP alone did not significantly modify cell metabolism, as demonstrated by the lack of changes in the phosphorylation of the downstream target 4E-binding protein 1 (4E-BP1). Compared with either drug alone, the combination of VSV MP and 2-DG not only increased AMPK phosphorylation but also decreased the levels of mTOR and its downstream signal 4E-BP1 (Fig. 6A). As shown in Fig. 6B, significant differences in 4E-BP1 and mTOR phosphorylation were detected in the combination treatment group but not in the single agent-treated groups compared with the control group. HIF-1α is downstream of mTOR and may contribute to the therapeutic efficacy of the combination treatment. According to a previous report, hypoxia-inducible factor-1 confers resistance to the glycolytic inhibitor 2-DG. 42 Our study revealed that HIF-1α protein levels were increased by VSV MP but decreased by 2-DG, even when 2-DG was combined with VSV MP (Fig. 6A, B). This result was consistent with a previous study. 43,44 Moreover, 2-DG-induced HIF-1α downregulation may enhance the antitumor effect of VSV MP treatment.

A combination of 2-DG and VSV MP regulates the AMPK/mTOR pathway and influences the autophagic flux. U87 cells were incubated with e–p or VSV MP for 6 h and then replaced with medium with or without 5 mM 2-DG for 24 h.
A lack of nutrients or lack of ATP can trigger autophagy. Therefore, we explored whether VSV MP and/or 2-DG have an impact on autophagy. Our findings showed that 2-DG treatment significantly increased the LC3II level, which was consistent with our previous results. When 2-DG was added to VSV MP-treated U87 and C6 cells, the LC3II level was notably lower than that in cells treated with 2-DG alone (Fig. 6C). Western blot analysis of Beclin 1 and p62 expression in cell lysates from the same experiment revealed that cells treated with VSV MP and 2-DG+VSV MP exhibited reduced Beclin 1 and p62 expression (Fig. 6C). Beclin 1 is a well-known autophagy regulator that separates from the Beclin 1/Bcl-2 complex after autophagy. 45 We used immunoprecipitation analysis to evaluate the interaction between these two proteins. Figure 6D and E illustrate that cells treated with 2-DG alone had lower levels of coimmunoprecipitated Beclin 1/Bcl-2 than cells in the e–p group. However, there was a significant increase in the number of coimmunoprecipitated Beclin 1/Bcl-2 proteins in the VSV MP and combination treatment groups.
DISCUSSION
VSV MP treatment alone has an antiproliferative effect on numerous cancer cell lines and 2-DG treatment alone sensitizes cancer cells to radiation or chemotherapeutic agents. 1,2,6 –8,26,46 This study revealed that VSV MP treatment induced mitochondrial dysfunction, including cytochrome c release, mitochondrial depolarization, and ATP depletion. This mitochondrial dysfunction was accompanied by upregulated HIF-1α, GLUT1, HK2, PKM2, LDHA, and PDK1 expression, which are involved in reprogramming glucose metabolism in U87 and C6 cells. Mitochondrial dysfunction was aggravated when VSV MP was combined with the glycolysis inhibitor 2-DG. Moreover, while 2-DG treatment activates AMPK and enhances autophagy, which can hinder apoptosis, VSV MP administration was observed to restore the Beclin 1/Bcl-2 interactions and enhance apoptosis. In the U87 and C6 xenograft models, VSV MP and 2-DG combination treatment enhanced apoptosis and inhibited tumor growth without significant toxicity.
Our findings demonstrated that VSV MP therapy can decrease the ΔΨmt and increase the release of cytochrome C. A considerable increase in the mRNA and protein levels of glycolysis markers coincided with these findings. As the MP is one of the main proteins in VSV, our findings support the hypothesis that VSV MP appears to trigger an effective prosurvival adaptive response that facilitates efficient viral replication. Our laboratory and others have observed that human viruses can activate glycolysis. 47 –49 For example, some studies have shown that hepatitis B virus may govern intracellular biosynthesis to enhance replication, 50 and another study illustrated that human cytomegalovirus infection can reprogram glioblastoma cell metabolism. 51 Although a previous study showed that mitochondrial dysfunction can increase the dependence of some cancer cells on glycolysis for energy supply, 12 –16 the mechanism by which the VSV MP induces this metabolic shift is still obscure. Further research is needed to elucidate the relationship between VSV infection and metabolic reprogramming in infected cancer cells.
Furthermore, this study revealed that the VSV MP restored Beclin 1/Bcl-2 coimmunoprecipitation and reduced autophagy. Autophagy is a process triggered by a lack of nutrients and is crucial for VSV recognition, detection, and removal. 52 –54 Growing evidence suggests that during their life cycle, viruses interact with the autophagy mechanism of the host, either benefiting or harming to the virus itself. In this context, the regulation of cellular autophagy by oncolytic virus infection and the effects of autophagy on viral replication are complex and phase-specific. For instance, Olagnier et al. reported that oncolytic VSV-51 can be stimulated to replicate via nuclear factor erythroid 2-related factor, mediate autophagy, and interfere with type I interferon. 55 Moreover, some research has shown that autophagy triggered by RNase L during the initial cycle of virus growth contributes to the suppression of VSV replication at a low multiplicity of infection. 56 Similarly, enhancing autophagy at the postentry phase of hepatitis A virus (HAV) infection can suppress HAV replication in human hepatocytes. 57 In addition, some research suggests that autophagy may not impact the replication of oncolytic adenoviruses in tumor cells. 58
Furthermore, autophagy mediated by 2-DG appears to be impaired by the VSV MP, which subsequently enhances proapoptotic activity. Energy depletion can induce metabolic stress, activate AMPK, inhibit mTOR signaling pathways, and result in autophagy, which is a prosurvival process under metabolic stress. Our assays showed that 2-DG alone promoted autophagy and survival but did not significantly increase the percentage of apoptotic U87 or C6 cells. However, VSV MP and 2-DG combination treatment reduced Beclin-1 dissociation from the Bcl-2/Beclin-1 complex, inhibited autophagy, and enhanced apoptosis. Previous studies have also shown that the inhibition of autophagy during apoptotic stress can increase apoptosis. 24,59 The combination treatment of VSV MP and 2-DG can abolish glycolysis, hinder OXPHOS, and then induce autophagy to antagonize glucose metabolism shortage for survival. Therefore, the suppression of autophagy in a timely manner is necessary for effective treatment. In fact, other research has demonstrated that simultaneous targeting of OXPHOS, glycolysis, and autophagy may be a promising strategy for treating KRAS-mutant human colorectal cancer tumors, which is consistent with our findings. 24
The effects of the 2-DG and VSV MP combination treatment on human U87 and rat C6 cell lines were significant. However, in glioblastoma U-118 cell lines, the addition of 2-DG to VSV MP-incubated cancer cells did not synergistically enhance apoptosis or caspase-3 activity (data not shown). This may be explained by heterogeneity of glioblastoma. U87 has more multiple energy-producing programs, less metabolic vulnerability, and enhanced autophagy cryoprotection than U-118 cell line. 60 –62 These suggested that the synergistic effect may depend on the tumor cell state or subtype. Glioblastoma, which is distributed along metabolic axes, has been uncovered as four tumor cell subtypes: proliferative/progenitor, neuronal, mitochondrial, and glycolytic/plurimetabolic. 63 Each subtype showed different enriched biologically coherent multiomic features. Mitochondrial glioblastoma cells exhibit marked sensitivity to mitochondrial inhibition; conversely, the glycolytic/plurimetabolic subgroup, which is sustained by the concurrent activation of multiple energy-producing programs (aerobic glycolysis plus anabolism of lipids and amino acids), confers metabolic versatility and protection from oxidative stress. 64 Numerous genes encoding enzymes or transporters involved in glycolysis and other metabolic pathways are enhanced in U87 and C6 cells. 19,65,66 These super enhancers reduce the dependency of tumor cells on one metabolic pathway and decrease metabolic vulnerability. In fact, the glycolytic/plurimetabolic group is more susceptible to death than the mitochondrial group. 64 Thus, targeting multimetabolism pathway activity is a potential therapeutic strategy to enhance the therapeutic effect on the glycolytic/plurimetabolic subtype.
BBB is a main obstacle to delivering therapeutic drugs into central neurological system (CNS). Previous studies have revealed that FUS can induce opening of the BBB and enhance the delivery of genes or drugs into CNS in nonviral and noninvasive manner. 33,67 –69 In this study, the use of FUS in moderate exposure level has fascinated liposomes crossing BBB and obtained antitumor benefit in vivo. Meanwhile, to enhance the BBB permeability, many other types of liposomes were used in preclinical and clinical trials, such as nonpegylated and pegylated liposome, 70,71 immunoliposomes, 72 ApoE or ApoE fragment-coated liposomes, 73,74 and others. Therefore, invasive technologies, such as direct brain injection and intrathecal brain delivery, are also alternative methods to break the BBBs 75,76 but highly efficient to gene delivery into CNS. 76
In our studies, the combination of VSV MP and 2-DG was shown to be a selective anticancer agent with no detectable toxicity either in vivo or in vitro. Our results revealed different responses between cancer and normal cells. The cell viability assay indicated that 293 cells had a higher cell viability after combined treatment in vitro. This is partly because mitochondrial dysfunction mediated by VSV MP is better compensated for in 293 cells to support ATP production, whereas the mitochondria in cancer cells are inherently dysfunctional. To fully understand the mechanism of cancer specificity, more research is required to examine the effect of VSV MP on mitochondria in various types of cancer cells.
In summary, we report in this study that for the combination of the VSV MP, an MP that impairs mitochondrial OXPHOS and alters glycolytic metabolism, and the antiglycolytic agent 2-DG synergistically enhanced apoptosis in U87 and C6 cells both in vivo and in vitro. Our study showed for the first time that the VSV MP causes mitochondrial dysfunction and activates the glycolytic pathway, suggesting that it may impact host cellular metabolism and modify metabolic pathways critical for the virus life cycle. Furthermore, the combination of VSV MP and 2-DG is complementary; VSV MP suppressed 2-DG-induced autophagy and induced a shift from survival to cell apoptosis. This complementary effect may have important implications for the treatment of glioblastoma.
Footnotes
ACKNOWLEDGMENT
The authors thank Yuke Tian and Renqin Li for their advice on investigation design and staff in Animal Experimental Center of Sichuan Cancer Center for providing technical support for the animal model.
AUTHORS’ CONTRIBUTIONS
Q.L. designed the whole investigation. Y.Z., J.C., and K.M. performed the experiments. K.M. and Y.L. provided important suggestions and materials. P.C. analyzed the experimental data. Y.Z. and M.K. edited the article.
DATA AVAILABILITY STATEMENT
All data of this study are available in the article or supplementary materials. Researchers could obtain all materials by contacting the corresponding author after completion of a license agreement, if they need.
AUTHOR DISCLOSURE
The authors declare that there is no conflict of interests.
FUNDING INFORMATION
This work was supported by the project of the
SUPPLEMENTARY MATERIAL
Supplementary Figure S1
Supplementary Figure S2
Supplementary Figure S3
Supplementary Table S1
Supplementary Table S2
Supplementary Table S3
References
Supplementary Material
Please find the following supplemental material available below.
For Open Access articles published under a Creative Commons License, all supplemental material carries the same license as the article it is associated with.
For non-Open Access articles published, all supplemental material carries a non-exclusive license, and permission requests for re-use of supplemental material or any part of supplemental material shall be sent directly to the copyright owner as specified in the copyright notice associated with the article.