
Abstract
Effective use of adeno-associated viruses (AAVs) for clinical gene therapy is limited by their propensity to accumulate in and transduce the liver. This natural liver tropism is associated with severe adverse events at the high doses that can be necessary for achieving therapeutic transgene expression in extrahepatic tissues. To improve the safety and cost of AAV gene therapy, capsid engineering efforts are underway to redirect in vivo AAV biodistribution away from the liver toward disease-relevant peripheral organs such as the heart. Building on previous work, we generated a series of AAV libraries containing variations at three residues (Y446, N470, and W503) of the galactose-binding pocket of the AAV9 VP1 protein. Screening of this library in mice identified the XRH family of variants (Y446X, N470R, and W503H), the strongest of which, HRH, exhibited a 6-fold reduction in liver RNA expression and a 10-fold increase in cardiac RNA expression compared with wild-type AAV9 in the mouse. Screening of our library in a nonhuman primate (NHP) revealed reduced performance of AAV9 and two closely related vectors in the NHP liver compared with the mouse liver. Measurement of the galactose-binding capacity of our library further identified those same three vectors as the only strong galactose binders, suggesting an altered galactose presentation between the mouse and NHP liver. N-glycan profiling of these tissues revealed a 9% decrease in exposed galactose in the NHP liver compared with the mouse liver. In this work, we identified a novel family of AAV variants with desirable biodistribution properties that may be suitable for targeting extrahepatic tissues such as the heart. These data also provide important insights regarding species- and tissue-specific differences in glycan presentation that may have implications for the development and translation of AAV gene therapies.
INTRODUCTION
Developing adeno-associated virus (AAV) gene therapies for non-liver indications involves carefully balancing on-target peripheral transduction with off-target liver transduction. Although sufficient AAV-mediated expression of a given genetic payload in the liver can be achieved at a dose of 1 × 10¹⁰–1 × 10¹² genome copies (GC)/kg, 1 doses exceeding 1 × 10¹⁴ GC/kg have often proven necessary to achieve therapeutic transgene expression in extrahepatic target organs. 2 In addition to substantially raising production costs, such high doses are associated with safety risks that can manifest as fatal liver toxicity. 2 –5 Indeed, four recent deaths in Astellas’ ASPIRO gene therapy trial associated with previously unknown liver contraindications exemplify the constraints that undesired hepatic transduction imposes on the use and expansion of AAV gene therapies. 6 Thus, there remains an unmet clinical need for improved AAV vectors with more desirable biodistribution profiles. To this end, advances in synthetic DNA technology and next-generation sequencing have enabled the field of capsid engineering to generate and screen large and diverse AAV libraries, with the goal of identifying capsid variants with enhanced transduction profiles. 7
AAV9 is an excellent starting point for these capsid engineering efforts, exhibiting broad tissue tropism coupled with high levels of in vivo transduction and viable manufacturing titers. 8 Zolgensma®, a gene therapy for spinal muscular atrophy approved by the Food and Drug Administration, uses AAV9 because of its ability to highly transduce the central nervous system in mice, 9 nonhuman primates (NHPs), 10 and humans. 11,12 The in vivo superiority of AAV9, however, stands in stark contrast to its poor performance in vitro, particularly when compared with other naturally occurring AAV vectors. 5 For instance, AAV2 exhibits strong in vitro performance but performs poorly in vivo, 13 –15 and thus, its clinical applications are limited. While AAV9 was isolated in vivo from human tissue and was thus adapted for proliferation in vivo, AAV2 was isolated as a contaminant of serially passaged adenovirus preparations and was thus adapted to proliferation in vitro. 16 –18 The in vitro infectivity of AAV2 is generally attributed to its ability to bind to the cell surface glycan heparan sulfate proteoglycan, 14,15,19 which was lost in AAV2 variants that were adapted for in vivo purposes. 15 In contrast, AAV9 is unique among serotypes 1–9 for its ability to bind desialylated galactose residues on extracellular glycoproteins. 13,20 –22 Studies have shown that modulation of vector–galactose interactions exerts significant effects on the half-life, transduction potential, and biodistribution of AAV9 both in vitro and in vivo. 21 –23
Thus, early glycan-focused capsid engineering efforts were limited to a small set of glycan-binding lectins and glycosidases 21 in which glycomic characterization was largely qualitative. These early studies were limited primarily by the massive technical complexity inherent to the study of glycans. Glycans are an incredibly diverse group of branching, nontemplated chemical entities that arise from a tightly regulated set of interconnected enzymatic reactions. 24 Unlike genomic data, which have the benefit of template-based sequencing readouts, glycome quantification requires direct analysis of each individual glycan in a given sample to enable hypothesis testing. 25 As more sensitive, high-throughput techniques become available, comparative glycomics datasets represent an increasingly viable approach for understanding biological phenomena. 25,26
Our group first described the AAV9 galactose-binding pocket as a five amino-acid cluster on the AAV9 VP1 protein as follows: D271, N272, Y446, N470, and W503. 27 Work from our group and others identified alanine substitutions at or near the galactose-binding pocket that yielded AAV9 variants with significant liver detargeting, albeit at the cost of overall transduction in peripheral organs. 20,27 We postulated that more comprehensive modulation of the AAV9 galactose-binding pocket could generate liver-detargeted variants with preserved peripheral transduction. Therefore, we generated a library of galactose-binding variants and screened it through various model systems to identify top-performing candidates. Our investigation into the potential mechanism(s) underpinning the observed effects of capsid modification led to analyses of the role of galactose binding in tissue-specific transduction. In addition to identifying novel liver-detargeted variants that exhibit enhanced peripheral transduction, our library screening incorporated comparative glycomics and yielded novel insights with implications for the safety and translatability of AAV gene therapies.
MATERIALS AND METHODS
Individual vector production
All individual vectors were produced by the Penn Vector Core at the University of Pennsylvania as previously described. 28 For individual vectors, we transfected a trans plasmid encoding the rep and a cap gene of a given vector into human embryonic kidney (HEK293) cells along with a cis plasmid containing enhanced green fluorescent protein (eGFP) under the control of a CB7 promoter and followed by a woodchuck hepatitis virus post-transcriptional regulatory element (WPRE). For each individual vector, we utilized an equimolar mix of three cis plasmids that were identical except for a short (8-bp) barcode immediately following the stop codon. We purified the vectors using an iodixanol gradient and stored the vectors in phosphate-buffered saline (PBS).
Library production
We submitted pooled vector library plasmids to the Penn Vector Core at the University of Pennsylvania for AAV library production. Vectors were produced using a triple transfection technique, as described previously. 29 In brief, the cap gene was moved from the trans plasmid to the cis plasmid, where all possible library variants were cloned in a pooled manner using Gibson assembly. This pooled library cis plasmid was transfected at a limiting dilution such that individual producer cells received only a single cap containing cis plasmid. The rep-containing trans plasmid and helper plasmids were transfected as for individual vector production. The resulting pool of vectors was then purified as above.
Cell culture
Chinese hamster ovary Lec cell lines
Pro-5, Lec-1, Lec-2, and Lec-8 cells (American Type Culture Collection, Manassas, VA) were cultured in alpha-modified minimum Eagle’s medium (aMEM) + 10% fetal bovine serum (FBS; Corning, New York, NY) and 1% penicillin–streptomycin (P/S; Thermo Fisher Scientific, Waltham, MA).
Cell-binding experiments
Chinese hamster ovary (CHO)-Lec lines were cultured in 6-well culture dishes (n = 3 wells/condition) in aMEM + 10% FBS + 1% P/S. We plated 2 × 10⁵ cells/well 24 h before transduction and allowed the cells to grow to a monolayer. At the time of the experiment, we removed the media and washed the cells with cold PBS, followed by incubation at 4°C in serum-free aMEM containing 1 × 10⁵ multiplicity of infection (MOI) of each vector ± 0.1 M D-galactose (Thermo Fisher Scientific). We incubated the plates at 4°C for 1 h before rinsing the plates three times with cold PBS. Plates were either taken for DNA extraction to determine binding or were covered with serum-free media for 3 days for transduction and GFP imaging.
Library transduction experiments
We cultured CHO-Lec lines in 15-cm dishes (n = 5 dishes/condition) as described above. We plated 5.5 × 10⁶ cells/dish 24 h before binding of the second-round library at an MOI of 1 × 10⁵. The library was bound to cells at 4°C, as described above, followed by PBS washes and replacement with serum-free media for 3 days. On day 3, cells were rinsed with PBS before the addition of TRIzol, followed by RNA extraction and library preparation, as described below.
GFP transduction enzyme-linked immunosorbent assay
We plated 2 × 10⁵ cells/well 24 h before transduction in aMEM + 10% FBS + 1% P/S. On the day of the experiment, we rinsed the cells with PBS and replaced the media with serum-free aMEM + 1 × 10⁵ MOI of test vectors packaging a GFP transgene. We replaced the media 24 h post transduction. Cells were removed from wells by scraping into 1× cell extraction buffer from an Abcam GFP enzyme-linked immunosorbent assay (ELISA) kit on day 3 post transduction (Abcam, Waltham, MA). We then measured GFP levels via the Abcam ELISA kit and total protein levels via the PierceTM BCA assay (Thermo Fisher Scientific).
Galactose bead experiments
Experiment
We washed galactose-immobilized agarose beads (Pierce) three times with PBS before blocking the beads in 1× bead volume of 1% bovine serum albumin (BSA). A 1:1 BSA:bead mixture was added to a 0.5-mL Eppendorf tube and placed on a tube spinner for 2 h. Tubes were then spun down and supernatant removed, followed by the addition of varying concentrations of galactose (Sigma-Aldrich, St. Louis, MO) in PBS and then 2 × 10¹¹ GC/tube of each vector, either library or individual. Tubes were then spun on a tube spinner for 2 h. The tip of each tube was then slit with a scalpel and spun into a collection tube. We recorded the mass of dry beads in each tube before resuspending the beads in PBS and transferring them to a final collection tube.
Sample processing
We vortexed the resuspended beads and then treated them with Turbo DNase (Ambion, Waltham, MA) to remove non-encapsidated genetic material, followed by treatment with Qiagen (Germantown, MD) protease to inactivate the DNase and expose vector genomes. We diluted individual vector samples 1:1 in H2O before applying quantitative polymerase chain reaction (qPCR) using a TaqMan primer/probe pair targeting the eGFP transgene from the vector genome and the TaqMan Universal PCR Master Mix (Applied Biosystems, Waltham, MA). Amplicons from library samples for Fig. 5B were generated as described below.
AAV9-W503A in vivo comparison
RNA extraction
We homogenized chipped tissue in 1 mL TRIzol using a steel bead and Qiagen TissueLyser (1–2 min at 30 Hz). RNA was precipitated and then treated with Qiagen DNase, followed by RNA cleanup using Qiagen RNeasy columns before reverse transcription via MultiScribe reverse transcriptase per the manufacturer’s protocol (Applied Biosystems).
DNA extraction
We homogenized chipped tissue in ATL buffer from the QIAmp DNA Extraction Kit (Germantown, MD). Proteinase K was added, followed by an overnight incubation at 54°C. We performed DNA extraction per the manufacturer’s instructions.
qPCR
We performed qPCR using the TaqMan 2× Universal PCR Master Mix, No AmpErase, UNG (Applied Biosystems) and primer/probe sets targeting the rBG polyA tail from the transgene. The thermal cycle parameters involved a 10-min activation at 95°C followed by 40 cycles of 30 s at 95°C and 1 min at 60°C in the presence of a standard curve for the primer/probe pair.
GFP direct fluorescence on frozen sections
We fixed tissue samples for ∼24 h in 10% buffered formalin. Samples were briefly rinsed in PBS and then transferred into 15% sucrose in PBS for several hours at 4°C until the tissues sank, followed by incubation in 30% sucrose in PBS overnight at 4°C. The tissues were then placed into cryomolds after excess sucrose solution was removed with a paper towel, covered with Tissue-Tek optimal cutting temperature compound (Sakura, Torrance, CA), and frozen via submersion into 2-methylbutane cooled with dry ice. We prepared cryosections at 10-µm thickness and mounted the cryosection with Fluoromount G (Electron Microscopy Sciences, Hatfield, PA) containing 4′,6-diamidino-2-phenylindole (DAPI) to stain nuclei. We imaged the slides for 150 ms using the fluorescein isothiocyanate channel for liver sections and for 1 s for heart sections.
Dose–response study
DNA/RNA extraction
Chipped tissue was homogenized in super RLT buffer plus beta-mercaptoethanol, followed by DNA extraction using a Qiagen AllPrep kit per the manufacturer’s instructions. A separate tissue chip was homogenized in TRIzol, followed by a progressive isopropanol/ethanol precipitation. We then treated the extracted RNA with Turbo DNase (Thermo Fisher Scientific) before using the RNA as a template for complementary DNA (cDNA) generation using MultiScribe reverse transcriptase (Applied Biosystems) per the manufacturer’s instructions.
qPCR
We performed qPCR using the TaqMan 2× Universal PCR Master Mix, No AmpErase, UNG (Applied Biosystems) and primer/probe sets targeting the eGFP transgene. The thermal cycle parameters involved a 10-min activation at 95°C followed by 40 cycles of 30 s at 95°C and 1 min at 60°C in the presence of a standard curve for the primer/probe pair.
GFP direct fluorescence on paraffin sections
Sections from formalin-fixed, paraffin-embedded liver were deparaffinized and hydrated through a xylene and ethanol series and then coverslipped with Fluoromount G containing DAPI as a mounting medium.
GFP immunohistochemistry on paraffin sections
We performed immunohistochemistry (IHC) on sections from formalin-fixed, paraffin-embedded tissues on a Leica Bond Rx autostainer following a standard IHC protocol with the Bond polymer detection system (Leica Biosystems, DS9800, Deerfield, IL) with 3,3′-diaminobenzidine as a chromogen. Bond Epitope Retrieval 1 solution (citrate buffer) was used for antigen retrieval. We applied a goat antibody against GFP (Novus NB100-1770, Centennial, CO) at 1:500 dilution with a 30-min incubation time as the primary antibody. The staining protocol included hematoxylin staining to label nuclei. After staining, the slides were dehydrated through ethanol and xylene and coverslipped.
Slide scanning
We scanned the slides using either a Leica Aperio AT2 scanner for bright-field sections or an Aperio Versa scanner (Leica Biosystems) for fluorescence sections (100-ms exposure time).
Image editing
Heart images
Snapshots from quPath were imported into Adobe Photoshop, where all images were scaled such that the 800-µm scale bar was 2 cm on the page. We imported a commonly formatted scale bar of the same proportion after scaling when the base image scale bar had inconsistent formatting. We then used the “remove background” tool from Photoshop to remove white background areas and non-tissue debris, followed by manual cross-checking with the base image to ensure that no changes were made to the tissue itself. Images were then rotated into vertical alignment and exported into Adobe Illustrator. In Illustrator, we scaled all images such that their embedded scale bars were equivalent before final arrangement on the page.
Liver images
We scaled quPath exports in Illustrator such that their embedded 100-µm scale bars were equivalent before arrangement on the page.
Animals
Animal procedures statement
All animal procedures were approved by the Institutional Animal Care and Use Committee of the University of Pennsylvania.
Mice
We purchased 6- to 8-week-old male C57Bl6/J mice from Jackson Labs (Bar Harbor, ME).
Mouse studies
For all mouse studies, 6- to 8-week-old male C57Bl/6 mice received the following respective dose: 1 × 10¹² GC/mouse for the AAV9-W503A comparison (Fig. 1), c1 × 1012 GC/mouse of the first-round and second-round libraries (Figs. 2, 3), or 5 × 10¹², 1 × 10¹³, or 5 × 10¹³ GC/kg (Fig. 3). We administered the vector as a 100-µL injection with a PBS diluent (Corning) via tail vein injection. We included n = 4 for the first-round library, n = 5 for the second-round library, and n = 3/group for individual comparisons. Mice were necropsied on day 14 post injection, and tissues were flash frozen on dry ice after harvesting. For glycan profiling, 6- to 8-week-old male C57Bl/6J mice were euthanized and necropsied. Tissues were flash frozen on dry ice after harvesting.
AAV9 and W503A have different levels of galactose binding and transduction in vitro and in vivo.
Galactose-binding pocket library screen in mice identifies a preference for alternative aromatic amino acids in liver-detargeted vectors.

Second-round galactose library screen identifies an XRH family of liver-detargeted vectors with enhanced cardiac transduction.
NHPs
Housing
We conducted an NHP study at the University of Pennsylvania within a facility that is registered with the U.S. Department of Agriculture, accredited by the American Association for Accreditation of Laboratory Animal Care, and assured by the Public Health Service.
As previously described, 30,31 one wild-type (WT) cynomolgus macaque was housed in a stainless-steel squeeze-back cage with a perch. Cage size and housing conditions were compliant with the Guide for the Care and Use of Laboratory Animals. A 12-h light/12-h dark cycle was maintained and controlled via an Edstrom watchdog system. The animal was fed certified primate diet 5048 (PMI Feeds, Arden Hills, MN) twice per day (morning and evening). We also provided an additional variety of food treats that were fit for human consumption, including fruits, vegetables, nuts, and cereals, daily as part of the standard enrichment process. Manipulanda, such as kongs, mirrors, a puzzle feeder, and raisin balls, were provided daily. The animal also received visual enrichment and daily human interaction. All interventions were performed during the light cycle, and the animal was fasted overnight before being anesthetized.
Vector injection and necropsy
On study day 0, the cynomolgus macaque received 5 × 10¹³ GC/kg (body weight) of AAV-L9Gal2.CMV.VP1.rBG as a 10-mL infusion of vector into the saphenous vein at a rate of 1 mL/min delivered via an infusion pump (Harvard Apparatus, Holliston, MA), as previously described. 31 The animal was anesthetized, and blood was drawn via the femoral vein on days 0, 3, 7, and 14 for analysis of complete blood counts, clinical chemistry, and coagulation panels by Antech (Pittsburgh, PA). We determined neutralizing antibody titers using serum samples taken before the initiation of the study, as previously described. 32 The animal had neutralizing antibody titers of <1/5 for AAV9 before vector administration. On day 14 post-vector administration, the animal was euthanized and necropsied.
Library studies
Library study tissue processing
We isolated RNA from extracted tissues via TRIzol extraction (Thermo Fisher Scientific), followed by isopropanol/ethanol precipitation. Samples were further purified via phenol-chloroform extraction before precipitation and resuspension in H2O. We converted the RNA samples to cDNA using the SuperScript IV first-strand synthesis system (Invitrogen, Waltham, MA). This system contains an EZ-DNase step and uses a library-specific reverse primer for cDNA synthesis.
Vector DNA preparation
Any sample containing encapsidated vector genomes (vector library sequencing, cell-binding/bead-binding assays) was treated with Turbo DNase at 37°C for 30 min, followed by proteinase K (Qiagen) digestion at 50°C for 30 min and heat inactivation at 95°C for 15 min to expose vector genomes for use in downstream applications.
Library amplicon generation and sequencing
We performed amplicon generation in two phases. In the first phase, we amplified the library cDNA using the Kapa HiFi HotStart Real-Time Library Amplification Kit (Roche, Indianapolis, IN) and library amplification primers. For each sample, we selected cycle numbers to correspond to a consistent amplification peak within the linear phase of amplification. We then repeated the library amplification with the determined cycle number using the Kapa HiFi HotStart Library Amplification Kit (Roche). Amplicons were then prepped for Illumina sequencing as previously described 29,33 –35 and sequenced on a MiSeq or NextSeq instrument (Illumina, San Diego, CA) depending on the number of samples being run.
Library analysis
The code for library analysis is available upon request. In brief, raw count files were demultiplexed and filtered to remove non-amplicon sequencing artifacts. We calculated the reads per million (RPM) and enrichment for each sequence in each sample, as shown in Supplementary Table S1.
Glycan profiling
Glycan profiling sample acquisition
NHP
We obtained heart and liver tissue from untreated NHPs (cynomolgus macaque [Macaca fascicularis] and rhesus macaque [M. mulatta]) necropsied at the University of Pennsylvania’s Gene Therapy Program. We supplemented these samples with heart/liver samples from the Tulane National Primate Research Center and the University of Puerto Rico Caribbean Primate Research Center.
Mouse
Heart and liver tissues were removed and flash frozen from 6- to 8-week-old C57Bl6/J mice (Jackson Labs) within the University of Pennsylvania’s Gene Therapy Program.
Human
Human heart samples (Cardinal Biologicals, Cape Girardeau, MO) were received frozen, thawed at 4°C for sectioning, and then stored at −80°C before processing for glycan profiling. Human liver samples were obtained frozen from BioIVT (Westbury, NY).
Glycan analysis
We utilized the Children’s Hospital of Philadelphia metabolic laboratory glycan profiling service to analyze N-glycans for our samples. We applied flow injection–electrospray ionization–quadrupole time-of-flight mass spectrometry to generate N-glycan profiles as previously described. 26,36,37 In brief, we homogenized tissue samples in nuclease-free water in a Qiagen TissueLyser with a steel bead. Following homogenization, tissue homogenates were filtered through a 40-µm cell strainer to remove gross tissue remains and placed in an Amicon 3KD protein concentration filter (Sigma-Aldrich). Tissue samples were then washed three times with water, followed by heat inactivation and PNGase F treatment to release N-glycans. Hydrophilic interaction liquid chromatography allowed for isolation of the N-glycans, followed by electrospray ionization mass spectrometry for glycan profiling. We analyzed peak data in skyline by the metabolic core, yielding glycan-specific concentration values. These data were analyzed in R to calculate galactose exposure. In brief, sample-specific concentrations were normalized to the total sample glycan concentration to allow for cross-sample comparisons of each glycan (Fig. 6B). Each glycan was then corrected stoichiometrically based on the number and type of exposed glycan ends to yield sample specific glycan exposure percentages. This code is available upon request.
Plasmids and cloning
We designed AAV9 capsid variants or libraries in silico and then ordered the variants or libraries from Integrated DNA Technologies (Coralville, IA) either as a pool of single-stranded oligos for libraries or individually for individual vectors. These oligos were cloned into linearized AAV9 cis or trans plasmids via Gibson assembly using the Gibson 2× HiFi Master Mix (New England Biolabs [NEB], Ipswich, MA). Plasmid libraries were then electroporated into electrocompetent cells (NEB), whereas individual plasmids were transformed using heat shock before incubation at 37°C in 2× yeast extract tryptone media for plasmid production and purification using Qiagen Mega Prep Kits.
RESULTS
The W503A substitution removes AAV9’s ability to bind galactose, in addition to abrogating in vitro and in vivo transduction
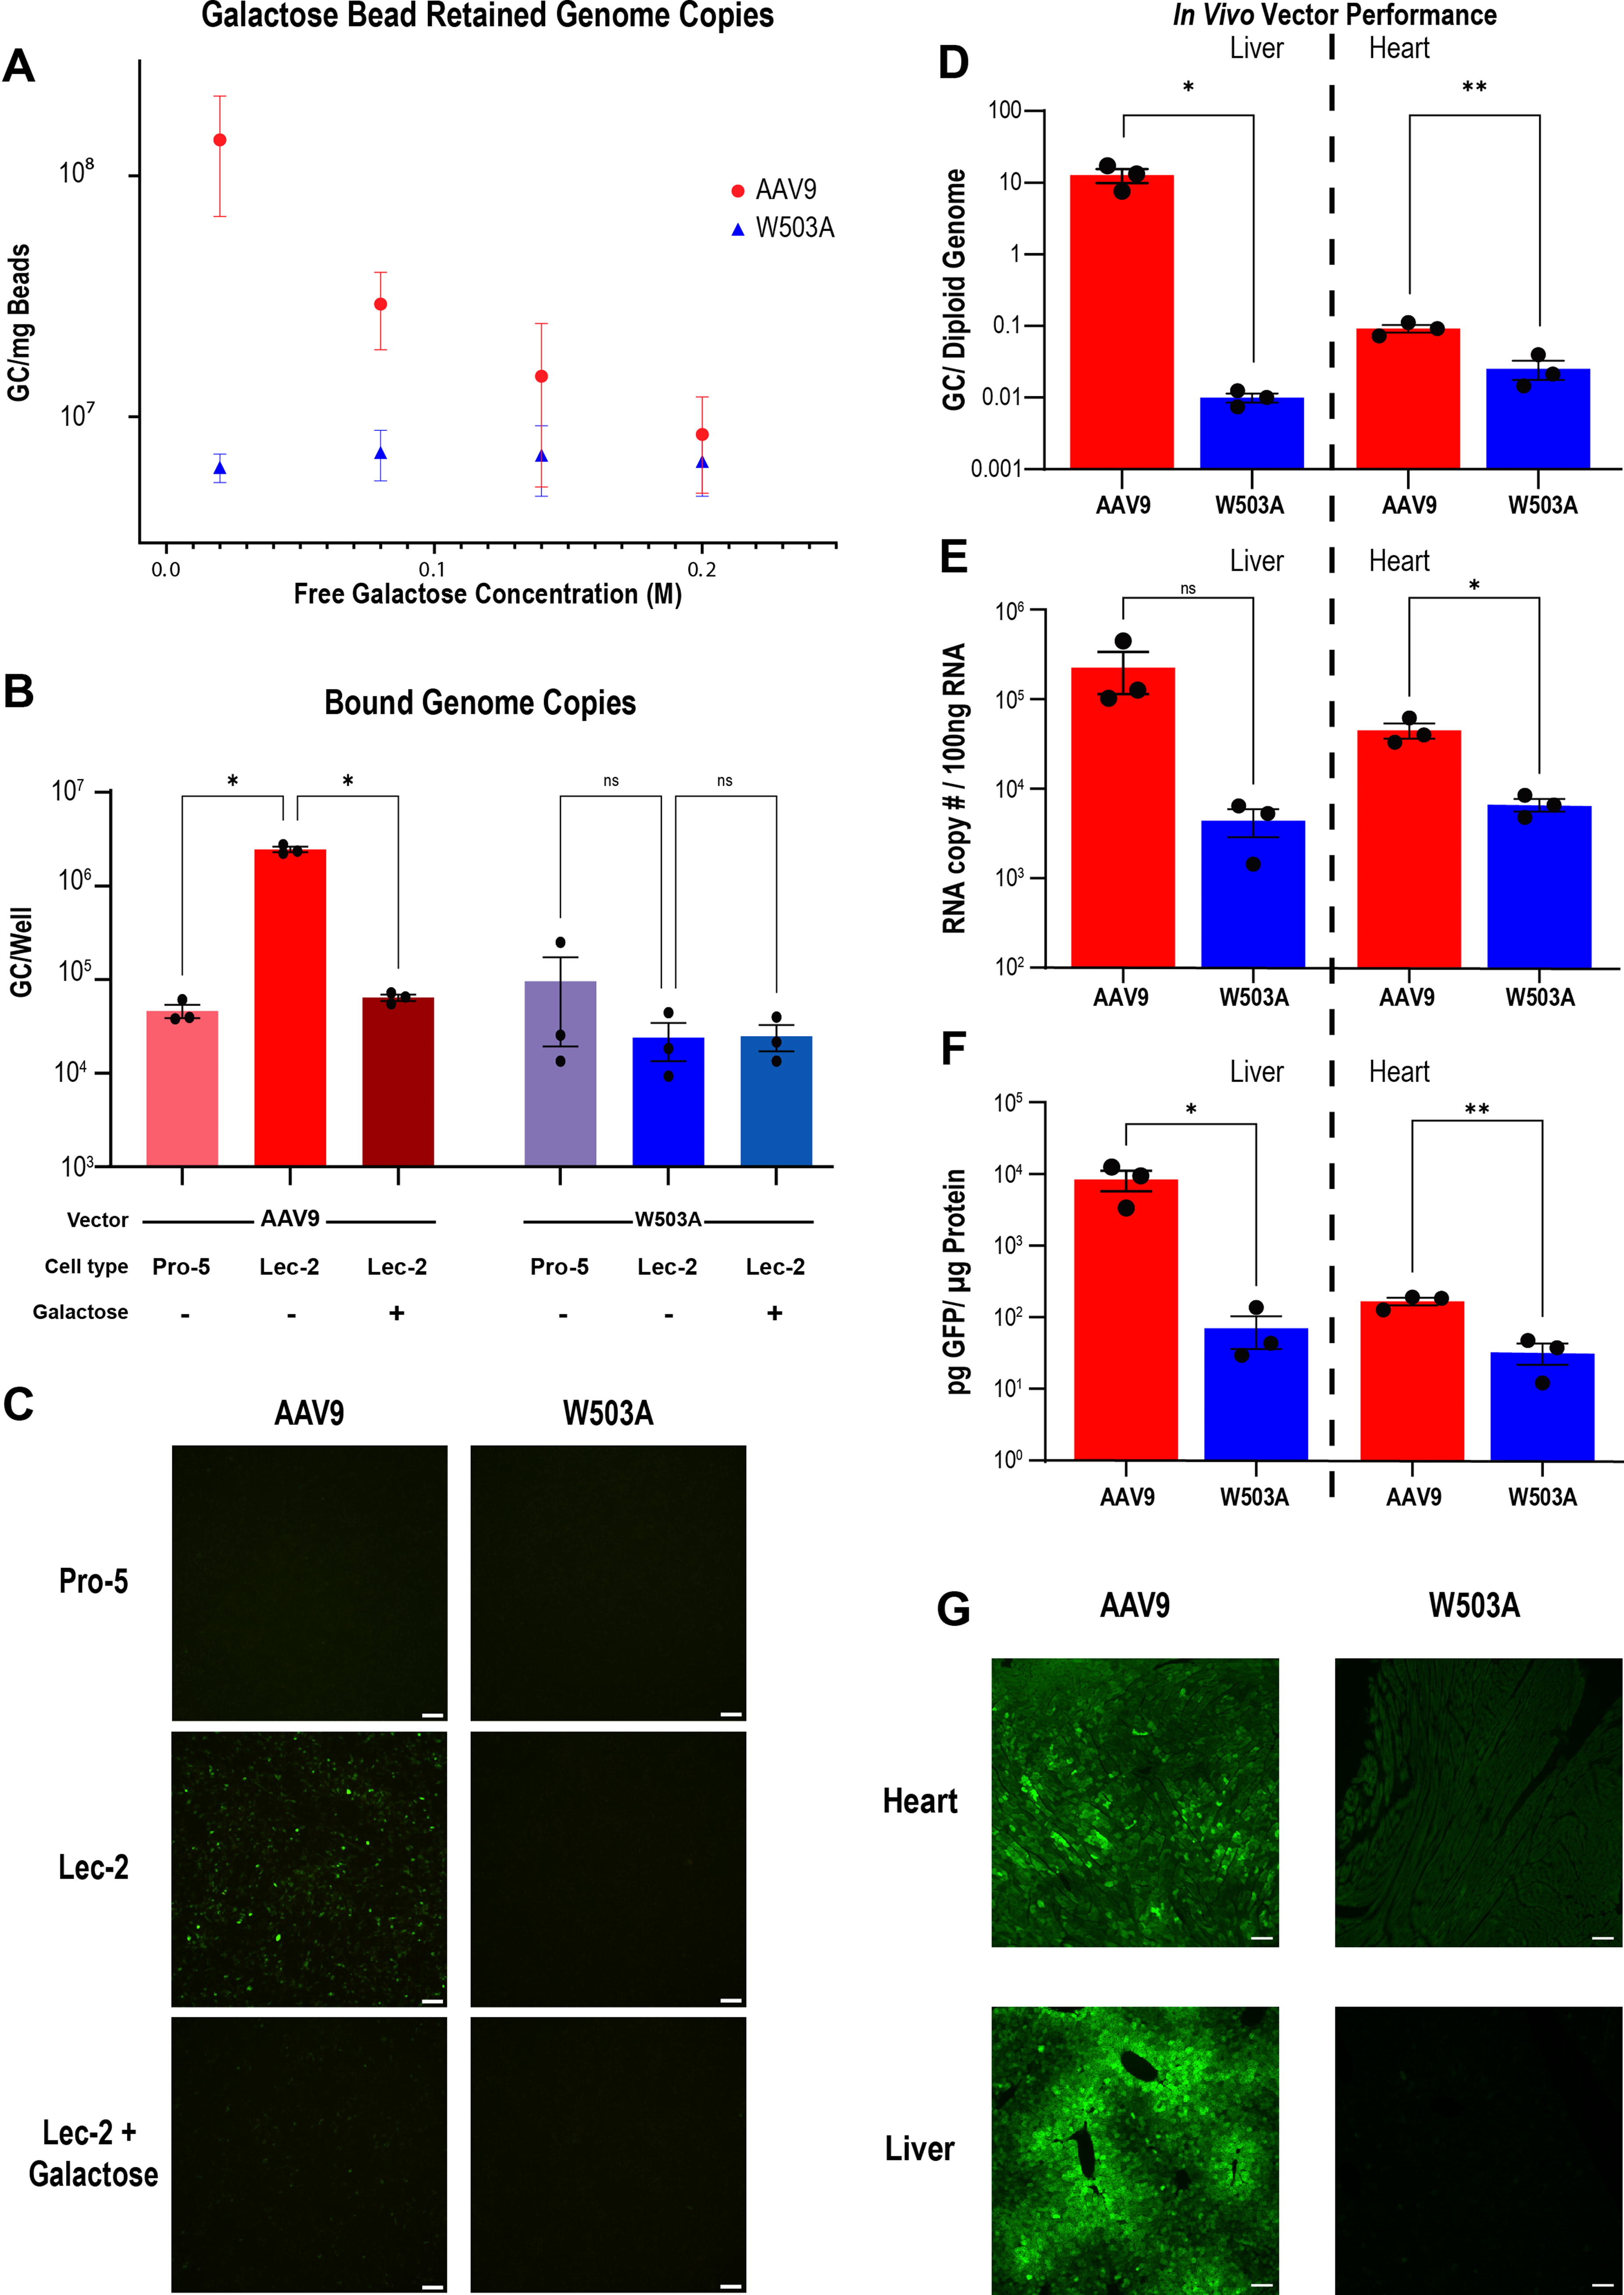
In an effort to establish positive and negative controls for this study, we directly measured the galactose-binding ability of AAV9 and a notable galactose-binding pocket mutant, W503A. Each vector was bound directly to D-galactose-immobilized agarose beads in the presence of a gradient of D-galactose concentrations, followed by complete removal of binding supernatant (Fig. 1A). qPCR analysis of retained GC at each galactose concentration enabled a quantification of each vector’s galactose-binding capacity. Binding to galactose beads in PBS in the absence of galactose showed a 13.2-fold difference in binding between AAV9 and W503A, a difference that was abrogated with increasing galactose concentration (Fig. 1A). This finding indicates that AAV9 readily bound galactose, whereas W503A did not.
We then used the CHO-Lec cell lines to characterize the in vitro galactose-mediated transduction of AAV9 and AAV9-W503A carrying GFP as a reporter transgene (Fig. 1B, C). Compared with WT (Pro-5) CHO cells, Lec-2 cells carry defects in CMP-sialic acid transport across the Golgi membrane that result in reduced levels of terminal sialylation, increasing the quantity of exposed galactose residues. 38 Cell-binding assays indicated a 53-fold increase (p < 0.0001) in bound AAV9 genomes on Lec-2 (high galactose) cells compared with Pro-5 (WT) cells. The addition of 0.1M galactose to the transduction media blocked AAV9 binding and transduction of Lec-2 cells, resulting in complete reversion of both binding and transduction. Conversely, AAV9-W503A exhibited no binding advantage on Lec-2 cells, while being unaffected by the addition of soluble galactose (Fig. 1B, C). These data indicate that increasing galactose exposure on transduction targets enhances AAV9 transduction, and disruption of this interaction either via soluble galactose competition or genetically via capsid mutagenesis abrogated this enhancement.
We next evaluated the in vivo activity of AAV9 and AAV9-W503A by administering these vectors to mice via intravenous tail vein injection at a dose of 1 × 10¹² GC/mouse. We measured the DNA biodistribution using qPCR for intact vector genomes, RNA expression levels using reverse transcription qPCR against transgene mRNA product, and protein levels via GFP ELISA and GFP histology (Fig. 1D–G, respectively). Consistent with previous data, W503A was detargeted from the liver at all levels of analysis compared with WT AAV9 (1,275× at the DNA level, 51× at the RNA level, and 120× at the protein level). The magnitude of difference between AAV9 and AAV9-W503A was more marked in liver than heart tissue, with 3.6×, 6.8×, and 5.2× reductions at the DNA, RNA, and protein levels in the heart, respectively. In summary, the data in Fig. 1 confirm the overall detargeting profile of AAV9-W503A while implicating galactose binding as the mechanism underpinning this functional difference.
First-round galactose-binding pocket library screening in mice reveals a preference for alternative amino acids in heart-enriched variants
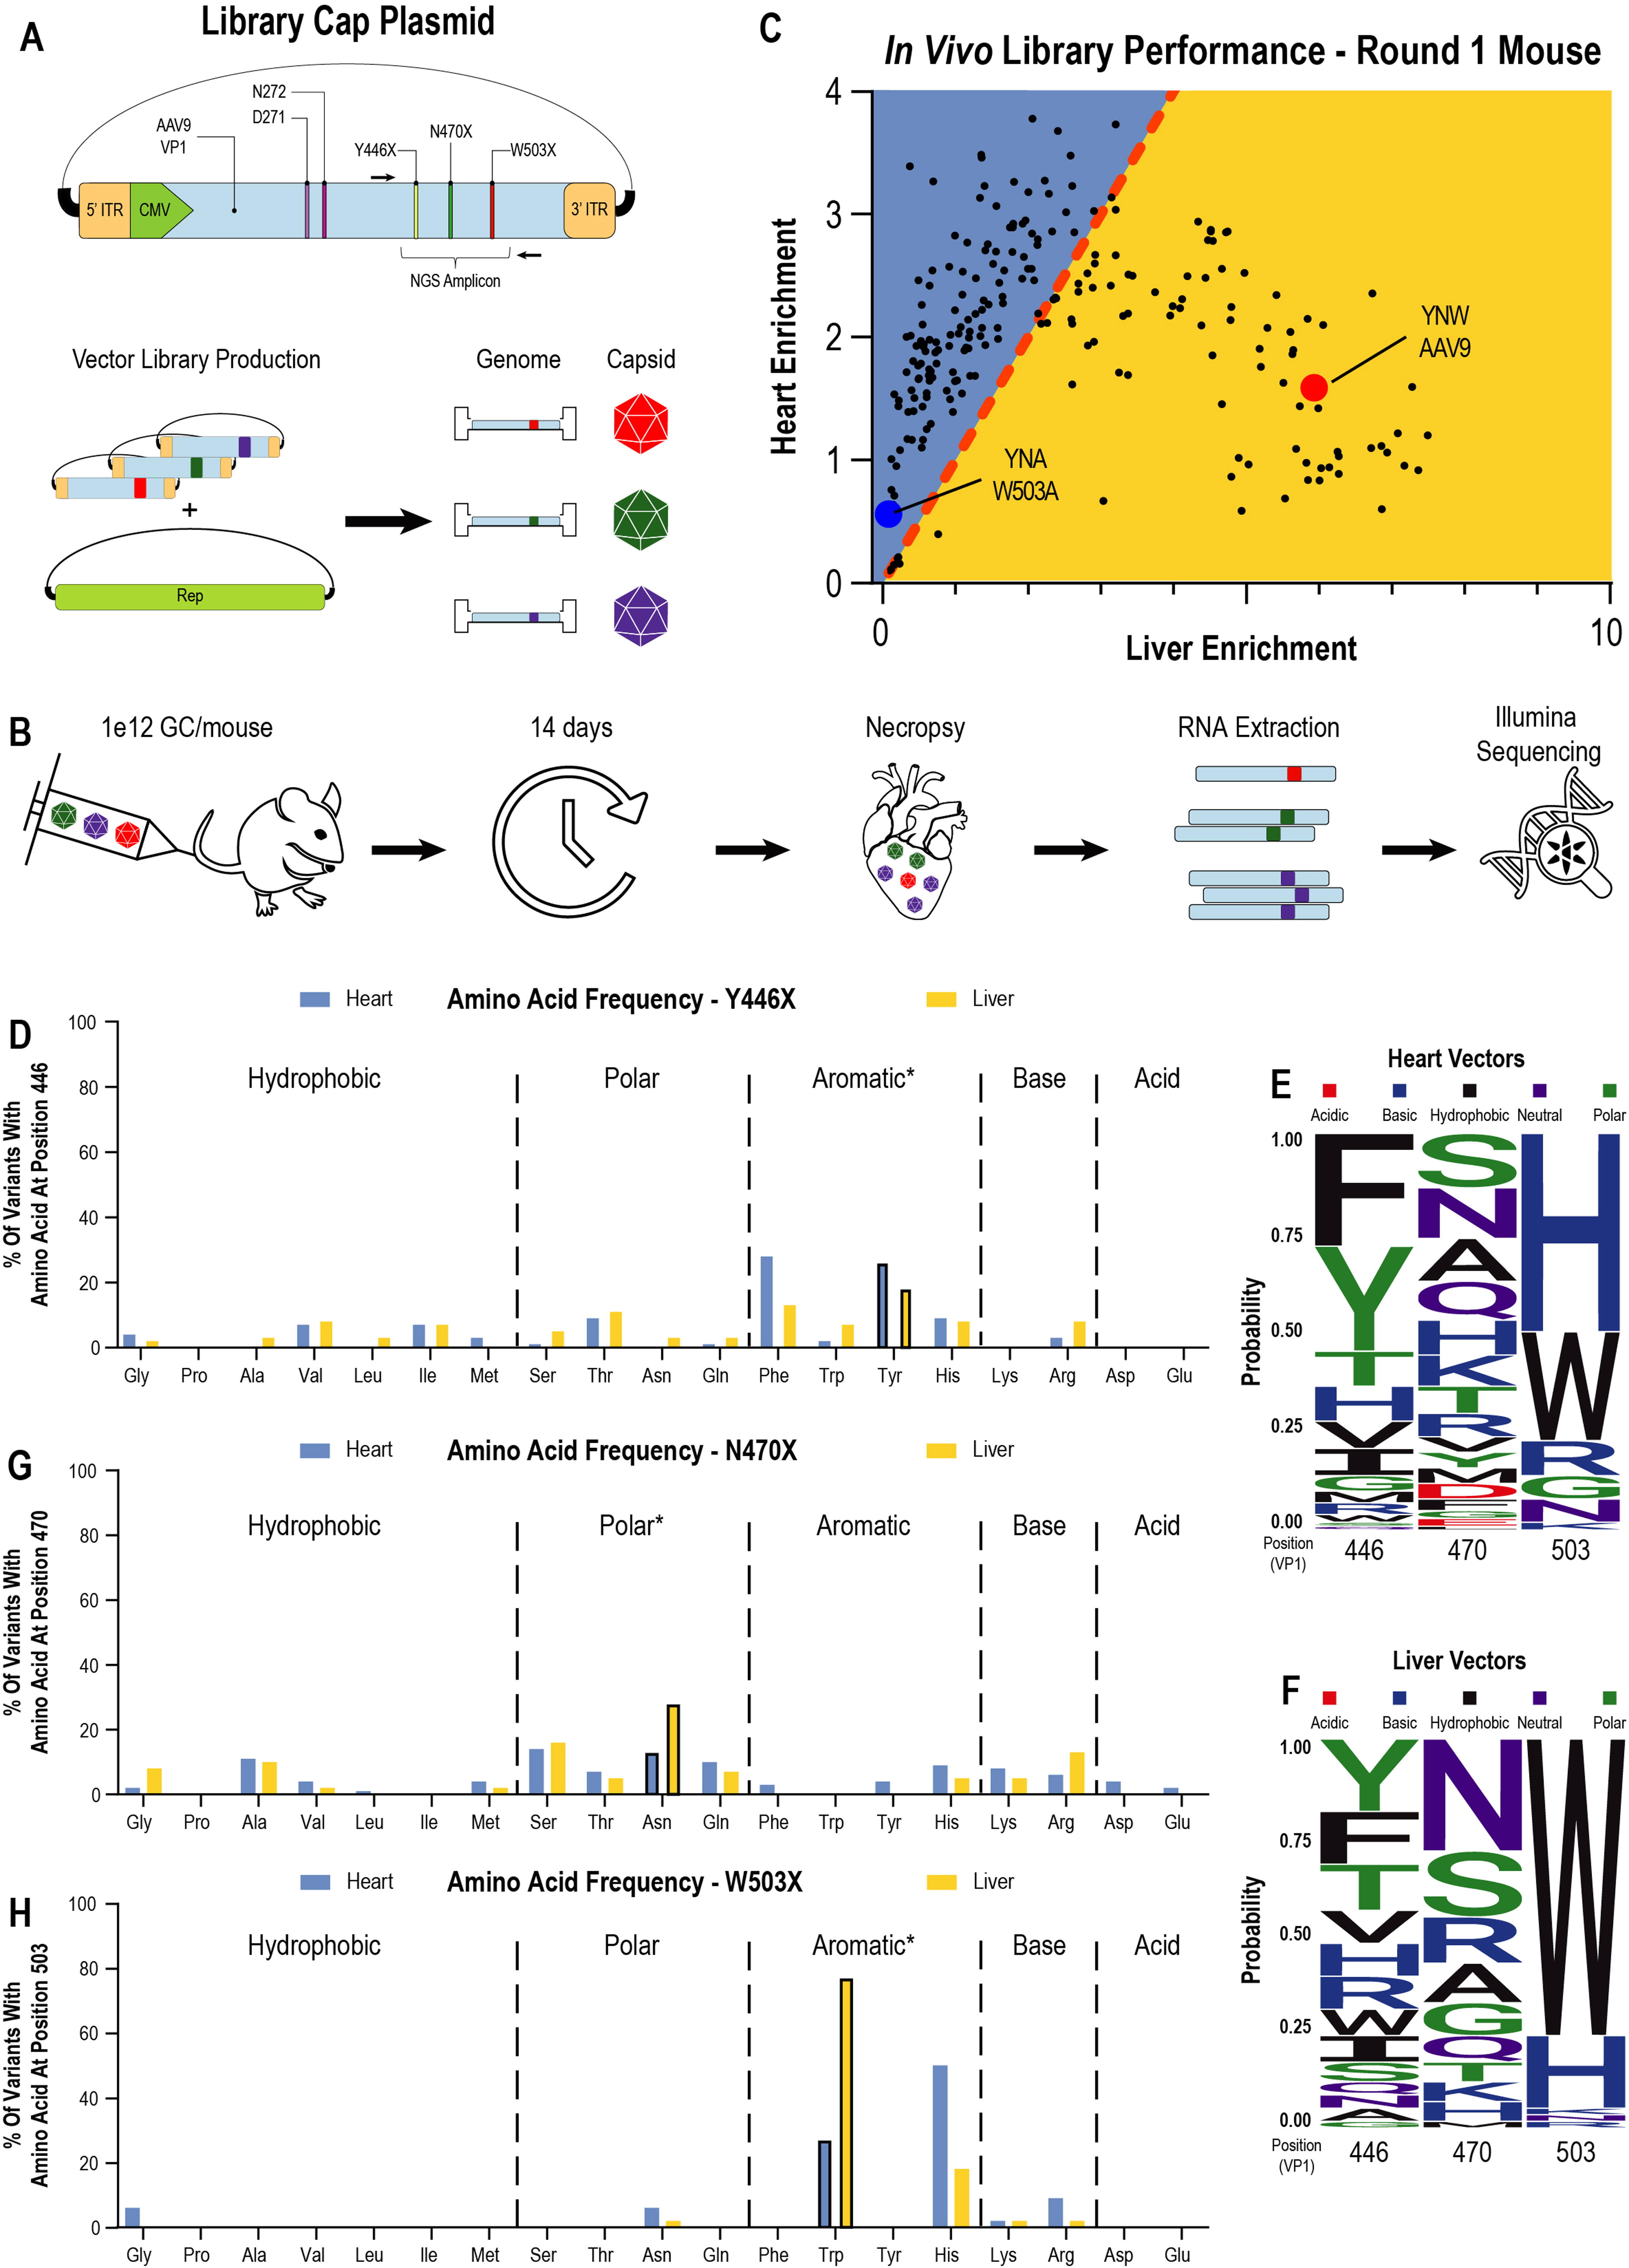
We next sought to identify variants that might exhibit liver-detargeting properties similar to those of W503A but with preserved or enhanced peripheral transduction. Thus, we generated an AAV library containing every possible combination of amino acids in the final three amino-acid residues in the AAV9 binding pocket: Y446, N470, and W503. We excluded cysteine to prevent unwanted disulfide bridge formation, which could lead to poor capsid assembly or aggregation. This resulted in a single pooled vector library containing 6,859 (i.e., 193) unique AAV9 variants, each one packaging a genome encoding its own respective capsid sequence (Fig. 2A).
We administered this library to C57Bl6/J mice (n = 4) via intravenous tail vein injection at 1 × 10¹² GC/mouse (Fig. 2B). Animals were necropsied on day 14 post injection, and tissues were harvested for RNA extraction, cDNA synthesis, and short-amplicon generation. We generated amplicons from extracted cDNA and from both the input production plasmid and resulting vector. We then sequenced the amplicons on an Illumina sequencer to determine proportional vector representations of each capsid variant at each stage of production and transduction. We calculated three performance metrics for each vector as follows: yield score, cardiac enrichment, and liver enrichment (Supplementary Table S1). Enrichment can be understood as the abundance of a given vector ratio in an experimental condition normalized to its abundance in the input library; therefore, an enrichment of 1 indicates a vector whose abundance is no higher or lower than would be expected based on its input abundance. To limit our analysis to vectors that would be viable for production at scale, vectors with a yield score <25% of AAV9 were excluded from analysis. This filtering left ∼200 vectors for further analysis.
Liver versus cardiac enrichment for the filtered vector set is shown in Fig. 2C. The distribution of all vectors across heart and liver tissue resembled a quadratic parabola. Vectors near the origin represent poor overall vectors that exhibit low levels of enrichment in both the heart and liver. W503A fell in this portion of the graph, grounding the minimal in vivo activity for vectors in this dataset with a previously tested negative control. Progression away from the origin first uncovered vectors with higher levels of cardiac enrichment than liver enrichment. This subset of vectors (above the line of identity, blue background in Fig. 2C) reaches an inflection point at a maximum cardiac enrichment of 2- to 3-fold greater than that of AAV9. Vectors with this highest degree of cardiac enrichment are also detargeted from the liver, with liver enrichment values 2- to 3-fold lower than that of AAV9. With further progression past this inflection point, liver enrichment becomes dominant (below the line of identity, yellow background in Fig. 2C), with ever-increasing liver enrichment in conjunction with decreasing cardiac enrichment. This trend terminated at AAV9, which contains one of the highest liver enrichments in the library, paired with comparatively low cardiac enrichment.
We then classified each vector according to its relative preference for heart or liver (blue and yellow backgrounds, respectively; Fig. 2C), followed by a calculation of the amino-acid frequency at each substitution position for each class: “heart” versus “liver” (Fig. 2D–H). For residue Y446, the most frequent amino-acid substitutions observed for liver- or heart-enriched vectors were the alternative aromatic amino acids phenylalanine and histidine, although no striking class-specific preferences were detected (Fig. 2D–F). A wide range of potential alternative amino acids was observed for residue N470, with no strong preferences detected between heart- or liver-enriched vectors (Fig. 2E–G). In contrast, residue W503 exhibited a highly constrained set of amino-acid substitutions that almost exclusively comprised WT tryptophan or the alternative aromatic histidine (Fig. 2E, F, H). Moreover, heart-enriched vectors exhibited a strong (∼50%) preference for histidine, the strongest alternative preference associated with the altered biodistribution profile. This amino-acid class preference is consistent with proteome-level findings that indicate a general preference for aromatic amino acids as binding partners for glycans. 39 –41 In summary, our first-round library screen identified the W503H alternative aromatic amino-acid preference, in addition to several variants with potential as liver-detargeted gene therapy vectors.
Second-round galactose-binding pocket library in mice identifies liver-detargeted, cardiac-enriched XRH variants
Moving from the first-round to the second-round library, we relaxed our yield score cutoff, allowing the top 275 hits from the first-round library in mice to advance to a more targeted second-round library. Each variant in the library was encoded by up to three synonymous codons (limited by codon redundancy for a small minority of vectors), and W503A was included as a negative control. We intravenously administered the second-round library to C57Bl6/J mice (n = 5) at a dose of 1 × 10¹² GC/mouse; animals were euthanized on Day 14, and tissues were harvested upon necropsy for RNA extraction and next-generation sequencing analysis. As expected, the second-round library recapitulated the parabolic curve observed in Fig. 2C (see Fig. 3A). We were further able to identify a distinct XRH motif (Y446X, N470R, W503H) at the curve’s inflection point. This XRH motif conforms to the W503H alternative aromatic motif preferred by cardiac vectors in the first-round library screen (Fig. 2E), further implicating modification of galactose binding in the altered biodistribution properties of these novel vectors. N470R was not a motif that would have been predicted based on the amino-acid representation in Fig. 2E, thereby illustrating the increased resolving power of our pared-down second-round library.
Because of their high enrichments in the heart, gastrocnemius, and brain in parallel with their observed liver detargeting (Fig. 3A, Supplementary Fig. S1), three XRH vectors were selected for individual analysis in a dose–response study. SRH, VRH, and HRH carrying an eGFP transgene were produced and administered via intravenous injection to mice at doses of 5 × 10¹³, 1 × 10¹³, and 5 × 10¹² GC/kg. Mice were euthanized and necropsied on day 14, and heart and liver tissue samples were collected for DNA biodistribution and RNA expression analysis. While all the XRH vectors exhibited some degree of liver detargeting, HRH exhibited the lowest levels of liver transduction, 3.8–5.8× below that of AAV9 at the DNA level via qPCR for vector genomes and 2–6× below that of AAV9 at the RNA level via qPCR for eGFP expression (Fig. 3B–D). In the heart, HRH displayed similar levels of DNA biodistribution, but enhanced levels of transgene expression, exhibiting up to a 10.2× increase in eGFP RNA at the lowest dose (Fig. 3E–G).
While the observed liver detargeting was evident at both the DNA and RNA level, the performance advantage of the XRH vectors in peripheral tissue seemed to be primarily driven by enhanced transcription compared with AAV9, not enhanced biodistribution. This is evidenced by GC levels similar to those of AAV9 in the heart, but higher levels of RNA expression (Fig. 3E, F). Analysis of RNA/DNA ratios illustrates the differential expression efficiencies between different organs and doses (Supplementary Fig. S2). In the heart, the XRH vector RNA/DNA ratios were equivalent to that of AAV9 at 5 × 10¹³ GC/kg but were exaggerated at the lowest dose, with up to a 14× expression advantage observed at 5 × 10¹² GC/kg. In contrast, this trend was not readily apparent in the liver. In summary, the second-round library recapitulated the curve of the first-round library and enabled the identification of a cluster of liver-detargeted variants with enhanced peripheral transduction. This liver detargeting occurred at both the DNA and RNA level, whereas the transduction enhancement manifested as an advantage in RNA expression only in the target (heart) tissue.
Second-round library screen in NHP reveals species-specific differences in liver transduction
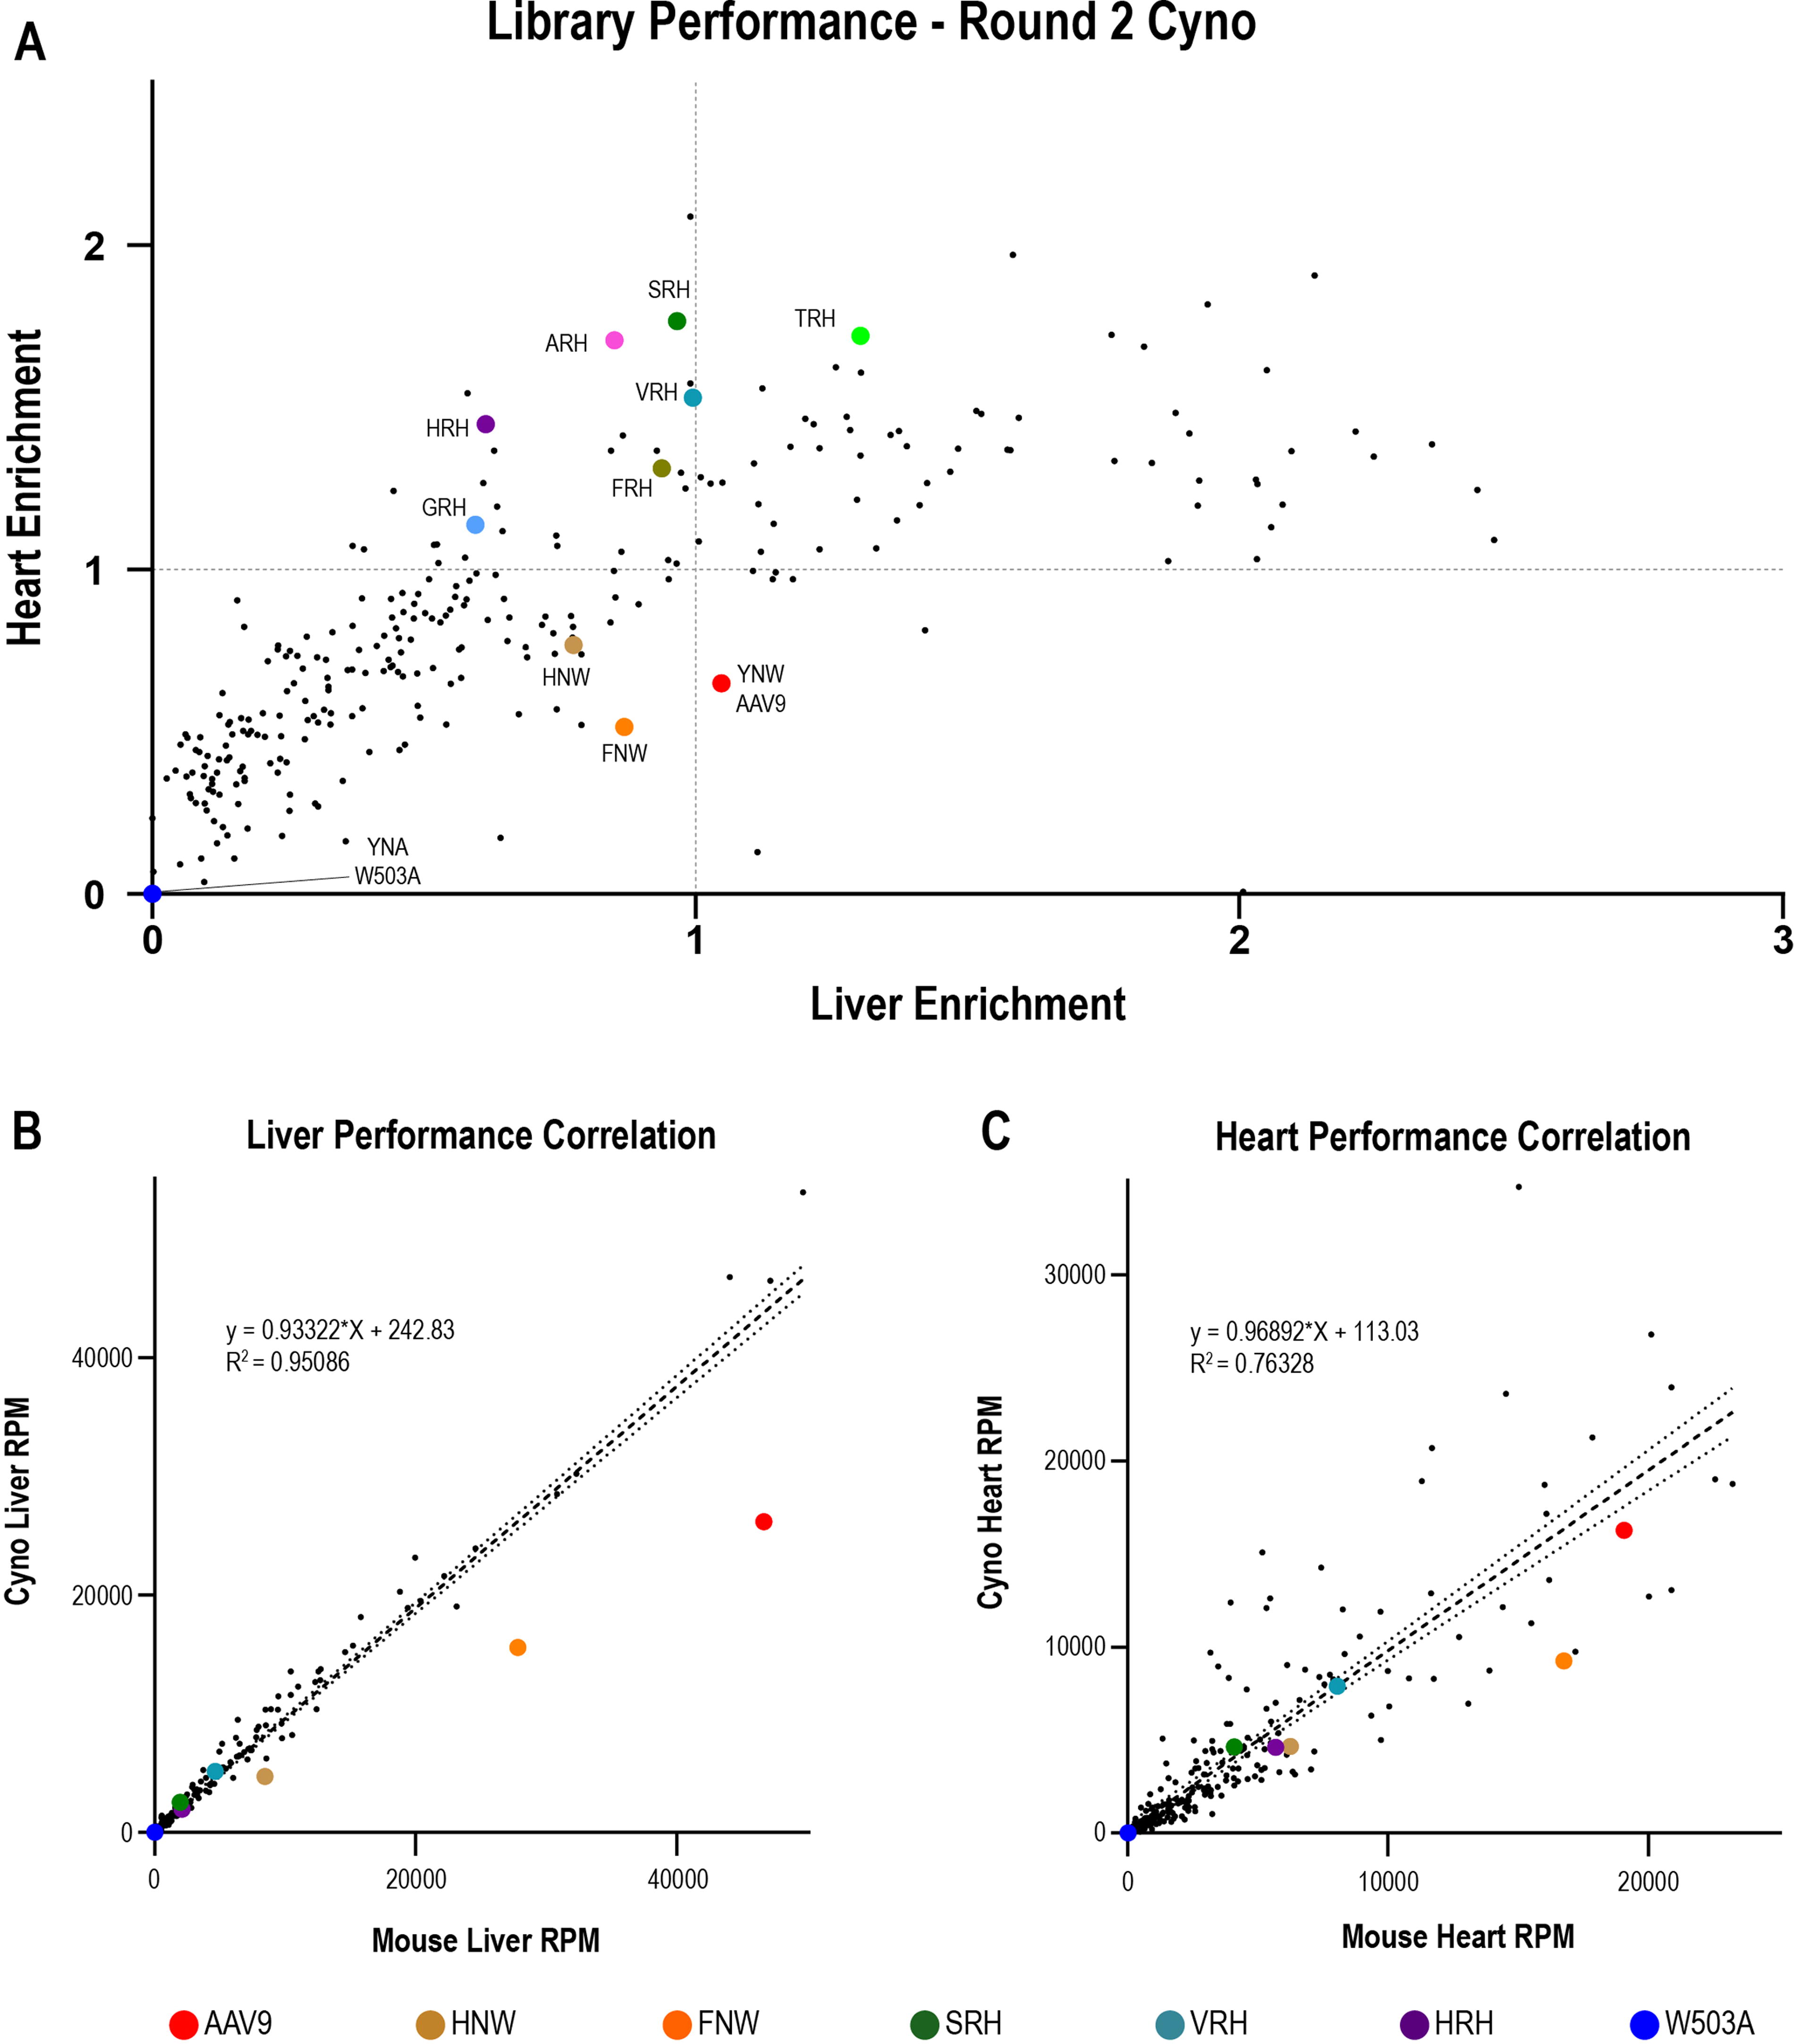
We intravenously administered the second-round library to a single cynomolgus macaque (n = 1) at a dose of 5 × 10¹³ GC/kg to determine whether its biodistribution properties translated to a more translationally relevant model organism. The animal was euthanized on day 14, tissues harvested via necropsy, and samples/data processed as for the mice. In the NHP heart/liver enrichment data (Fig. 4A), the parabolic transduction curve between the heart and liver observed in mice was not present. While all variants in the library shifted their position to some extent, the AAV9 position relative to the rest of the library shifted to a greater degree between the NHP and mouse liver than any other vector in the library (compare Figs. 3A and 4A). AAV9 (YNW) and two closely related vectors (HNW and FNW) exhibited the largest reduction in the NHP liver compared with the mouse liver. This difference became particularly apparent when the reads per million (RPM) were plotted for each library variant in the mouse versus NHP liver, with the three most negative residuals compared with the line of best fit being AAV9, FNW, and HNW (Fig. 4B, Supplementary Fig. S3A). HNW and FNW both differ from the WT through the substitution of an alternative aromatic amino acid, suggesting similar glycan-binding capacities for HNW and FNW in comparison with AAV9. We did not observe this type of divergence between the mouse and NHP heart (Fig. 4C, Supplementary Fig. S3B). In summary, these data identify a group of closely related vectors (AAV9-YNW, HNW, and FNW) with unexpectedly altered performance between the mouse and NHP liver. Because these closely related vectors simply swap out aromatic amino acids and aromatic amino acids are commonly involved in glycan binding, 40 we hypothesized that these differences in performance may be influenced by galactose binding.
Second-round library screening in NHP uncovers species- and tissue-specific differences in vector performance.
AAV9 and its closely related variants bind strongly to galactose, whereas XRH vectors do not
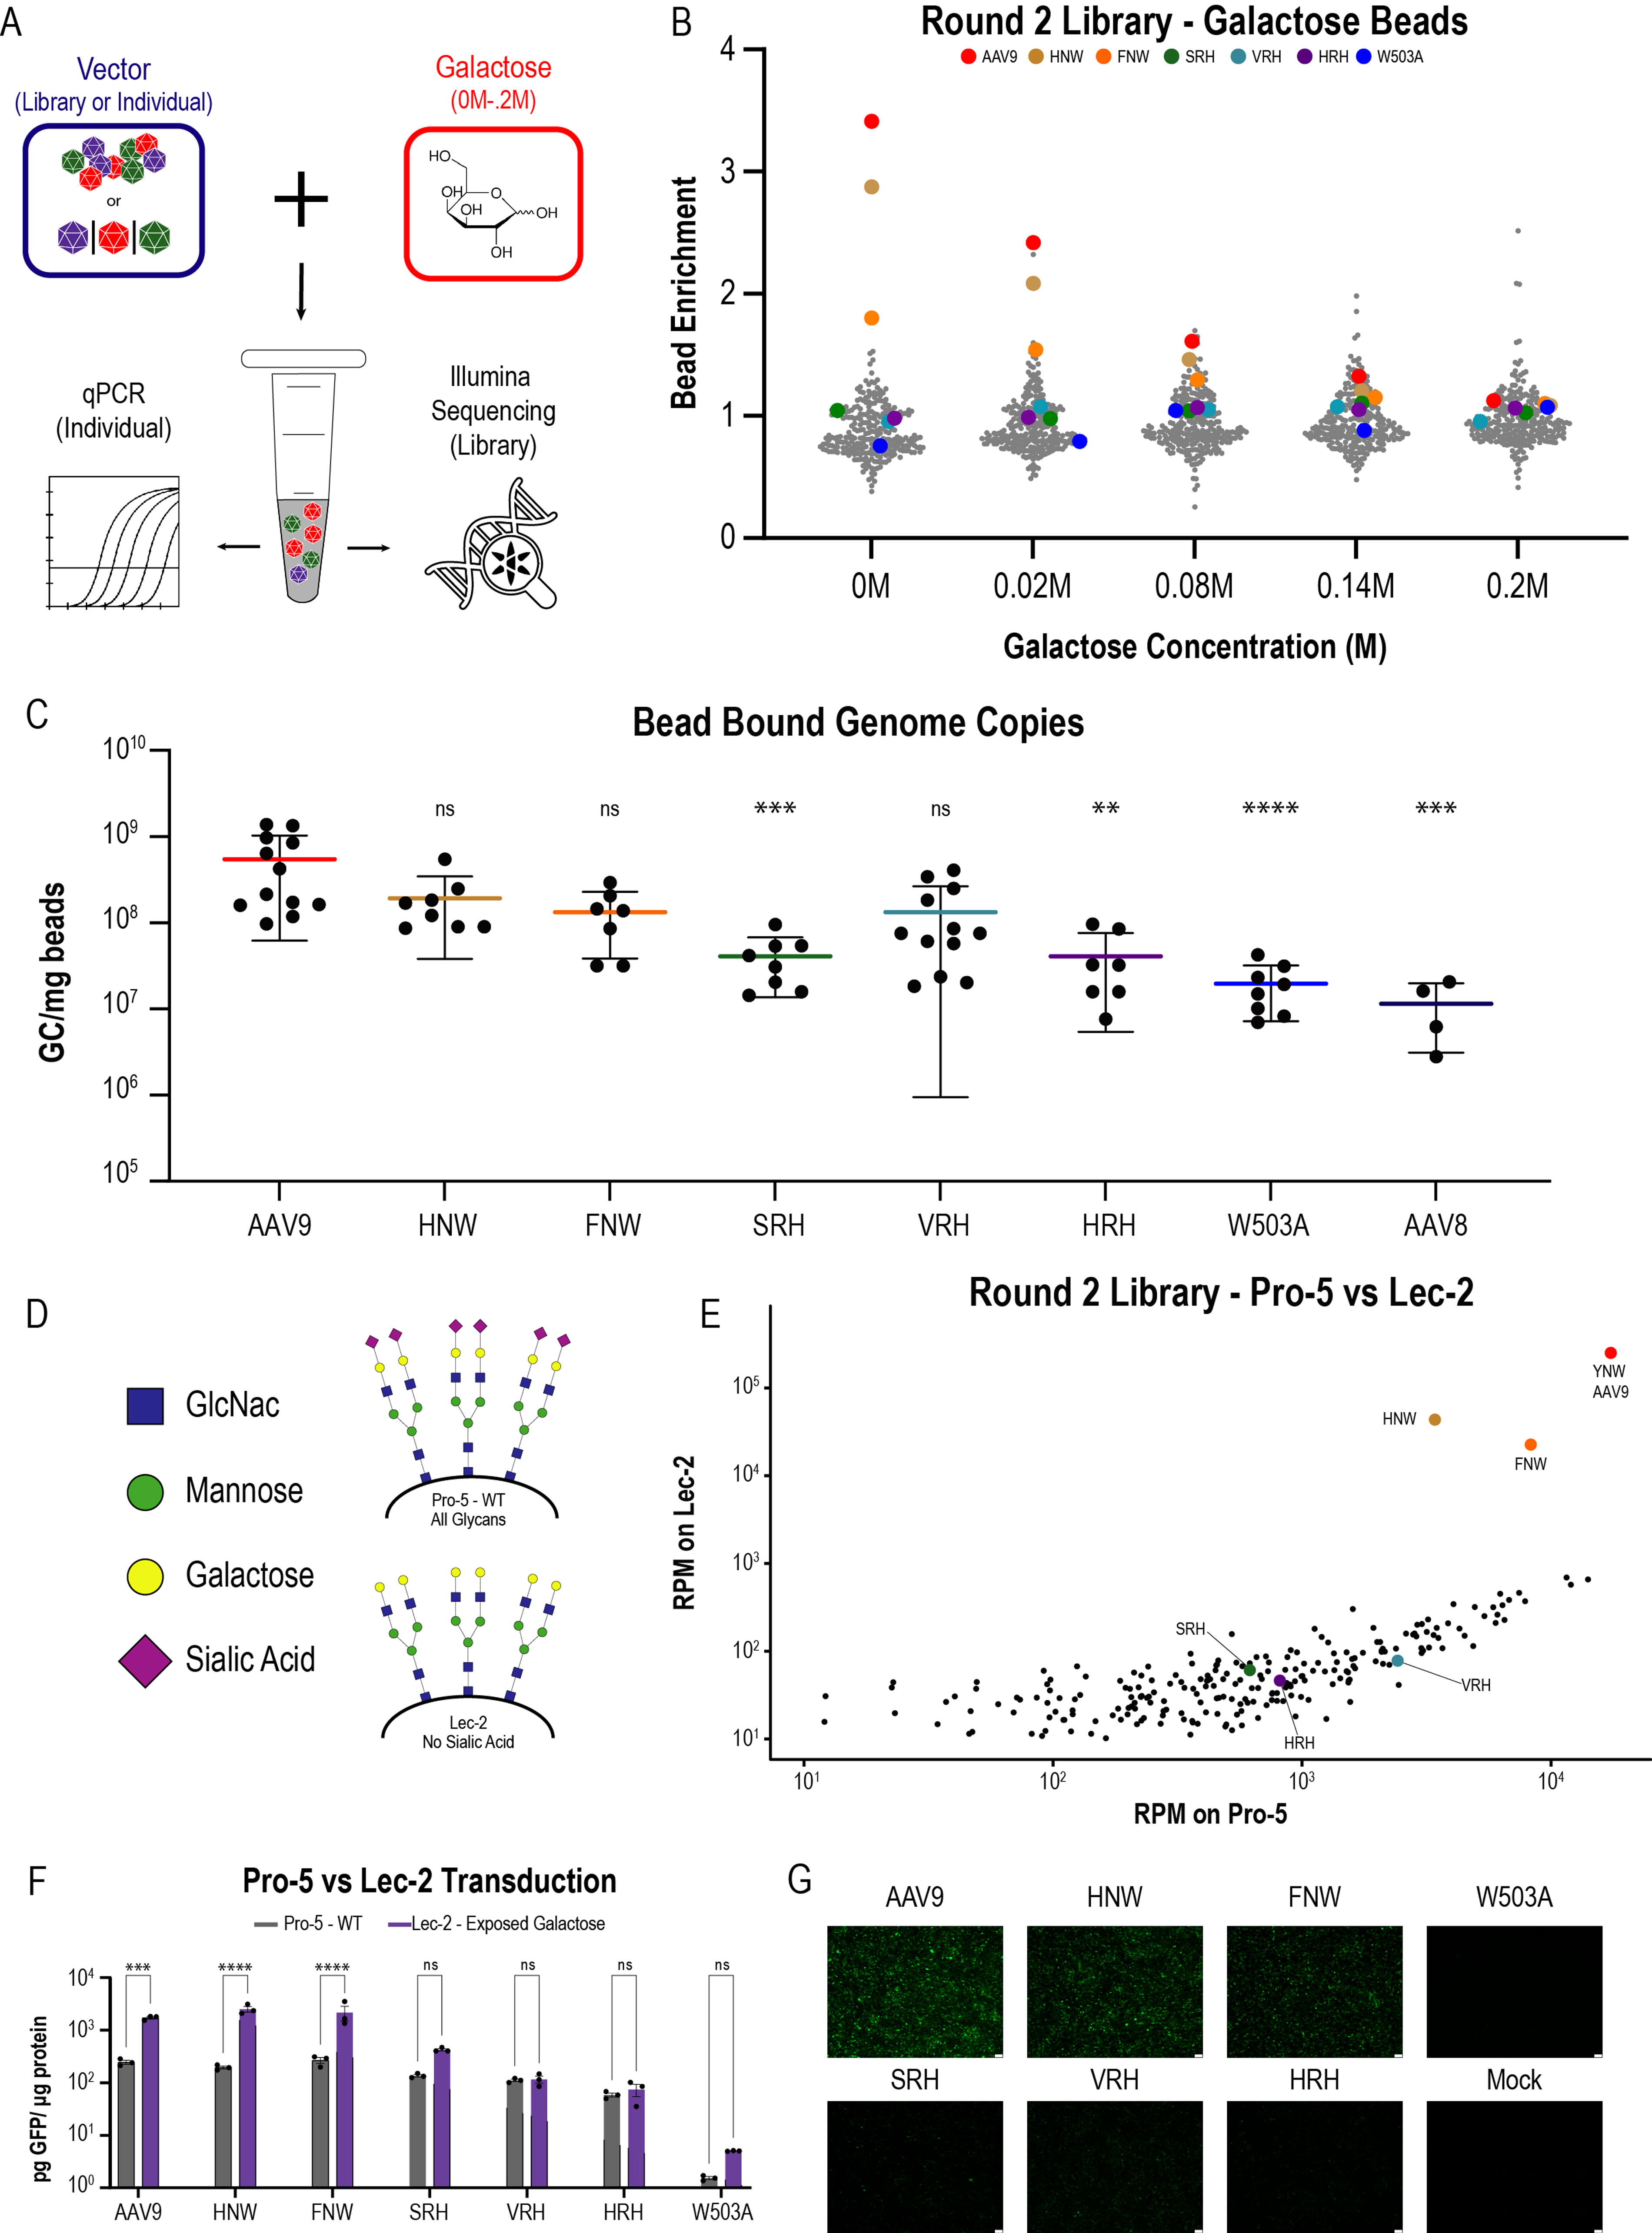
To test the proposed hypothesis, we first moved to characterize the galactose-binding properties of the entire second-round library on galactose-immobilized beads. We incubated the second-round library with BSA-blocked, galactose-immobilized agarose beads in the presence of increasing concentrations of free galactose (n = 5/galactose concentration). After incubation, tubes were slit with a scalpel and spun to remove supernatant and any vector not bound to the beads. We then resuspended the dry beads in PBS before processing for next-generation Illumina sequencing (Fig. 5A). Enrichment score analysis (Fig. 5B) indicated that AAV9, HNW, and FNW were the three most highly enriched vectors on galactose beads at 0 M galactose (enrichments of 1.8–3.4, compared with a library mean enrichment of 0.87). As the galactose concentration increased, however, this enrichment relative to the rest of the library decreased, leveling out at an enrichment score of ∼1.1 at a free galactose concentration of 0.2 M. This pattern indicated that in the absence of free galactose, AAV9, HNW, and FNW were retained at higher levels on the galactose bead resin than would be expected based on their initial abundance, whereas this advantage was abrogated at high galactose concentrations. Replication of the above experiment with individual vectors followed by a qPCR readout for vector genomes showed that AAV9, HNW, and FNW had the highest binding (1–5 × 10⁸ bound GC/mg galactose beads), whereas SRH and HRH exhibited similar binding activities of approximately 4 × 10⁷ GC/mg beads. Compared with the background binding of 1–2 × 10⁷ GC/mg beads for W503A and AAV8, SRH and HRH displayed surprisingly low levels of galactose binding (Fig. 5C). Given the propensity of the XRH vectors for peripheral transduction (Fig. 3, Supplementary Fig. S1), this finding implies that galactose binding may not be necessary for transduction of all tissue types.
Measurements of galactose-binding capacity for library and individual vectors of interest indicate different classes of galactose-binding strength.
To evaluate how galactose binding may affect vector transduction in vitro, we transduced Pro-5 and Lec-2 cells with all individual vectors of interest in addition to the second-round vector library. In the library context, AAV9, FNW, and HNW clearly differentiated themselves as exhibiting enhanced transduction on Lec-2 (high galactose) cells compared with Pro-5 (WT) (Fig. 5D, E). This difference was also borne out in the individual context, where GFP expression was assessed via fluorescence microscopy and GFP ELISA on day 3 post transduction (Fig. 5F–G). We observed significant increases in GFP expression for AAV9, HNW, and FNW on Lec-2 (high galactose) cells in comparison with Pro-5 (WT) cells (Fig. 5F, 7×, 13×, and 8×, respectively), allowing us to classify these vectors as the strongest group of galactose binders. In contrast, the XRH vectors exhibited virtually no change (3× SRH, 1× VRH, and 1× HRH). Despite this lack of galactose-mediated transduction enhancement, the XRH vectors still achieved better performance than W503A on all CHO-Lec lines, regardless of galactose presentation (Supplementary Fig. S4).
Differential cross-species library performance linked to galactose binding predicts species-specific differences in galactose presentation
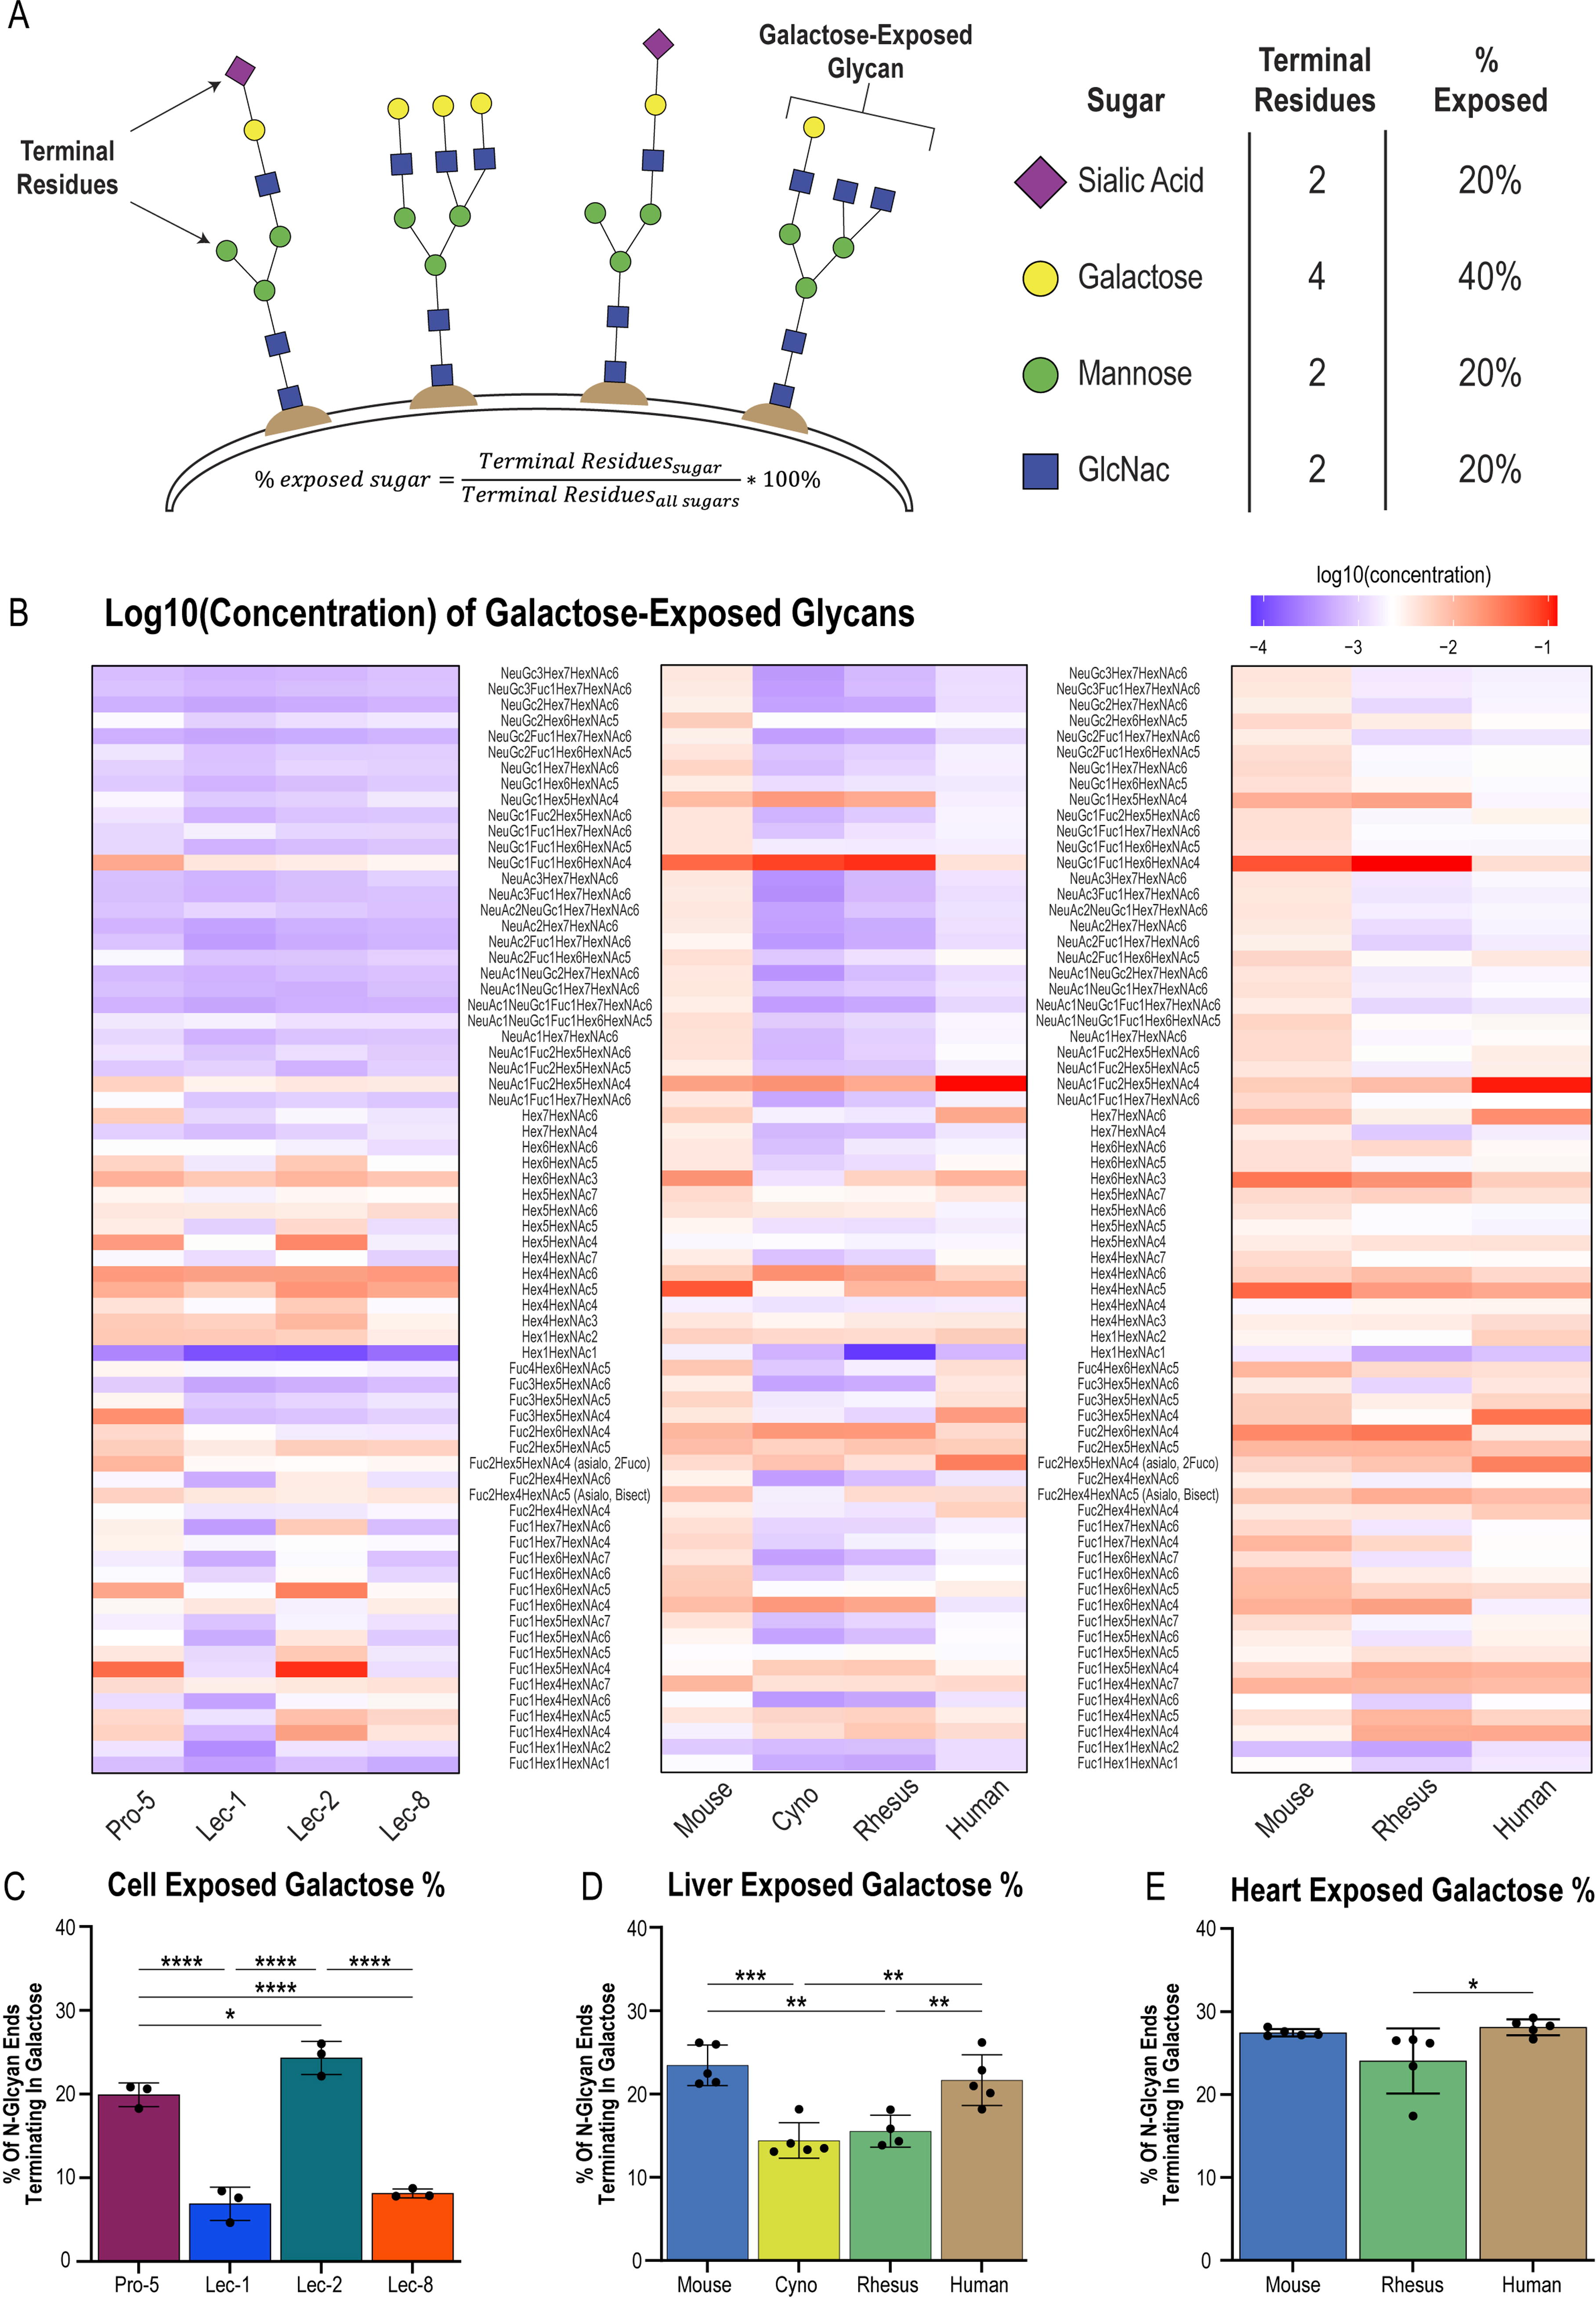
As the data suggest that AAV9, HNW, and FNW exist as a distinct high-galactose–binding class of vectors within the library, we hypothesized that differential galactose presentation may contribute to the species-specific performance differences observed for these vectors between the mouse and NHP liver (Fig. 4A, B). Thus, we conducted detailed mass spectrometry analysis of the N-glycan profiles of various tissues to search for the predicted differences. Using a clinically validated mass spectrometry protocol, 26 we semiquantitatively detected ∼180 N-glycans in a range of species and tissue types. Stoichiometric analysis of each N-glycan allowed for a calculation of sample normalized concentrations for each glycan, in addition to the number of terminal galactose residues as a proportion of total terminal glycan ends. We used these data to calculate an estimate of exposed galactose avidity for each tissue type (Fig. 6A).
Glycan profiling uncovers fundamental differences in galactose presentation between different species and tissue types.
In Fig. 6B, heatmaps are shown depicting the log10 of the concentrations of all galactose-terminating glycans detected in our samples, with a color scale set at the median of the dataset. We first used the CHO-Lec lines to validate our assay, in which we detected greater concentrations of galactose-terminating glycans in Pro-5 and Lec-2 cells compared with Lec-1 and Lec-8 cells (Fig. 6B, left panel). This result was expected because Lec-1 and Lec-8 contain mutations that preclude the addition of galactose to growing glycan chains. We further detected a 4.4% increase (p = 0.038) in the percentage of exposed galactose residues on Lec-2 (high galactose) cells compared with Pro-5 (WT) cells (Fig. 6C). Extending this mass spectrometry analysis to mouse, NHP, and human liver samples, we saw numerous reductions in galactose-terminating glycans in the NHP liver compared with the mouse liver (Fig. 6B, middle panel), translating to a 9.0% and 7.9% (p = 0.0002 and p = 0.0011) decrease in exposed galactose between mice and cynomolgus or rhesus macaques, respectively (Fig. 6D). In contrast, the mouse and human liver exhibited similar levels (p = 0.663) of exposed galactose (Fig. 6D). Analysis of the heart indicated no difference in mouse versus NHP galactose avidity, although a 4.1% (p = 0.043) reduction in galactose presentation was detected for the NHP versus human heart (Fig. 6E). Thus, the galactose-bead–binding capacity of the library correlated strongly with in vitro transduction levels and predicted species-specific differences in liver galactose avidity. These differences may explain, in part, the differential transduction patterns observed between the mouse and NHP for AAV9, HNW, and FNW.
DISCUSSION
In this study, we measured galactose binding for AAV9 and a set of its derivative vectors in addition to evaluating their in vitro and in vivo activity across a range of translationally relevant conditions. Over the course of our investigation, we identified the XRH family of liver-detargeted AAV vectors with reduced galactose binding and enhanced peripheral transduction. We also identified a group of AAV9-like vectors with notably strong galactose binding. The galactose-binding properties of these distinct vector classes yielded evidence suggesting species-specific differences in tissue-level galactose avidity that may influence transduction and/or biodistribution. We then confirmed this difference using a clinically validated glycomics assay.
Previous attempts at engineering liver-detargeted AAV vectors yielded vectors that also exhibited reduced levels of peripheral transduction. 42 –44 In contrast, the XRH vectors represent a group of liver-detargeted vectors that instead display enhanced peripheral transduction. These vectors hold the potential to enable therapeutically relevant transgene expression levels in peripheral tissues at a significantly reduced dose. Our top-performing vector, HRH, achieved a cardiac transduction at 5 × 10¹² GC/kg identical to that of AAV9 at 1 × 10¹³ GC/kg, with a 2-fold decrease in vector genomes in the liver. The XRH vectors also produce at levels similar to that of the parental AAV9 (Supplementary Fig. S5), showing no obvious production deficiency signals from small-scale vector preparations. Because of their liver detargeting, high levels of peripheral transduction, and potential manufacturability, the XRH variants represent promising next-generation vectors for gene therapy targeting extrahepatic peripheral tissues. Future gene therapies leveraging these vectors may be able to effectively target extrahepatic tissues at lower doses and with fewer off-target effects.
Surprisingly, direct measurement of the galactose-binding strength of HRH indicated that its galactose-binding capacity was severely reduced, with its galactose binding closer to that of W503A than to that of AAV9 (Fig. 5C). Thus, it appears that galactose binding is necessary for high levels of liver transduction; however, the importance of galactose binding for enacting meaningful transduction in peripheral tissues is reduced. One potential cause for this difference is accessibility, in which galactose residues on liver hepatocytes are more easily accessible than those on cardiomyocytes because of the fenestrations in liver sinusoidal endothelium. 45 In the context of an easily accessible cell surface, the influence of receptor interactions may have a magnified importance in determining the efficiency of liver transduction. Martino et al. 29 established the concept of affinity thresholds governing AAV–receptor interactions, in which an increased receptor affinity correlates with increased transduction up to a threshold. Beyond this threshold, the vector binds too tightly to its receptor and is unable to be released to begin a productive infection. 29 A similar mechanism may be at play here, in which the XRH vectors are liver detargeted by reduced binding to easily accessible hepatocyte galactose, increasing either the amount of vector in circulation or the duration of exposure to peripheral organs or both. In this situation, residual binding to galactose or alternative, yet-to-be-described receptor interactions may replace hepatocyte galactose binding as the dominant affinity interaction necessary to transduce peripheral tissues.
Nevertheless, the general galactose-binding deficiencies observed for most variants in the second-round library provided an informative backdrop against which to detect conditions in which successful transduction of AAV9, HNW, and FNW was mediated by high galactose-binding capacity. Because AAV9, HNW, and FNW constitute a unique subgroup of galactose binders, their substantial difference between the mouse and NHP liver allowed us to hypothesize underlying differences in accessible galactose concentrations between these two conditions. This hypothesis was supported by the results of our N-glycan profiling experiment.
This AAV-library/glycan profile dataset builds upon a body of work, particularly out of the Asokan Laboratory, on the AAV9–galactose interaction and its impact on in vivo biodistribution. 21 While Shen et al. 21 demonstrated an enhanced liver biodistribution by increasing in vivo galactose avidity via sialidase treatment in a mouse model, our approach yields the converse observation: decreased galactose avidity between the mouse and NHP liver led to a decreased relative transduction for our high galactose-binding variants AAV9, HNW, and FNW. These results are compatible and suggest that this work and Shen’s study 21 are operating on opposite ends of a spectrum of galactose avidity, with somewhat predictable effects on in vivo biodistribution profiles. This finding also lends weight to the extrapolatory nature of our comparative glycomics analysis. Because human liver samples displayed greater similarities in galactose avidity to mouse than NHP, our analysis suggests that AAV9-mediated liver transduction may be higher in humans than in NHPs. Because of the potential ramifications these findings may have for the translatability and safety of AAV9-based gene therapy, this line of inquiry warrants further investigation.
While this study focused on the interaction between AAV9, its variants, and galactose, a related variable warrants specific consideration. Although we designed our library to affect the galactose-binding pocket of AAV9, this binding pocket overlaps the binding pocket of another essential receptor for AAV9 transduction, that of AAVR. 46,47 Specifically, W503 is involved in the binding of both galactose and AAVR, 43,47 a residue that was altered via the W503H substitution in all XRH vectors. Although we do not yet understand whether/how the W503H mutation may affect AAVR interactions, it is likely that altered interactions with AAVR make independent contributions to the observed biodistribution profiles of variants in this library. This case illustrates the inherent difficulty of directed evolution screening approaches, in which a library selection scheme designed to target one set of interactions can manifest multicausal outcomes that are difficult to mechanistically deconvolute.
One example of these potential multicausal outcomes is the difference between peripheral transduction advantages and liver detargeting. Whereas we observed liver detargeting manifest as a reduced overall load of vector genomes in the liver with concomitant reductions in transgene mRNA levels, cardiac transduction enhancement was defined by an increase in mRNA expression without an increase in DNA biodistribution. This phenomenon is encapsulated in the RNA/DNA ratios presented in Supplementary Fig. S2, with the highest RNA/DNA ratios being detected at low doses in the heart. It is important to note, however, that our DNA values do not distinguish between vector genomes that are present in an uncoated, nuclear form versus encapsidated genomes from tissue-resident vectors that failed to transduce the target tissue, especially at the short 14-day time point. Thus, the RNA/DNA ratios should be interpreted with caution and in the context of other supporting evidence.
Evidence for vector-mediated expression advantages is not unprecedented within the field. 48 –53 In a library screening study by Tabebordar et al., 48 no correlation between the vector DNA RPM and vector mRNA RPM was found in a range of examined tissues. This result is consistent with our data showing that capsids selected for superiority based on RNA expression seem to have an advantage in peripheral expression, not vector localization. More recently, Loeb et al. demonstrated that the VP1 domain of AAV8 recruits transcription-promoting host factors to vector genomes in mouse and human cells, leading to increased chromatin accessibility along with histone methylation patterns. 53 Other studies have shown capsid-mediated transcriptional phenotypes linked to numerous sites on the AAV capsid, 49 –52 demonstrating the multifaceted functionality of the capsid on transgene transcription. Our RNA/DNA ratio data fit well within this body of work, and future experiments examining the interaction of XRH capsids with intracellular expression machinery may yield further insights into this phenomenon.
All of these observations were possible because the field of capsid engineering has converged on mRNA-based library-screening methodologies in its quest for enhanced AAV capsids. 5,7,48,49 While it is perhaps unsurprising that exerting evolutionary pressure based on measured quantities of transgene mRNA would yield vectors that exhibit stronger RNA expression, the repeated finding of capsid-specific enhancements in RNA expression as opposed to total vector GC may be informative. Understanding the mechanistic responses to the constraints imposed by directed evolution may offer clues as to the underlying inefficiencies that must be overcome in the creation of the next generation of gene therapy vectors.
Fortunately, the capsid engineering toolbox is equipped to further study these mechanisms. Our study has demonstrated the power of this toolbox by expanding the range of conditions through which AAV libraries can be screened. In doing so, we identified promising new capsids and uncovered fundamental properties about tissues and organisms commonly used in the field. As more AAV libraries are generated for the purpose of vector identification, it is important to appreciate that the field is also creating tools that can be used to gain useful mechanistic insights into basic AAV biology. These tools may be the key to fully unlocking the potential of AAVs as vectors for gene transfer.
Footnotes
ACKNOWLEDGMENTS
The authors thank Miao He and Idris J. Wazeerud-din for their mass spectrometry expertise; Jenny Greig, Marcela Salazar Werner, and R. Jason Lamontagne for RT-qPCR assistance; Peter Bell, Tianying Jiang, and the Histopathology Core for technical support; and the Capsid Engineering Team for insightful discussions. The authors also thank the Biostatistics and Bioinformatics Core, Immunology Core, Nucleic Acid Technologies Core, Program for Comparative Medicine, and Vector Core of the Gene Therapy Program at the University of Pennsylvania for study support. All vectors were produced by the Penn Vector Core (RRID: SCR_022432). The authors also thank thenounproject.com, particularly Creative Stall, Saifurrijal, Catherine Please, Julie Ko, and parkjisun, for their contributions to our figure schematics. The authors also thank Sigma-Aldrich for their D-galactose image. Data analysis code in R was written with help from OpenAI and Chat-GPT 4.0. We utilized Chat-GPT as a starting point, describing data structure and calculation/visualization goals. The output code was then modified to fit our specific data. We manually validated individual calculations to ensure accuracy of the code.
Data availability statement
All data discussed in the article are available in the main text or supplemental materials. Complete clinical pathology data for our NHP study can be obtained upon request.
AUTHORS’ CONTRIBUTIONS
J.A.H.: Conceptualization, data curation, formal analysis, funding acquisition, investigation, methodology, project administration, resources, software, supervision, validation, visualization, writing—original, draft preparation, and writing—reviewing editing. N.D.: Conceptualization, visualization, writing—original, draft preparation, and writing—reviewing and editing. J.J.S.: Conceptualization, methodology, supervision, and writing—reviewing and editing. R.M.: Methodology, software, validation, and writing—reviewing and editing. Z.Z.: Methodology, software, and validation. K.O.: Formal analysis. J.M.W.: Funding acquisition, supervision, and writing—reviewing and editing.
AUTHOR DISCLOSURE
J.M.W. is a paid advisor to and holds equity in iECURE, Passage Bio, and the Center for Breakthrough Medicines (CBM). He also holds equity in the former G2 Bio asset companies and Ceva Santé Animale. He has sponsored research agreements with Amicus Therapeutics, CBM, Ceva Santé Animale, Elaaj Bio, FA212, Foundation for Angelman Syndrome Therapeutics, former G2 Bio asset companies, iECURE, and Passage Bio, which are licensees of Penn technology. J.M.W. and J.J.S. are inventors on patents that have been licensed to various biopharmaceutical companies and for which they may receive payments.
FUNDING INFORMATION
This work was supported by
SUPPLEMENTARY MATERIAL
Supplementary Figure S1
Supplementary Figure S2
Supplementary Figure S3
Supplementary Figure S4
Supplementary Figure S5
Supplementary Table S1
References
Supplementary Material
Please find the following supplemental material available below.
For Open Access articles published under a Creative Commons License, all supplemental material carries the same license as the article it is associated with.
For non-Open Access articles published, all supplemental material carries a non-exclusive license, and permission requests for re-use of supplemental material or any part of supplemental material shall be sent directly to the copyright owner as specified in the copyright notice associated with the article.