
Abstract
The underlying risk of retroviral vector-induced insertional oncogenesis in gene therapies requires a reliable preclinical safety assessment. Dysregulation of genes neighboring the vector’s integration sites has triggered hematopoietic malignancies in patients treated with different vector genera and designs. With ca. 18 years in practical use, the in vitro immortalization (IVIM) assay can quantify this mutagenic potential and is actively requested by regulatory authorities during preclinical stages. Here, we present a thorough meta-analysis of IVIM data alongside a step-by-step cell culture protocol. On this basis, we propose clonal outgrowth as the single indicator of mutagenicity, simplifying the IVIM assay cost- and time-wise.
INTRODUCTION
Over the last decades, retroviral vectors have demonstrated clear clinical benefits for the correction of severe genetic diseases such as immunodeficiencies, hemoglobinopathies, or inborn errors of metabolism. 1 However, these vectors can also disrupt the normal cellular gene expression programs and increase cancer risk by stably integrating into the genome. Severe adverse events have been reported using both gamma- and the safety-improved self-inactivating lentiviral vectors (SIN-LVs). 2 –9 Intensive research combined with the experience acquired in the field revealed that the main determinants of insertional oncogenesis are the vector class (gamma-retro-, lenti-, or alpha-retroviral-vector), followed by the internal promoter of choice in SIN-LV configurations. 10 –12 Synergistic effects between these aspects and the specific transgene have also been shown to play a role in mutagenicity. 3 Although this knowledge has led to significant improvements in vector designs, which were crucial for the field’s progress, there is still an unmet need for sensitive and reliable preclinical genotoxicity assays.
We previously developed the in vitro immortalization (IVIM) assay to quantify the mutagenic risk of retroviral vectors for gene therapy. The IVIM assay is based on an initial observation by Du and colleagues that insertional mutagenesis can induce immortalization of primary murine bone marrow (BM) progenitor cells in vitro. 13 Since IVIM’s first description in 2006 by Modlich and colleagues, 14 it has been widely used by researchers and companies as part of their preclinical safety package for over 15 years. The assay involves transducing murine BM cells with retroviral vector constructs, expanding them, and analyzing their proliferation capacity after low-density seeding on 96-well plates. Transformed cells are expected to proliferate under these conditions and show a replating phenotype with outgrowing clones, while nontransformed cells usually cannot. The final score for the vector’s genotoxic potential, the replating frequency (RF), combines a microscope scoring of outgrowing clones and an MTT assay detecting metabolically active cells. While the microscopic scoring identifies the most evident sign of immortalization, setting the positivity threshold for the MTT assay has proven challenging, particularly when mock samples display background proliferation.
After analyzing 15 years of data, we have concluded that the microscopic scoring is reliable enough as a readout for genotoxicity, making the MTT assay unnecessary. This simplification reduces costs and assay times and improves the reliability and clarity of our results. Here, we present a comprehensive meta-analysis of IVIM assays and describe the current cutoff strategy for genotoxicity assessment. We also provide a detailed description of the critical steps and standard operating procedures used for the IVIM cell culture part, which are shared with the surrogate assay for genotoxicity assessment (SAGA), a more sensitive approach with a molecular readout using machine learning. 15 By refining the IVIM assay and sharing our expertise, we aim to support the safer translation of gene therapies to the clinics.
MATERIALS AND METHODS
Retroviral vectors
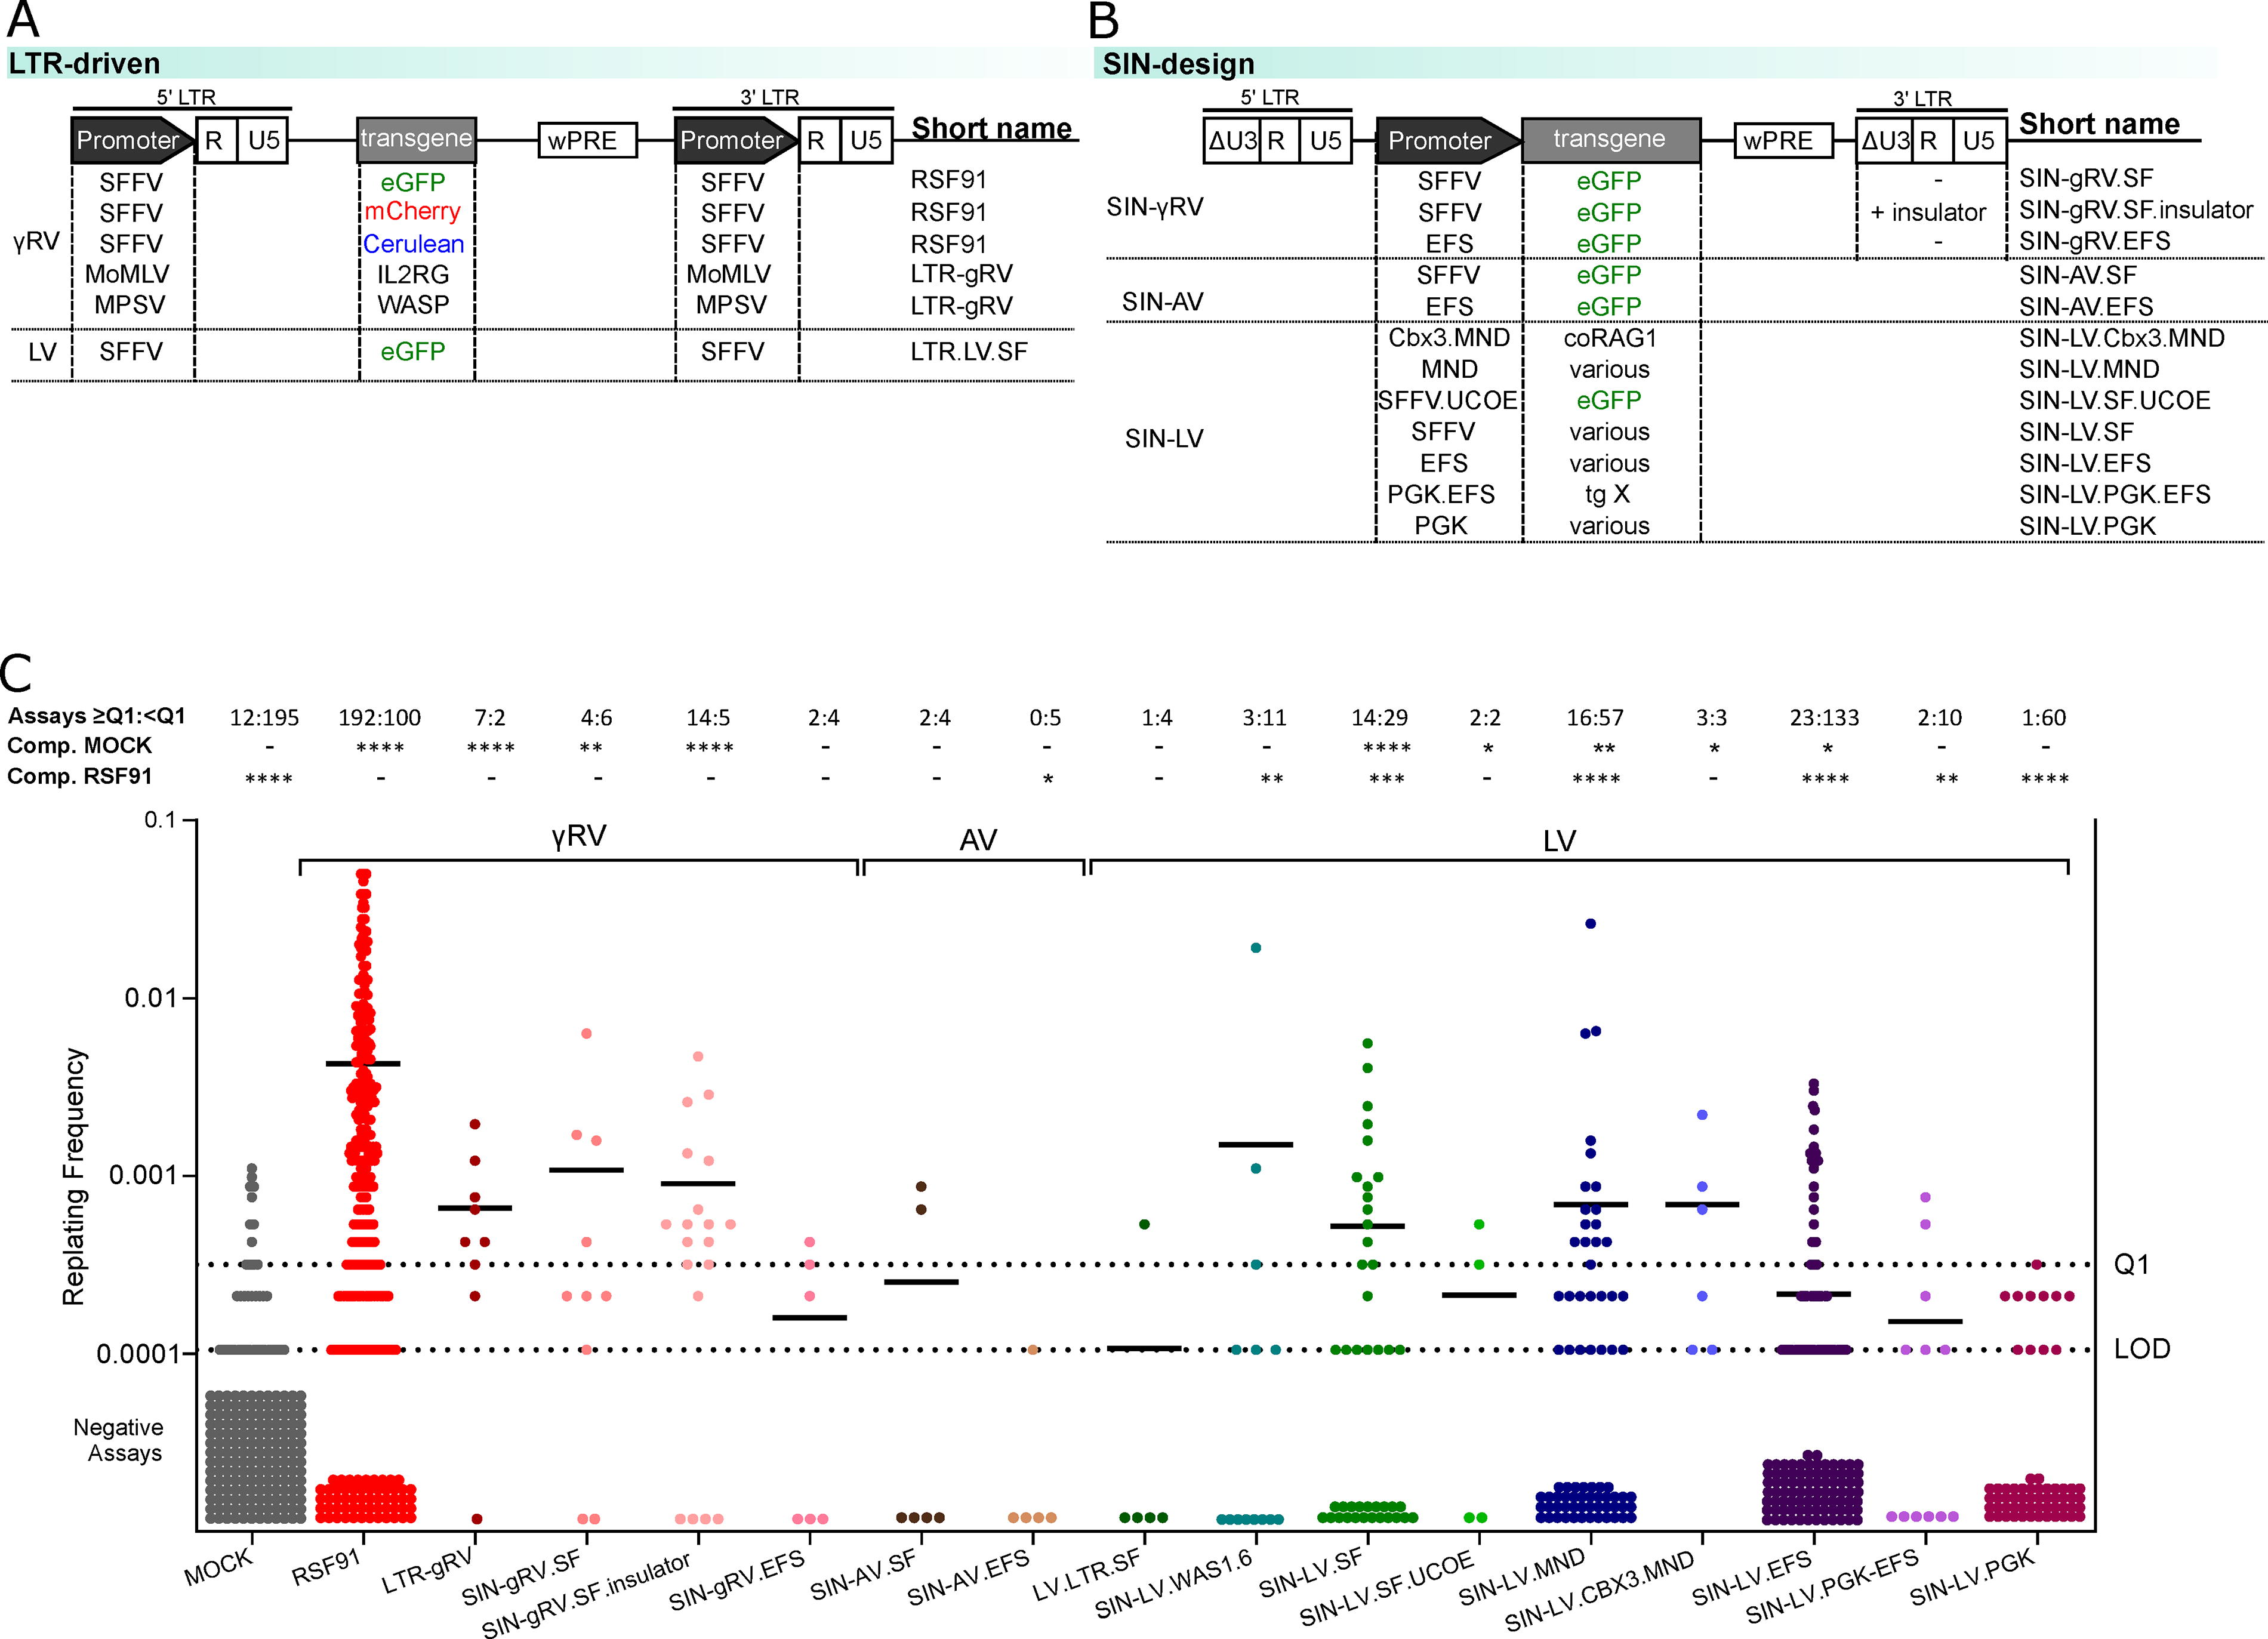
The long-terminal repeat (LTR)-driven gammaretroviral vector RSF91 16 –18 has been previously described. The vector carries eGFP, mCherry, or Cerulean as the reporter gene. It contains the spleen focus-forming virus (SFFV) U3 promoter in its LTR (GenBank accession no. AJ224005) and a modified woodchuck hepatitis virus post-transcriptional regulatory element (wPRE*). 19 SIN-LV.SF contains SFFV as an internal promoter driving eGFP expression. 20 Additional vector designs used in this study can be found in Fig. 2A, B. For those vectors under nondisclosure agreements, the specific transgenes are blinded throughout the figures.
In general, vector stocks were generated by transient transfection of HEK 293T cells with 5 µg of transfer vector, 12 µg of either pcDNA3.HIV-1.GP.4 × CTE (LV gag/pol) or pcDNA3.MLV.GP (gRV gag/pol), 20 5 µg of pRSV-Rev (only LV, provided by T. Hope, Northwestern University, Chicago, IL, USA), and 2 µg of pMD.G (VSVg envelope), 21 using the calcium phosphate precipitation method as described before. 18,22 Viral supernatants were concentrated by ultracentrifugation for 2 h at 82.740 g (4°C) and stored at −80°C until further use. Titration was generally performed on HT1080 cells as described before. 20,22 Briefly, after transduction with serial dilutions of the concentrated viral supernatant and spinoculation for 1 h at 700 g, the percentage of cells expressing the fluorescent reporter was determined 4 days later by flow cytometry and used to calculate the titer.
Murine lineage-negative cells
Bone marrow lineage-negative (lin-) cells were isolated from femurs, tibias, and iliac crests of 8- to 12-week-old female C57BL/6J mice (Janvier Labs, Saint Berthevin, France) and magnetically separated using the lineage cell depletion kit (Miltenyi Biotec, Bergisch Gladbach, Germany) containing lineage-specific antibodies. Two subsequent histopaque (Sigma-Aldrich) gradient centrifugations were performed before magnetic separation to enrich mononuclear cells. The isolated cells were cryopreserved in aliquots using 90% FBS and 10% DMSO and stored in liquid nitrogen.
Reagents
See Table 1.
Reagents needed for the cell culture part of the in vitro immortalization assay and surrogate assay for genotoxicity assessment
Reagent setup
See Table 2.
Preparation of reagents
Vector copy number determination by qPCR and droplet digital PCR
For mean vector copy number (VCN) determination, genomic DNA (gDNA) was isolated with the QIAamp DNA Blood Mini Kit (Qiagen, Hilden, Germany). VCN was determined on 50–100 ng of isolated gDNA with a TaqMan approach either on the StepOnePlus Real-Time PCR System (Thermo Fisher) or in the QX200 ddPCR system (Bio-Rad, Feldkirchen, Germany). The number of viral sequences was normalized to the genomic reference sequence of polypyrimidine tract binding protein 2 (Ptbp2). Primer pairs and probes for the wPRE element (viral vector detection) and for Ptbp2 (Table 3) were used in combination with either the TaqMan Fast Advanced Master Mix (Applied Biosystems, cat. no. 4444964) or the ddPCR supermix for probes—no dUTP (Bio-Rad, cat. no. 1863023). For the qPCR approach, the samples were run in triplicates, and standards with known concentrations were included for extrapolation of the target concentration and final VCN calculation. For the ddPCR approach, the amplified products were measured with the QX200 droplet reader, and the concentration of each target molecule per microliter and the resulting VCN values were determined with the QuantaSoft software (Bio-Rad). The threshold for droplet positivity was manually adjusted in each experiment following the manufacturer’s recommendations.
Primer pairs and probes for vector copy number determination
Statistical analyses and preparation of figures
All statistical analyses were performed using R version 4.2.1 on a 64-bit Linux server running Ubuntu 20.04.4 LTS. Data manipulation and visualization were conducted using the tidyverse packages.
For comparisons involving two categorical groups, Fisher’s exact test was performed, and the resulting p-values were adjusted for multiple testing using the Benjamini–Hochberg correction. In all other cases, unless indicated otherwise in the figure legends, the Mann–Whitney U test was used, also with the Benjamini–Hochberg correction for multiple testing. Statistical calculations were performed using the stats package.
Due to our data’s heavy right-tailed appearance, we used the nonparametric Mann–Whitney U test and Weibull distribution modeling, which provided a robust and accurate representation of the data. Weibull distribution estimates were obtained using the EnvStats package, using the maximum likelihood estimation method.
The specific statistical test used is indicated in each figure caption. Significance levels are denoted as follows: *p < 0.05, **p < 0.01, ***p < 0.001, ****p < 0.0001, and ns = not significant. Figures were designed using the Inkscape software (https://inkscape.org/) in conjunction with the ggplot2 package and GraphPad Prism 10.
RESULTS
Key cell culture steps in IVIM and SAGA
A typical IVIM experiment consists of nontransduced negative controls (mock), separate transductions with a mutagenic positive control, and several transductions with vectors of unknown mutagenic potential. A detailed description of all the cell culture steps and specific recommendations can be found in Supplementary Data. Briefly, as described in Schwarzer et al., 15 both IVIM and SAGA start with the prestimulation of murine hematopoietic stem and progenitor cells (HSPCs) for 48 h after thawing (Fig. 1A). We used a serum-free medium supplemented with stem cell factor (SCF), interleukin-3 (IL-3), interleukin-11 (IL-11), and human FMS-related tyrosine kinase 3 ligand (FLT-3L). After the prestimulation phase, the cells were used in separate transductions with 1 × 10⁵ cells per 24-well plate. Two rounds of transductions with the retroviral vectors were performed on consecutive days to ensure good transduction rates (>80%). After transduction, the cells were expanded in a serum-containing medium with the same cytokine cocktail. Transgene expression by flow cytometry and VCN was assessed on day four, assuming the episomes had been diluted out sufficiently by then, considering the high proliferation rates during the first expansion phase. On day eight, to increase the selective pressure for the insertional mutants, the samples were diluted by transferring 1 × 10⁶ cells to a new well of a 6-well plate.

Overview of in vitro immortalization (IVIM) and surrogate assay for genotoxicity assessment (SAGA).
IVIM and SAGA branch off on day 15. While IVIM focuses on the replating phenotype after a low-density seeding on 96-well plates, SAGA uses gene expression differences between transformed and untransformed cultures to build a genotoxicity-prediction model using machine learning. 15
Cutoff strategy for the MTT assay for cell viability in IVIM scoring
In the classical IVIM readout, after 2 weeks of incubation of the 96-well plates, all wells were microscopically screened for evident proliferation and pH-based medium color change and classified accordingly into one of four categories (C1 to C4; Fig. 1A), with C4 showing no proliferation or medium color change and C1 evidencing robust proliferation of more than half the well with a medium color change to yellow. In between, C3 presents some proliferation but no visible pH changes, and in C2, there is usually an expansion of around half the well together with a medium color change to orange. This microscopic screening needs experience and is subject to individual scoring bias.
To enhance objectivity in clonal scoring, we performed an MTT assay to assess the metabolic activity of cells. Viable cells reduce the yellow tetrazolium dye (MTT) to its insoluble form, purple formazan, measurable at 540 nm with a microplate reader. 23 The resulting MTT values directly correlate with the number of viable cells per well. The highest mock optical density (OD) value in each assay was used as a cutoff, above which wells were considered positive. As C1 clones can reach a plateau with decreased metabolic activity and cell death due to their excessive proliferation, they were always counted as positive regardless of their MTT value to prevent a false-negative result. Our meta-analysis revealed that 25% of all MTT measurements from C1 clones had OD values in the same range as 75% of all C4 measurements (C125%: 0.003–0.256; C475%: 0.003–0.248; Fig. 1B).
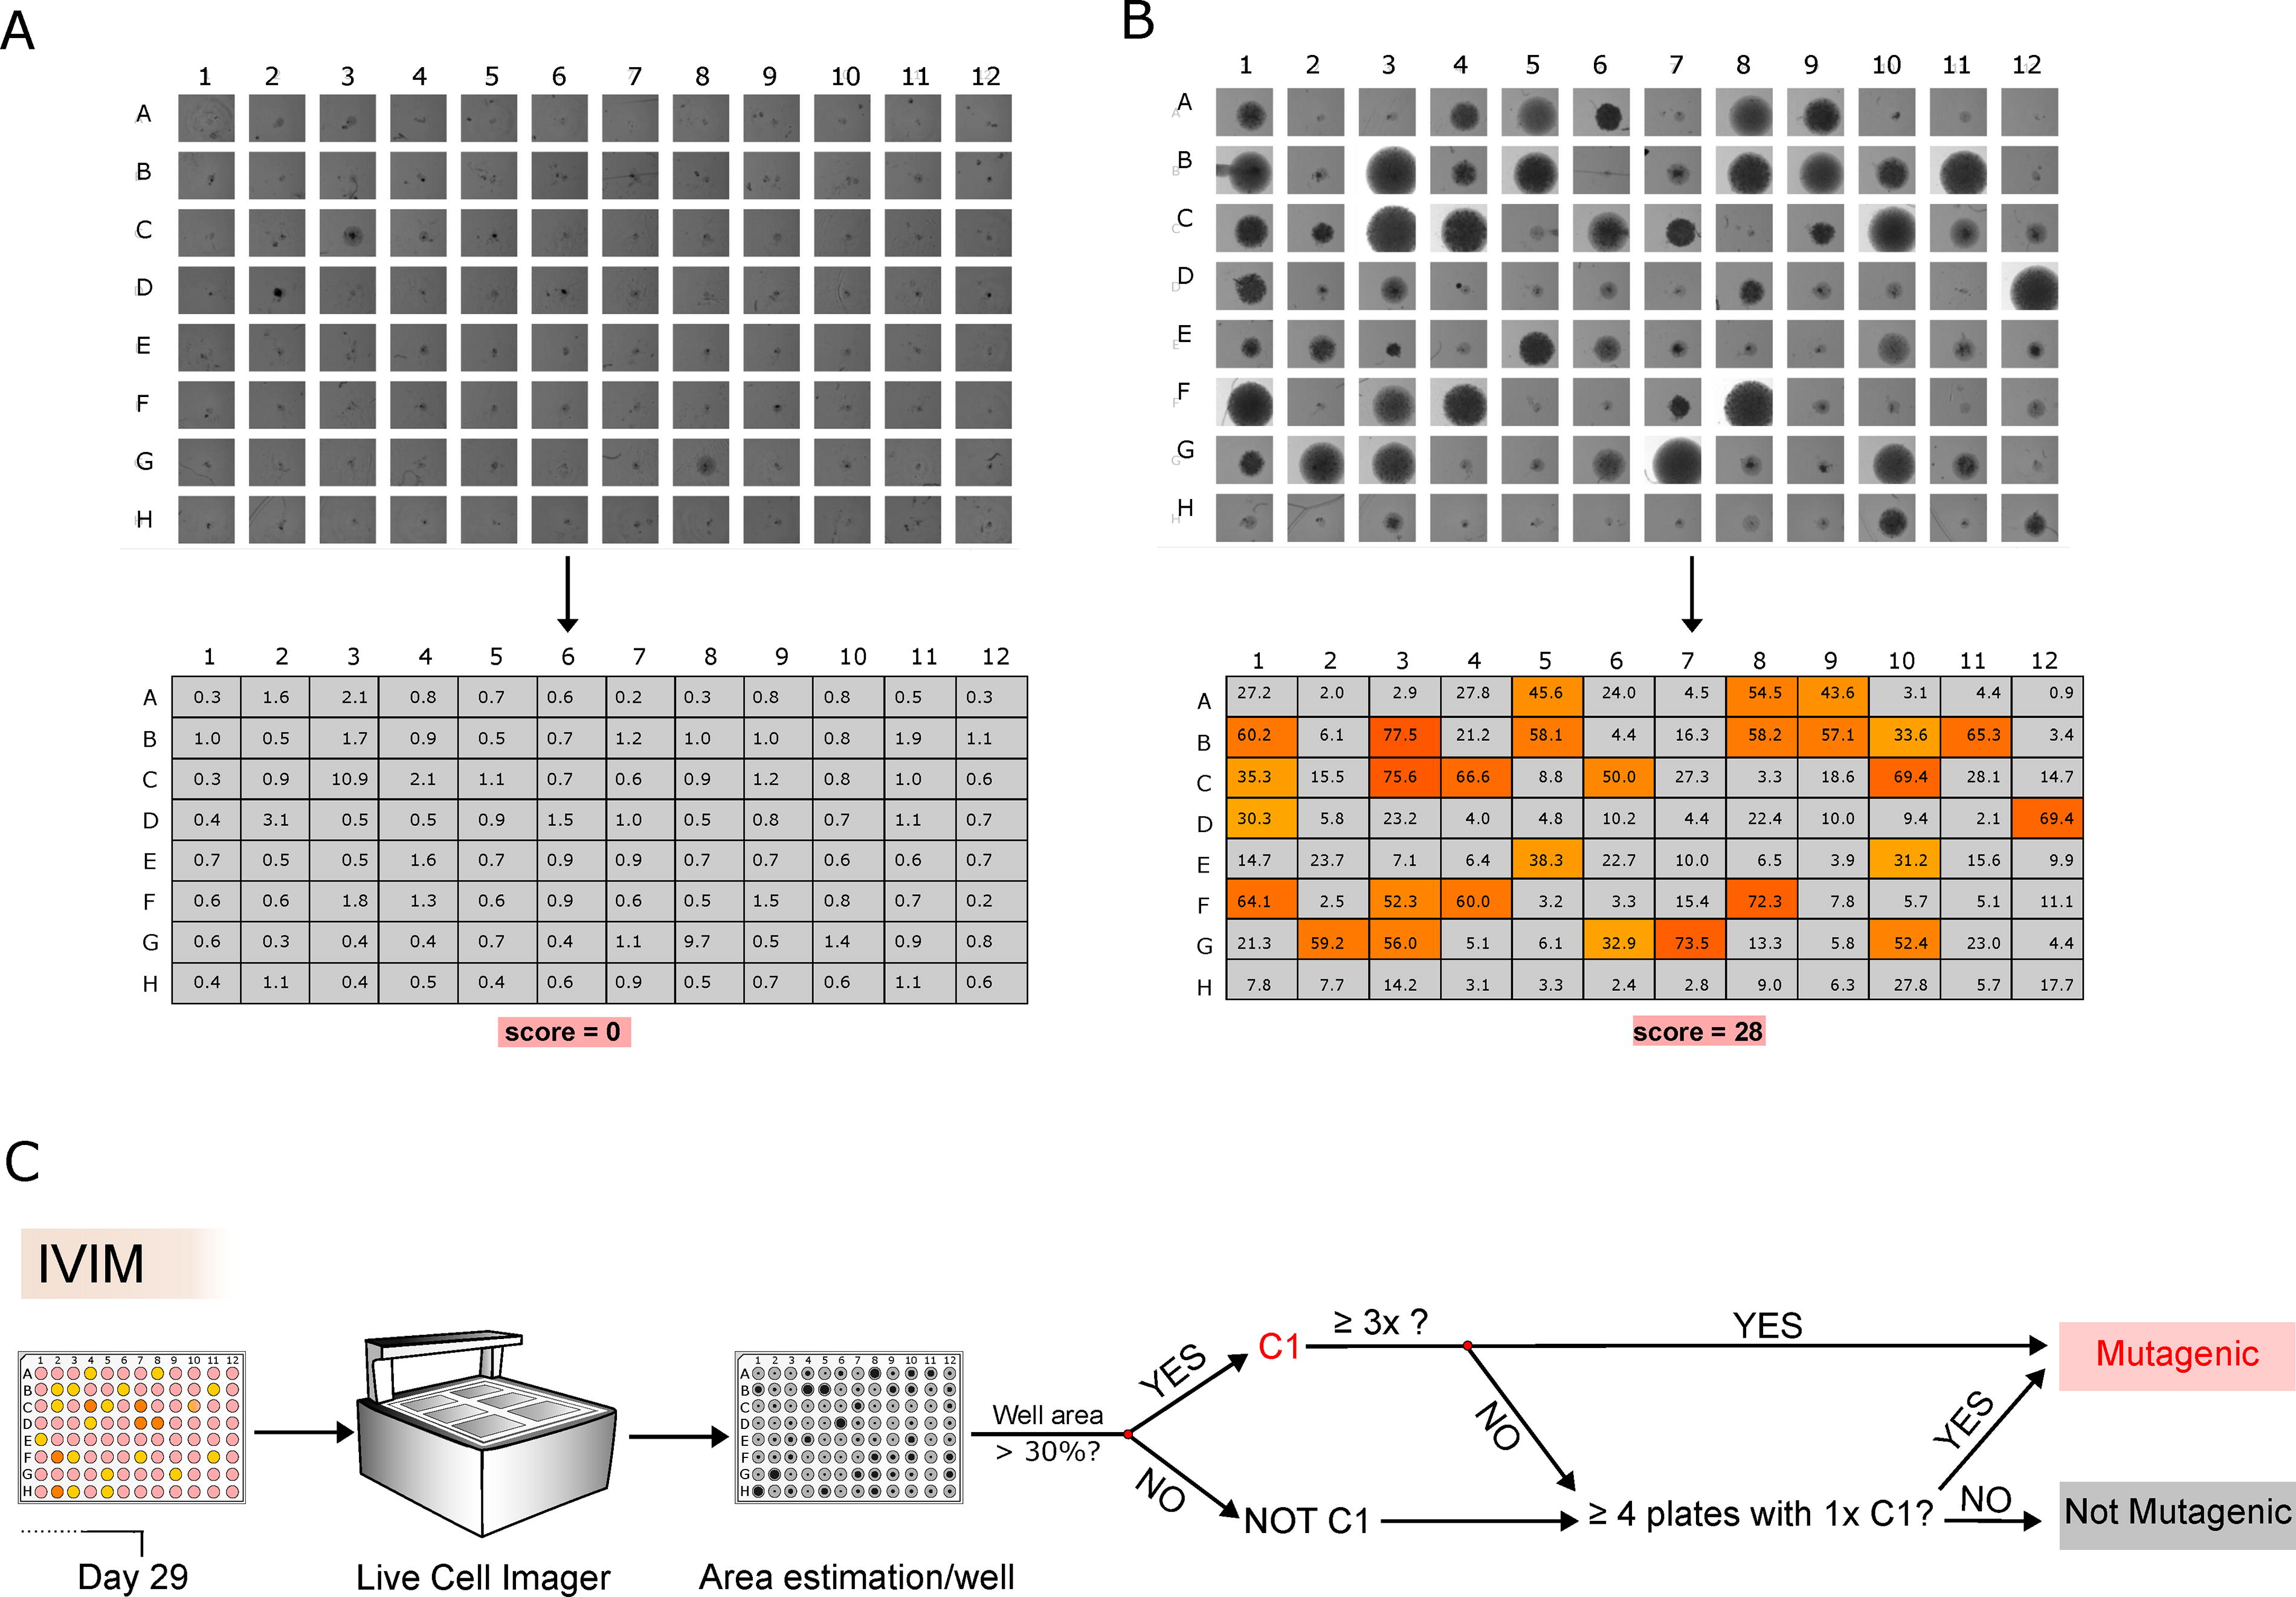
In some assays, we observed spontaneous background proliferation of mock cells. Hence, the cutoff strategy was adjusted to prevent potential false-negative scoring of test vectors. Meta-analysis of 22 independent IVIM experiments revealed a mean minimal distance (ΔC) between the median OD values of C4 wells and the minimum OD values of microscopically screened C1/C2 wells equal to 5.61. Figure 1C shows an example of one 96-well plate used for the calculation of the factor. In the adapted scoring strategy, if the highest mock OD value was greater than 5.61 times the mean OD values of microscopically scored C4 wells of the mock plates from the specific assay, the next mock value below this product was used as a cutoff.
The final score of the IVIM assay, the RF, was calculated using limiting dilution analysis (limdil function from the statmod package in R 24 ) combining both the microscopically screened C1-positive wells and those with MTT values above threshold. The RF directly correlates with the mutagenic potential of the vector used.
Mutagenicity prediction of different vector designs with IVIM
Data from 103 IVIM experiments performed between 2011 and 2023 were included in the current analysis. In each assay, we typically included three independent transductions (=replicates) of the highly mutagenic LTR-driven gammaretroviral vector RSF91 as a positive control for mutagenicity (Fig. 2A) and triplicates of untransduced “mock” controls. Additional vectors tested included other LTR-driven gammaretro- and lentiviral vectors (Fig. 2A), as well as SIN designs with different internal promoters and insulators or antisilencing elements (Fig. 2B).
IVIM assay accumulated results.
Figure 2C shows the RF values of the different vectors evaluated in IVIM, grouped based on their vector class (gammaretro-, alpharetro-, or lentiviral vector), their internal promoter in SIN designs (MND, SFFV, PGK, EFS), and the presence of an insulator or of antisilencing elements (UCOE, CBX3).
In the initial stages of the assay, the RF cutoff was based on metadata analysis of RSF91-transduced samples with a transduction efficiency ≥80% and VCNday4 ≥ 3. By then, ≥75% of these samples exhibited an RF higher than or equal to 3.17 × 10⁻⁴, corresponding to three or more positive wells per 96-well plate and designated as Q1. Samples with RFs above the Q1 were considered positive for immortalization, while values between the limit of detection (LOD; one positive well per plate—RF of 1.05 × 10⁻⁴) and the Q1 could not be distinguished from spontaneous background proliferation.
In general, as shown before, 10 LTR-driven gammaretroviral designs (RSF91, LTR-gRV) and SIN-configurations with strong internal viral-derived promoters (SIN-gRV and SIN-LV, with either SFFV or MND U3) showed a positive mutagenic score. Even in the presence of an insulator, the SIN-gRV.SF design achieved a similar score to its noninsulated alternative, highlighting the intrinsic mutagenic nature of this vector class. The addition of antisilencing elements to SIN-LV configurations with viral-derived internal promoters (SFFV.UCOE or CBX3.MND) led to mixed results, presumably due to a combination of the specific structure of the antisilencing element and limited data available.
The positive control, RSF91, did not display a replating phenotype in 57 out of 292 transductions, meaning the sensitivity of the IVIM assay lies around 80%. A similar proportion of negative scores were observed for other known highly mutagenic configurations, such as LTR-gRV (11% negative) and SIN-gRV.SF (20% negative). Although these vectors reached lower RF values than RSF91, they also had fewer measurements (RSF91n = 292; LTR-gVn = 9; SIN-gRV.SFn = 10). Similarly, LV.LTR.SF (n = 5), expected to score mainly positive, only had one value above threshold. Hence, to increase the reliability of our results, we have set a minimum of nine independent transductions per vector in current assays.
In contrast, SIN-designs from all three vector classes (SIN-gRV, SIN-LV, and SIN-AV) with internal physiological promoters (EFS and PGK) mainly had RF values below the Q1, with PGK-driven vectors displaying a safer profile than EFS. However, each SIN-LV group included vectors with different transgenes. Supplementary Fig. S1A–D shows the RF values for individual vectors, grouped based on their backbone and internal promoter but carrying different transgenes (S1A: SIN-LV.EFS; S1B: SIN-LV.SF; S1C: SIN-LV.MND; S1D: SIN-LV.PGK). The RF values suggest the specific transgene could influence the mutagenic score.
Background proliferation of mock samples can highly influence the RF scoring
Apart from intrinsic differences in the RF values due to vector configuration and promoter-transgene combinations, we noticed that the assay-specific behavior of mock samples could highly influence the MTT scoring. High background mock proliferation of mast cells led to uncertainty when evaluating a vector’s mutagenic potential. Supplementary Figs. S2 and S3 show that most cells at day 15 of the IVIM assay express a typical mast cell phenotype, as previously described. 13,25 In flow cytometry, these cells express the mast cell marker FcEr1α. In contrast, immortalized cells show a reduced mast cell population and were associated with a stem cell-like phenotype in flow cytometry (negative for the lineage markers CD11b, Gr-1, CD3, TER119, and B220 and negative for FcEr1α). Figure 3A shows the RF values of test vectors without evident clonal outgrowth on the 96-well plates using different cutoffs. When the highest mock was selected as cutoff (light-gray data points, “_alt” for alternative cutoff in the vector’s names), even when unusually high compared with other C4 wells of the same assay, the test vectors scored mainly negative. If the cutoff chosen was the first mock below 5.61 × meanC4 (black data points), most test vectors scored positive. However, the frequency distribution of the MTT raw values of two exemplary test vectors, SIN-LV.bGlobin (BB694) and SIN-LV.bGlobin.Venus, only slightly deviated from the mock distribution but did not overlap with that of RSF91 (Fig. 3B). Hence, in the total absence of clonal outgrowth on the 96-well plates, the MTT scoring raises the question of how different a vector has to be from mock to be scored as mutagenic.

Influence of the MTT scoring on the genotoxicity prediction.
Conversely, unusually low-scoring mock samples might result in potentially overestimated mutagenic scores, even without evident proliferation on the 96-well plates or medium color changes. Figure 3C shows the increase in RF for the test vectors when the highest mock is used as cutoff (light gray data points, “_alt” for alternative cutoff in the vector’s names), in contrast to using the highest microscopically screened C4 value from all vectors tested (black data points). In this case, the frequency distribution of the raw MTT values did not evidence clear differences between the groups (RSF91 included; Fig. 3D), meaning the choice of cutoff becomes overly sensitive. Overlaid in light red, the distribution of a prototypical RSF91 replicate shows a clear shift. For the RSF91 replicate of the assay with low mock MTT scoring (dark red), the higher values corresponded to C1 clones.
In fact, the different MTT thresholds displayed in Fig. 3A and C did not drastically influence the mutagenic score in the presence of C1 clones since those led to the sample’s overall positive classification. An example of this scenario is depicted in Fig. 3E for the SIN-gRV.SF.insulator design. This vector was measured in nine replicates and C1 clones were detected in four, resulting in a positive RF scoring, independently of the MTT cutoff chosen. A clear shift in the raw MTT frequency distribution from mock was mainly due to the C1 clones with high absorbances (Fig. 3F).
Proliferation behavior in bulk culture does not correlate with mutagenic potential
In the search for a simpler readout strategy, we investigated whether proliferation in bulk cultures could serve as a surrogate for insertional oncogenesis. In general, we observed better proliferation of untransduced samples at early time points of the assay (before the dilution step of day 8; Fig. 3G, exemplified for RSF91 and mock). Probably, this difference is due to the cellular stress induced upon transduction with retroviral vectors. In the late phase of the assay (days 8–15), RSF91-transduced cultures generally showed a higher proliferating capacity than mock (Fig. 3H, I). However, considering the vast overlap between the mock and RSF91 distributions, 110 samples per assay would be needed to detect a difference between those groups with a significance level of 0.05 and a power of 0.9 (sample size estimation). When dealing with vectors with less mutagenic potential than RSF91, which would maybe induce a more moderate proliferation advantage, 470 samples/assay would be needed to detect a difference in mean expansion factor half the size as the one between mock and RSF91, with the same certainty of 0.05 and power of 0.9. Hence, the proliferation advantage of transduced samples in bulk cultures cannot be reliably used as a scoring strategy.
Clonal scoring is the most suitable surrogate for insertional oncogenesis
Using the current MTT and clonal scoring strategy, 18.8% of the mock data (ntotal = 207) scored above the LOD, with 5.8% scoring above the Q1. However, when looking only at the clonal scoring, just four of the 207 mock samples had one C1 clone/plate. On the contrary, known mutagenic configurations (RSF91, LTR-gRV, SIN-gRV.SF, LV.LTR.SF, SIN-LV.SF) induced more than three C1 clones/sample at least once (Fig. 4A). The raw MTT values did not display such a clear classification as the clonal scoring, with overlapping distributions between the different vector types (Fig. 4B). As shown for the RF values, when further dissecting the main vector groups based on their transgene, the raw MTT values led to the same uncertainty regarding classification (Supplementary Fig. S4A–D, for SIN-LV configurations with EFS (A), SFFV (B), MND (C), and PGK (D) promoters), unlike the clonal scoring (Supplementary Fig. S4E–H, for SIN-LV configurations with EFS (E), SFFV (F), MND (G), and PGK (H) promoters). Since the mock samples showed considerable variation in the MTT values, the ability to confidently classify the test vectors without the information on clonal outgrowth proved limited.

Comparison of MTT-based results and clonal scoring. The groups in
All things considered, we concluded a scoring strategy based solely on the vector’s capacity to induce proliferation under limiting dilution would be more representative of the vector’s mutagenic potential. Statistical analysis revealed that for a sample that is distributed such as mock, a Weibull with scale = 0.00115, and shape = 0.26586, there is a chance of about 1/200 to encounter a single C1 clone and about 1/1000 to encounter two or more category one clones on one 96-well plate. We assume then that for a single plate, an occurrence of three or more C1 clones is a divergence from mock with a chance of 99.9%. In addition, we would expect about a 4.5% chance of finding, on average, one C1 clone every nine mock plates, fitting with the detection of four C1 clones in the 207 mock plates screened so far in our IVIM assays.
In the current setup of nine plates per vector, four plates or more with at least one C1 clone each would constitute a statistically significant shift from the mock baseline, with a certainty of 99% and a size of median shift of 0.02 (Mann–Whitney U). This estimate was calculated with the base assumption that all samples behave in Weibull distributions, as observed so far in the accumulated data, and constitutes the new readout for mutagenicity, leaving the MTT assay obsolete.
To interpret the results of our existing IVIM data in which more than 9 replicates were measured per vector, we estimated the expected number of plates with more than three C1 clones for samples behaving similar to mock or similar to our positive control RSF91 depending on the sample size (Supplementary Fig. S5A and zoomed-in in panel B). Based on the number of plates above threshold in relation to sample size, and considering all the available data points for the different vector configurations tested, the groups LTR.gRV, SIN.gRV.SF, SIN.gRV.SF.insulator, LV.LTR.SF, and SIN-LV.SF showed a clear deviation from the mock distribution, while SIN-LV.MND and SIN-LV.EFS evidenced only a slight shift, confirmed by the lower relative frequency of positive plates (Supplementary Table S1). All other vector groups overlapped with the mock distribution.
Live-cell imaging combined with growth area as the current IVIM scoring strategy
Another considerable limitation of the classical IVIM scoring is the bias of the clonal assignment, done by individual microscopic screening of each 96-well plate. Therefore, we evaluated the suitability of a live-cell imager (CellCyte X) to screen the 96-well plates semiautomatically. As output, full plate images and cell-covered area estimation per well were recorded for mock, SIN-LV.SF, and SIN-LV.EFS plates (Supplementary Figs. S6, S7 and S8). Our analysis showed clear differences between C1 clones from mutagenic designs and mock plates or wells without growth (Fig. 5A for mock and 5B for RSF91). A threshold of at least 30% of the well area covered by cells was set as limit to call it a C1 clone. For each new test vector, we suggest performing a set of three independent IVIM experiments on different days. Each experiment should contain at least three replicates of the mock control, the positive control, and the novel vector. For the evaluation of vector safety, you will have nine 96-well plates for each group. For mock and nontransforming vectors, we expect only two out of nine plates with one well above the 30% growth threshold (Supplementary Fig. S9A). Furthermore, none of those plates should have more than three wells above the 30% growth area (Supplementary Fig. S9B). If these criteria are met, a novel test vector would be characterized as mock-like or nontransforming. In contrast, mutagenic vectors will yield multiple plates with a lot of positive wells. However, in 2.5% of the cases, it is statistically possible to see up to five plates with one or more wells above the threshold also for mock. In case of unusually high background proliferation (an example is shown in Supplementary Fig. S10), we recommend repeating the complete IVIM experiment in question or switching to SAGA, which is independent of the replating phenotype. 15 The proposed final algorithm for mutagenicity scoring with our IVIM assay, as described above, is outlined in Fig. 5C. Semiautomated live-cell screening increases the transparency of clonal scoring but cannot solve the general limitation of moderate sensitivity and background proliferation in the IVIM assay.
Cell imaging and clonal scoring as the IVIM new readout strategy.
DISCUSSION
The lack of a reliable in vitro assay for risk assessment of retroviral vectors is one of the main challenges in preclinical safety testing for gene therapy. For 18 years, the IVIM assay was used to compare the mutagenic potential of retroviral vectors. 26 –32 However, the interpretation of IVIM results can be difficult. For this reason, we thoroughly reviewed IVIM data collected over the past 15 years and provide here a detailed description of the updated protocol, and a general scoring strategy based on the existing knowledge.
The IVIM assay has been in practical use for more than a decade and is actively requested by regulatory authorities as part of the preclinical safety package. When IVIM was first described in 2006, the main indicator of retroviral vector-induced genotoxicity was the ability of transformed cells to grow in a low-density seeding setting in 96-well plates. The MTT assay was later on introduced to increase sensitivity and quantify those cases in which the clonal outgrowth was less intense than RSF91 but potentially different from mock plates. The RF scores of the IVIM assays included in this analysis confirmed that IVIM is able to distinguish mutagenic designs, such as LTR-driven configurations and SIN-LVs with strong internal promoters, from safer alternatives with physiological promoters such as SIN-LV.PGK and SIN-LV.EFS.
With a full overview of many different vector configurations, our data indicate that the MTT assay might be overly sensitive to biologically irrelevant, small changes in cell proliferation. The mock background had a strong influence on the final scoring, which might not correlate with the true nature of the vector. The slight changes in proliferation behavior detected by the MTT assay could just be unrelated to retroviral vector-induced transformation since the level of proliferation needed to induce a robust C1 clone is much higher than spontaneous background growth.
Our data suggest that the ability to consistently proliferate in a low-density seeding setting remains exclusive for mutagenic designs. In fact, the clonal scoring has always had the highest weight on the RF score and subsequent safety decision since the C1 clones were always counted positive, irrespective of their MTT values, and triggered additional analysis such as insertion-site profiling.
However, statistically (and biologically), the appearance of outgrowing clones in untransformed samples cannot be completely ruled out, but it is important to note that they occur at very low frequencies. Our data showed that with enough assays, safer designs and mock samples might exhibit an occasional growth advantage on the 96-well plates. Hence, it is important to define a new cutoff in the decision algorithm with an emphasis on sample size. Enough transductions with a given vector have to be analyzed to gain a level of certainty about its mutagenic potential.
Eliminating the MTT makes sense from a biological perspective when interpreting the results. In 26 out of 103 assays, the highest mock value could not be used as a cutoff because it was higher than 5.61 × the mean of C4 wells. Often, in these assays, it was just the mock samples showing abnormal proliferation, sometimes even a few wells from only one replicate, while samples transduced with the test vectors behaved similarly to the usual nonproliferating mocks.
Using the current cutoff strategy only based on clonal outgrowth, the uncertainty due to the “gray zone” between the LOD and Q1 of the RF analysis is now greatly reduced. Vector designs in the RF score gray zone are now clearly negative because of the absence of C1 clones. The vectors expected to score positive, such as gammaretroviral configurations or SIN-LV.SF, still scored positive with the new scoring strategy, while safer alternatives such as SIN-LV.PGK remained negative.
A further simplification of this assay could have been the follow-up of proliferation behavior in bulk cultures since we have consistently observed that mutagenic designs boost cell numbers throughout the second phase of the assay. However, relying on this aspect would lead to the same consequences of the MTT-based approach: high dependence on mock background. In addition, the 96-well plate seeding might be a necessary step to induce the selection pressure needed by the insertional mutant, similar to our lymphoid assay setup in which key cytokines for lymphoid differentiation are reduced after some time in culture to promote differentiation of untransformed samples and as selective pressure for transformed clones. 33 Therefore, we concluded that bulk culture’s proliferation would not be sufficiently consistent and reliable to be used as a readout.
Another issue of the IVIM scoring is the subjectivity of the microscopic screening. Without a suitable imaging device, there is a lack of documentation on how much growth led to the classification of a C1-clone. Introducing a live-cell imager as part of the readout will lead to better standardization and more reproducible results. It also enables easy review and quality-check, increasing the transparency of IVIM results and decisions on when to expand certain wells for later integration-site analysis.
Although the main determinants of retroviral vector-induced genotoxicity are the vector class, whether it is LTR-driven or an SIN design, and the internal promoter of choice, it has also been shown that the specific transgene could influence the mutagenic potential. 3 The differences observed with the RF scoring of vectors with the same backbone but a different transgene were mainly due to the MTT assay, since most vectors behaved similarly when considering only the clonal outgrowth. SIN-LV.EFS and SIN-LV.PGK vectors showed a safe pattern with the new scoring strategy, comparable with the previous IVIM results. When looking at the SIN-LV.MND group as a whole, combining all vectors with different transgenes, IVIM results lie closely to the expected behavior of mock-like samples. However, when considering the influence of the transgene, with a score of two plates above the threshold over nine total replicates, SIN-LV.MND.RAG2 was classified as mutagenic, consistent with our previous assessment of this vector. The expanded clones from this vector harbored high-risk insertions near Mecom, and SAGA of the bulk cultures also revealed dysregulation of the SAGA oncogenic signature. Taking into account the recent myelodysplastic syndrome (MDS, n = 6) and acute myeloid leukemia (AML, n = 1) cases reported for patients treated with Lenti-D (a SIN-LV with the internal MND U3 promoter) in a clinical trial for adrenoleukodystrophy, 8 it is clear that SIN-LV.MND vectors are especially hard to assess. In our assays, they can dysregulate the SAGA genes but might not always lead to full immortalization in IVIM.
Regulatory guidelines for retroviral vector genotoxicity testing suggest the use of in vivo models, such as the Cdkn2a knockout mouse, 34,35 which fastens the onset of insertional mutagenesis-induced leukemia due to the cooperative effect of the tumor-suppressor knockout. However, general drawbacks of in vivo models include the development of spontaneous tumors, long waiting times, the requirement for a large number of animals, and limited sensitivity. Recently, an in vitro assay using human-induced pluripotent stem cells reprogrammed to liver cells has been proposed as a personalized, human-based, and standardized alternative. 36 This approach assesses vector safety through insertion-site analysis, global differential gene expression, aberrant transcript analysis, and epigenetic changes. While promising, the transferability of the results from induced pluripotent stem cell-derived liver cells to the hematopoietic system or to CAR-T (chimeric-antigen receptor T cell) therapies remains uncertain. Our attempts to develop a humanized version of the IVIM assay have been challenging, particularly concerning the development of clones under limiting dilution, and require further investigation.
Our work shows an up-to-date overview of the current de facto gold standard in vitro assay for risk assessment of retroviral vectors for gene therapy. The revised protocol and refined cutoff improved the reliability and consistency of our results, as well as reduced the uncertainty of the classical IVIM readout.
Footnotes
ACKNOWLEDGMENTS
The authors thank Ute Modlich, Sabine Knöß, and Christopher Baum for their invaluable contribution to the development of the IVIM assay. They thank all the IVIM partners over the years for their input, questions, and support.
AUTHORS’ CONTRIBUTIONS
A.L.B., V.D., G.P., M.H., F.M., J.F., B.W., and M.R. acquired the data. A.L.B., P.J.-N., and M.R. wrote the article and interpreted the data. P.J.-N. performed statistical analysis. A.S. supervised the studies, interpreted the data, and revised the article. All authors reviewed the article.
AUTHOR DISCLOSURE
The authors received research funding from academic and industrial partners to perform IVIM assays as fee-for-service. Detailed vector configurations were blinded when nondisclosure agreements were in place.
FUNDING INFORMATION
Results incorporated in this study received funding from the European Union’s Horizon 2020 research and innovation program under grant agreement No.
SUPPLEMENTARY MATERIAL
Supplementary Data
Supplementary Figure S1
Supplementary Figure S2
Supplementary Figure S3
Supplementary Figure S4
Supplementary Figure S5
Supplementary Figure S6
Supplementary Figure S7
Supplementary Figure S8
Supplementary Figure S9
Supplementary Figure S10
Supplementary Table S1
References
Supplementary Material
Please find the following supplemental material available below.
For Open Access articles published under a Creative Commons License, all supplemental material carries the same license as the article it is associated with.
For non-Open Access articles published, all supplemental material carries a non-exclusive license, and permission requests for re-use of supplemental material or any part of supplemental material shall be sent directly to the copyright owner as specified in the copyright notice associated with the article.