
Abstract
Murine myeloma cell lines play an important role in different areas of scientific research and are essential tools for monoclonal antibody production technology. Thus, it is important to understand the biology of these cell lines in order to provide useful information to various research fronts. The present study aims to perform detailed analyses of surface antigens expressed on three major murine myeloma cell lines extensively used for MAb production. The P3X63Ag8.653 cell line expresses molecules associated with T cell interaction (CD40low, CD80low), as well as antigens related to plasma cell phenotype (CD138high, CD184low). The Sp2/0-Ag14 cell line presents molecules associated with BCR activation and regulation (CD79blow, CD22low, CD72med), molecules related to T cell interaction (CD40low, CD80low), and markers of plasma cell phenotype (CD138high, CD184low). The NS1 cell line presents all molecules of plasma cell phenotype evaluated in this study (CD184low, CD138high, CD38med) with low expression of CD72 (CD72low), a molecule related to BCR activation. Molecules associated with immune response modulation such as CD23 and CD25, as well as CD117, a marker related to undifferentiated cell phenotype, were not observed in any of the three murine myeloma cell lines evaluated. These data show that in spite of their common origin and function, the immunological profiles differ between P3X63Ag8.653, Sp2/0-Ag14, and NS1 cell lines.
Introduction
Myeloma cell lines that have been used for the generation of hybridomas were originally developed as models for the study of human multiple myeloma.(8) Lately, these cell lines have been employed in diverse research areas, such as recombinant protein expression,(9) free radical metabolism,(10) apoptosis studies,(11) and anti-tumor drug trials.(12) However, features like natural growth in suspension, allowing a large-scale production and adaptation to different cell culture conditions, coupled with loss of secretory capacity, enable the use of murine myeloma cell lines for MAb production, their most recurrent utilization. There are few non-secretory murine myeloma cell lines that have been used in hybridoma generation worldwide, such as P3X63Ag8.653, Sp2/0-Ag14, NS1, and NS0.(9) These cell lines were originated from plasmacytoma cells isolated from BALB/c mice,(13) which were submitted to different selection processes that induced several phenotypic changes, such as alterations in the bcl-2 gene, a proto-oncogene involved in apoptosis,(14) a larger number of chromosomes than normal mouse cells,(15) and loss of the ability to secrete heavy and light immunoglobulin chains.(16)
Although it is extensively used worldwide, the technique of producing MAbs is time-consuming and expensive. Despite the existence of strategies to optimize MAb production,(17–19) murine myeloma cell lines continue to be widely used in MAb production. Nevertheless, there is a paucity of information on the biology of the myeloma cell lines used in the fusion process. Moreover, the correct phenotyping of any continuous cell line became a major issue in recent years after several publications have shown misidentification and cross-contamination of commonly used cell lines.(20) Thus, in the present study, we have characterized surface antigens of P3X63Ag8.653, Sp2/0-Ag14, and NS1, three murine myeloma cells lines extensively used for MAb production.
Materials and Methods
Cell lines and growth conditions
Three murine myeloma cell lines were evaluated in this study. Cell line Sp2/0-Ag14 (CR034) was directly obtained from Banco de Células do Rio de Janeiro (Rio de Janeiro, Brazil) and was routinely propagated in Dulbecco's Modified Eagle's Medium (DMEM; Cultilab, Campinas, Brazil) supplemented with 10% fetal bovine serum (FBS; Cultilab), 100 U penicillin/mL, 100 μg/mL streptomycin, and 0.25 μg/mL amphotericin B (Sigma-Aldrich, St. Louis, MO). The NS1 cell line was kindly provided by the Laboratório de Engenharia Celular (Faculdade de Medicina de Botucatu, Universidade Estadual Paulista Julio de Mesquita Filho [UNESP], Botucatu, Brazil), and the P3X63Ag8.653 cell line was obtained from cell culture stocks maintained at the Laboratório de Imunologia Aplicada (Departamento de Microbiologia, Imunologia e Parasitologia, Universidade Federal de Santa Catarina [UFSC]). Both cell lines were cultured in RPMI 1640 (Cultilab) supplemented with 10% FBS, 100 U penicillin/mL, 100 μg/mL streptomycin, and 0.25 μg/mL amphotericin B (Sigma-Aldrich). Cultures were grown at 37°C in humidified atmosphere containing 5% CO2, and passage occurred when cells were in logarithmic growth phase (approximately every 3 days). The three cell lineages evaluated in this investigation were previously used in MAb development,(21–23) indicating that they retain their ability to fuse and lead to the formation of functional hybridomas.
Cell staining and gating strategy
In all cytometry experiments performed, cells were centrifuged at 300 g for 5 min at 20°C and washed twice with FACS buffer (PBS supplemented with 2% FBS and 5 mM EDTA). For flow cytometry analyses, 1 x 10⁶ cells per sample were incubated with FACS buffer containing 0.1 μg of anti-mouse FcγIII/II receptor (clone 2.4G2) for 20 min at 4°C. Cells were then washed with FACS buffer and staining was performed using 0.2 μg PE anti-CD19 (clone 1D3), 0.5 μg of PE anti-CD21/CD35 (clone 7G6), 0.2 μg PE anti-CD22.2 (clone Cy34.1), 0.5 μg FITC anti-CD23 (clone B3B4), 0.5 μg FITC anti-CD25 (clone 3C7), 0.2 μg PE anti-CD38 (clone 90), 0.5 μg FITC anti-CD40 (clone mar/23), 0.2 μg PE anti-CD72 (clone JY/93), 0.5 μg FITC anti-CD79b (clone HM79b), 0.5 μg FITC anti-CD80 (clone 16-10A1), 0.5 μg FITC anti-CD117 (clone 2B8), 0.02 μg PE anti-CD138 (clone 281-2), or 0.5 μg FITC anti-CD184 (clone 2B11/CXCR4). All antibodies were purchased from BD Pharmingen (San Jose, CA). Cells were stained at 4°C for 30 min and then washed with FACS buffer. At least 100,000 cells were acquired on a FACSCalibur flow cytometer (Becton-Dickinson, San Jose, CA) and analysis was performed using FlowJo 8.6.3 software (Tree Star, Ashland, OR).
Surface antigen expression was performed on viable cell populations, determined by staining with 5 μM of propidium iodide (PI; BD Pharmingen). Samples stained with PI were first gated based on side scatter (SSC) and FL-2-(PI-) events, and this gating strategy was used to guide and select viable cell subsets in all samples. The mean values of FSC and SSC parameters were calculated using the viable cell population. Then, viable cells were gated on FL-1+ or FL-2+ events according to the antibodies described above. Figure 1 shows the gating strategy for NS1 cell line. P3X63Ag8.653 and SP2/0-Ag14 cells presented similar profiles (data not shown) and the same gating scheme was used for them. Data analysis was performed using FL-3 channel open in order to observe a possible cellular autofluorescence, which was deducted from the results when necessary. In all experiments performed, unlabeled cells were used as negative controls. The density of molecules present in each cell was determined as mean fluorescence intensity (MFI), expressed as arbitrary relative linear fluorescence by the FlowJo 8.6.3 software (Tree Star). Markers were considered to be positive with MFI values above 10. Low markers had values between 10 and 200, medium marker values were above 200 and below 1000, and high marker values were above 1000. Values for all parameters were defined by the average of the data from five separate experiments±standard deviation.
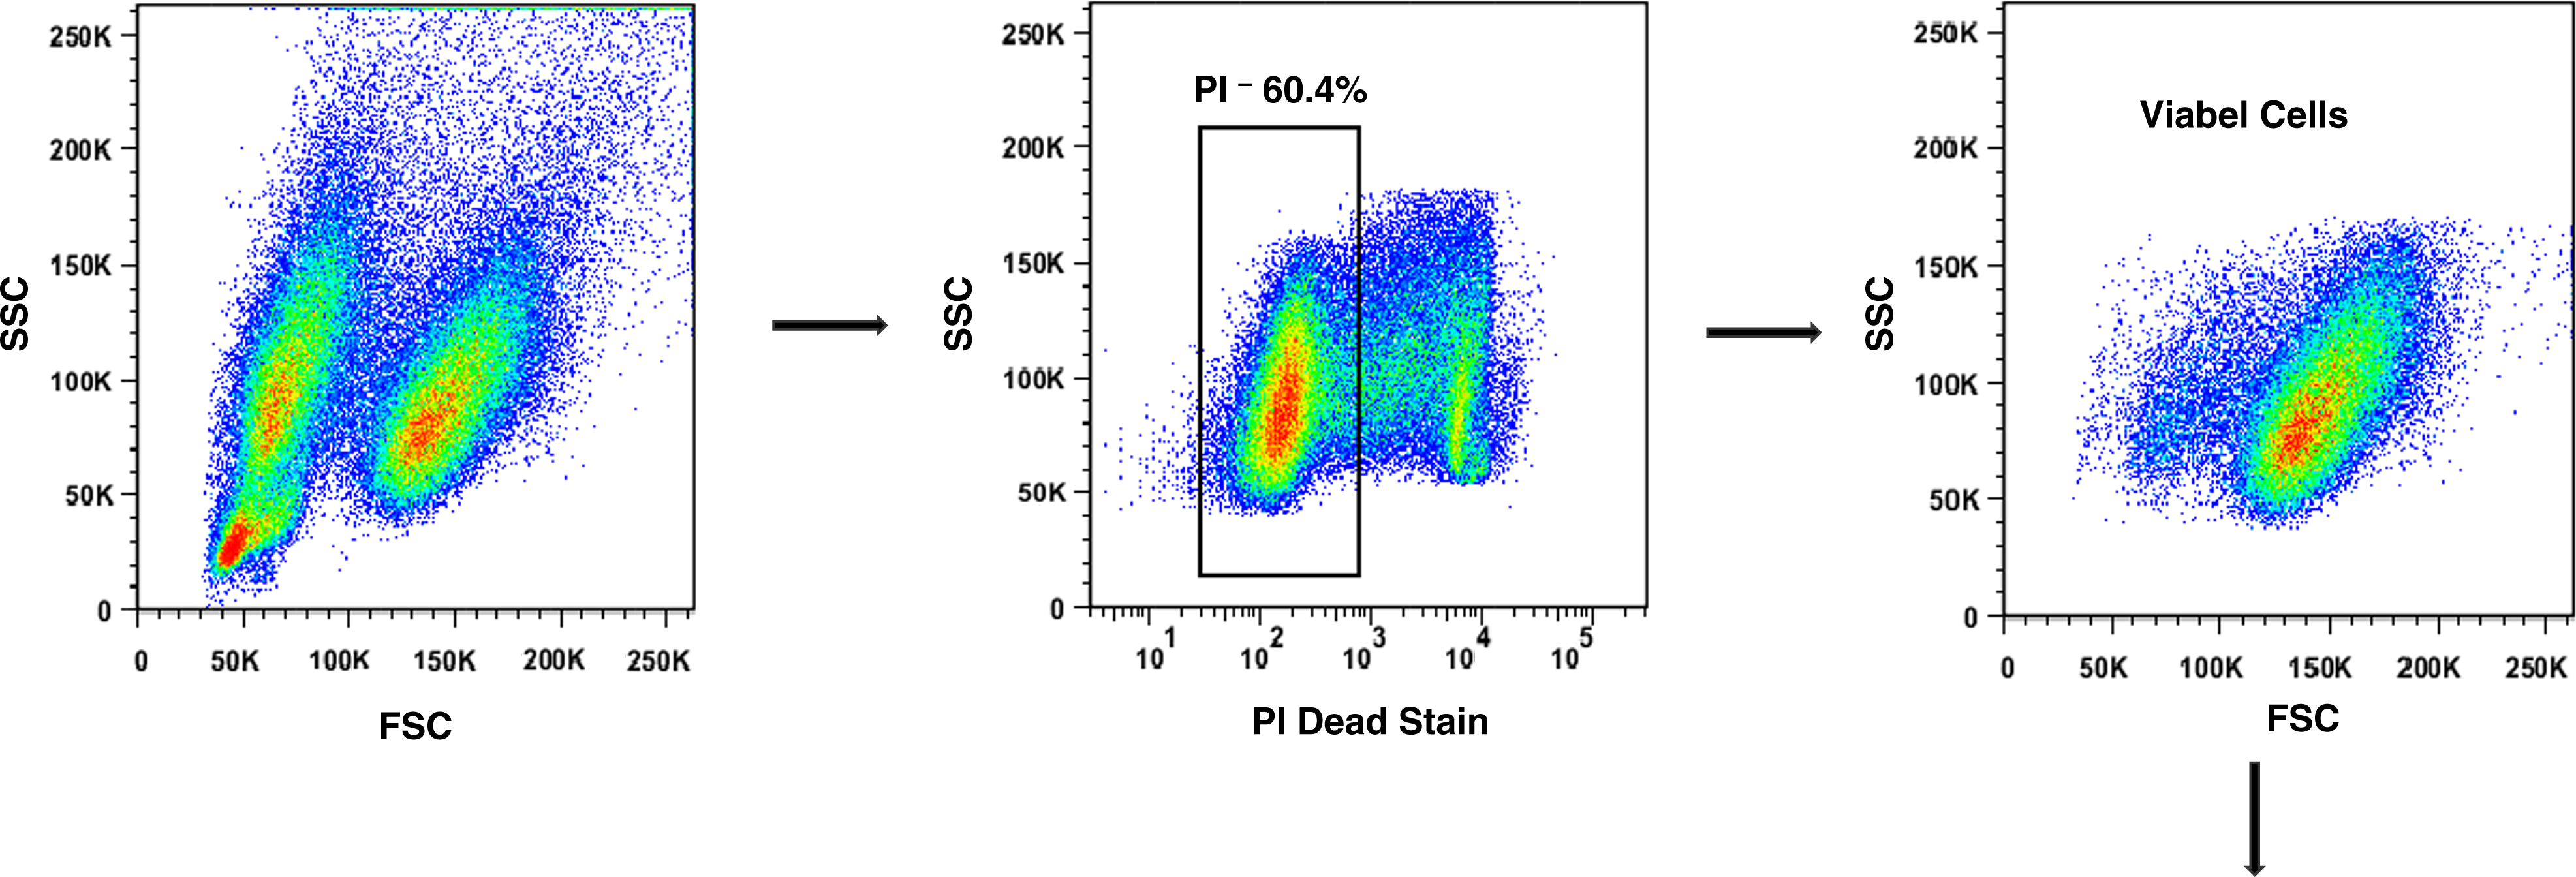
Gating strategy used throughout the experiments for flow cytometry analysis. NS1 cells were stained with propidium iodide (PI) and acquired in flow cytometer. Events showed by forward (FSC) and side (SSC) scatter were gated on live cells (PI-). These viable cells were then gated on FL-1+ or FL-2+ events to evaluate the presence of molecules assessed in this study, CD79b-FITC and CD138-PE. The data were obtained from one representative experiment of five experiments performed.
Statistical analysis
In order to evaluate normality and homoscedasticity of the FSC and SSC parameters, Shapiro-Wilk and Levene tests were used, respectively. A p value > 0.05 for both tests was considered significant. One-way analysis of variance (ANOVA) showed significance (F>1 and p<0.01), and post-hoc analysis was performed by Tukey HD test, explaining where the differences occurred. Statistical analysis was performed using the Statistica 7.0 (StatSoft®, Tulsa, OK).
Results
Cell parameters
Aiming to determine cell parameters such as size and complexity, murine myeloma cell lines SP2/0-Ag14, NS1, and P3X63Ag8.653 were analyzed by flow cytometry. In all experiments, unlabeled cells were acquired to establish the values of detectable forward (FSC) and side scatter (SSC). The three cell lines evaluated presented different size and cell complexity parameters. The P3X63Ag8.653 cell lineage FSC and SSC mean values were 478.00±38.65 and 252.40±27.96, respectively. The mean values for SP2/0Ag14 cell line were 595.20±34.88 for FSC and 360.40±13.01 for SSC, while the NS1 cell line presented 572.20±40.35 for FSC and 244.40±15.69 for SSC in media (Fig. 2). An analysis of variance showed that size difference among cell lineages is highly significant (F=13.327, p=0.0009). The post-hoc test showed that the lineage P3X63Ag8.653 is significantly smaller than other cell lines (p<0.01), while no significant size differences were found between NS1 and Sp2/0-Ag14 cells. The ANOVA test also showed highly significant differences between the cell lines evaluated regarding cellular complexity (F=52.558, p=0.000001). Post-hoc analysis showed that Sp2/0-Ag14 presents cell complexity significantly greater than other cell lines (p<0.01), while no significant differences between NS1 and P3X63Ag8.653 were observed.
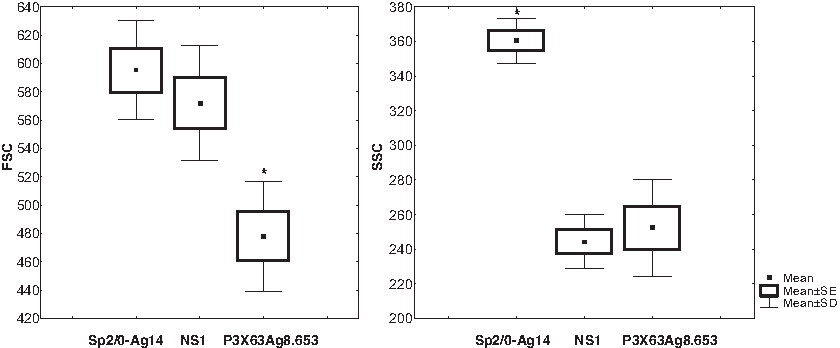
Forward scatter (FSC) and side scatter (SSC) values for Sp2/0-Ag14, NS1, and P3X63Ag8.653 cell lines. Cells were acquired in flow cytometer and values of FSC and SSC were determined using the FlowJo 8.6.3 software (Tree Star). Data represent mean±SE and mean±SD of five independent experiments performed. *p<0.01.
Surface molecule expression patterns
To gain insight into functional properties of the myeloma cell lineages, we analyzed typical surface markers related to BCR activation (CD19, CD21/35, CD79b), BCR regulation (CD22.2, CD72), T cell interaction (CD40, CD80), modulation of the immune response (CD23, CD25), and markers for plasma cells (CD38, CD138, CD184) and undifferentiated cell phenotypes (CD117) (Table 1). The marker analysis of cell lines SP2/0-Ag14, NS1, and P3X63Ag8.653 were performed only on viable cells (PI-). Of the molecules evaluated, those related to undifferentiated cell phenotype and modulators of the immune response were not found in any of the three cell lines.
Expression of evaluated molecules was classified according to the mean fluorescence intensity (MFI) value.
The P3x63Ag8.653 cell line expressed molecules related to T cell interaction (CD40low, CD80low) and plasma cell phenotype (CD38-, CD138high, CD184low). Expression of BCR activation and regulation markers were not observed in this lineage. Among the cell lines evaluated, SP2/0-Ag14 showed the largest variance in surface marker expression. The cell profile of BCR activation and regulation markers was CD79blow, CD22lowlow and CD72med. SP2/0-Ag14 cells also expressed molecules related to T cell interaction (CD40low, CD80low), as well as markers related to plasma cell phenotype (CD38-, CD138high, CD184low). Differently, the NS1 cell line presented all molecules related to plasma cells phenotype evaluated in this study (CD38med, CD138high, CD184low) and had low expression of CD72 (CD72low), a molecule related to BCR activation. Other molecules related to BCR activation and T cell interaction markers were not found in NS1 cells. Immunophenotyping of cell line surface antigens expressed in the cell lines used are shown in Figure 3. Moreover, the phenotype determined for each cell line, as well the expression level of the markers evaluated, remained stable over several in vitro passages (data not shown).

Expression of P3X63Ag8.653, Sp2/0-Ag14, and NS1 cell line surface antigens. Cells were stained with specific conjugated antibody and acquired in flow cytometer. Histograms show populations of stained cells (black lines) or unstained control cells (gray). Markers CD23, CD25, CD117, CD19, and CD21/35 were negative for all cell lines analyzed and are not represented. The data were obtained from one representative experiment of five experiments performed.
Discussion
Murine myeloma cell lines are important tools in several areas of scientific research and are essential for MAb production. Despite the fact that MAbs have had a profound impact on the improvement of health and welfare of both humans and animals, their production is extremely laborious, time-consuming, and expensive; therefore, several modifications have been proposed to optimize this procedure.(7) Nevertheless, most MAbs currently produced still use myeloma cell lines in the hybridoma fusion process. Facing the scarcity of data on the biology of classic murine myeloma cell lines, detailed immunophenotyping of these cells may be the first step in authenticating these cell lines, as well as in conceiving new strategies for optimizing MAb production. Thus, the present study sought to expand the current understanding of the immunologic profiles of murine plasmacytoma cell lines P3X63Ag8.653, SP2/0-Ag14, and NS1.
In terms of the markers expressed, cell lines P3X63Ag8.653 and SP2/0-Ag14 were very similar to each other, contrasting with the NS1 cell line. The difference can be explained by the isolation process these cells lines underwent. The discovery that injection of mineral oil into the BALB/c mice peritoneum induced plasma cell tumor was the starting point for the development of non-secretory myelomas cell lines.(13) One such tumor, MOPC21 (mineral oil-induced plasmacytoma, accession no. 21), was found to secrete IgG1; after passing through various processes of selection, it resulted in a heterogeneous population of cells able to grow in suspension named P3K cells. The P3K cells were subsequently cloned, giving rise to a cell clone named P3-X27, which was able to synthesize and secrete IgG1. P3-X27 has gone through several processes of subcloning, resulting in two new non-secreting immunoglobulin cell lines, P3-X63 and 289-16.(8)
Despite the fact that the 289-16 cell line maintained the capacity to produce the immunoglobulin light chain, it did not secrete IgG1 and was selected for resistance to 8-azaguanine, being subsequently renamed NS1 cell line.(16) The cell line P3-X27, selected by a deficiency in the hypoxanthine phosphoribosyl transferase enzyme (HPRT), yielded the P3X63Ag8 cell line. Successive cloning cycles of the P3X63Ag8 cell line resulted in P3X63Ag8.653, a cell line unable to synthesize heavy and light immunoglobulin chains.(24) Another research group fused spleen cells from BALB/c mice immunized with sheep red blood cells with P3X63Ag8 cells, establishing the Sp2/0-Ag14 cell line.(15) The BCR accessory molecules CD79b, CD22, and CD72 were present in the SP2/0-Ag14 cell line but absent in the P3X63Ag8.653 cell line. The fact that the SP2/0-Ag14 cell line had originated from the fusion of the P3X63Ag8 cell line with mouse splenocytes may explain the elevated number of B cell markers expressed on these cells, as well as the size difference when compared with P3X63Ag8.653 and Sp2/0-Ag14 cell lines.
Cell lines originating from cell fusion processes, beyond inheriting phenotypic characteristics such as membrane receptors, generally exhibit greater cytoplasmic mass and higher chromosome numbers than their parental cell lines. One aspect involved in cell dimension is the size of the genome; usually large cells have large genomes.(25) Sp2/0-Ag14 has 73 chromosomes on average,(26) whereas P3X63Ag8.653 has a karyotype ranging from 55 to 68 chromosomes.(27) The increased number of chromosomes, as well as the fact that during the derivation process cells were fused with splenocytes, may explain why Sp2/0-Ag14 is bigger than P3X63Ag8.653, even though both cell lineages originated from the same parenteral cell line. Although it has no history of fusion in its origin, NS1 is a similar size as SP2/0-Ag14. As cell size can also be related to biosynthetic activity,(25) the dimension of NS1 could be explained by the ability to synthesize the immunoglobulin light chain, which is absent in the other cell lines, suggesting a higher metabolic cell activity and consequent increase in cytoplasmic mass.
The NS1 cell line was established independently of the two other cell lines evaluated, and this distinct origin might explain the differences observed between cell phenotypes. A significant difference is the expression of CD38, expressed by the NS1 cell line, while absent in the other two. According to Oliver and colleagues,(28) the CD38 molecule, unlike in human cells, is down-regulated in murine plasma cells. This could explain the absence of CD38 in cell lines P3X63Ag8.653 and SP2/0-Ag14; however the expression of this marker in the NS1 cell line indicates that its presence can also be found in murine plasma cells. The expression of other plasma cell markers was more homogeneous. The adhesion molecule CD138, responsible for anchoring plasma cells in the bone marrow, and the CD184 molecule, a chemokine receptor linked to cell migration, are characteristic of the plasma cell phenotype.(29) As expected, all three cell lines analyzed expressed both molecules. Nevertheless, while CD184 was expressed at low levels, CD138 was highly expressed.
Different phenotypic aspects of the classic myeloma cell lines used in hybridoma generation are presented here. Despite their common origin and function, the parameters of size and internal complexity, as well the expression of some markers, proved to be characteristic for each cell line, allowing distinguishing phenotypes of P3X63Ag8.653, SP2/0-Ag14, and NS1. The differences in the expression of some surface markers may be related to different metabolic responses when these cell lines are kept in vitro for long periods of time, and must be considered in MAb development protocols, as well as when using these cell lines in biochemical and pharmacological assays. However, further studies are needed in order to define more precisely how these proteins can interfere in such assays.
Footnotes
Acknowledgments
We are grateful to Dr. Elenice Deffune (Faculdade de Medicina de Botucatu/UNESP) for kindly providing the NS1 cell line and to Prof. André Báfica (UFSC) for a critical reading of the manuscript.
Author Disclosure Statement
The authors have no financial interests to disclose.