
Abstract
L-Asparaginase (ASNase) is important for the treatment of childhood acute lymphoblastic leukemia. ASNase sensitivity has been shown to correlate with the asparagine synthetase (ASNS) protein content in acute lymphoblastic leukemia cell lines. However, there have been few studies to determine ASNS protein levels in human leukemias, since no appropriate monoclonal antibody is available for such quantitative analysis. In this study, we report the generation of anti-ASNS monoclonal antibodies, which are applicable to flow cytometry and enzyme-linked immunosorbent assay. These monoclonal antibodies should provide a valuable tool for the quantification of ASNS protein level and estimation of ASNase-resistance in leukemia cells.
Introduction
The baculoviral expression system using the insect cell line Sf9 as the host cell has been applied to the preparation of a large amount of protein. ASNS also has been purified efficiently by Sf9 expression system.(14) Meanwhile, our group and others have shown that the membrane proteins or fusion proteins to viral protein gp64 are displayed not only on the Sf9 cells, but also on the budded baculovirus (BV) particles. Hence, the exogenous proteins displayed on BV may be used for immunization without requiring purification of the antigen.(15–17)
We report here the generation of monoclonal antibodies using the N-terminal region of ASNS displayed on BV. These antibodies recognize human ASNS, as shown by Western blotting, immunofluorescent staining, flow cytometry, and enzyme-linked immunosorbent assay (ELISA). These anti-ASNS monoclonal antibodies potentially enable the establishment of a quantitative measurement of the ASNS protein level in leukemic cells, which in turn allows for clinical evaluation of ASNase sensitivity in human leukemia.
Materials and Methods
Preparation of antigen (N-terminal region of ASNS displayed on BV) and immunization protocol
The cDNA of the ASNS N-terminal region (amino acid residues 2 to 51, designated as N-AS) was amplified by PCR with the following primers: 5′-AACTGCAGTGTGGCATTTGGGCGCTGTTT-3′ and 5′-CCGCCAACCGGTGAAATCCA-3′, using Human Fetal Brain Marathon-Ready cDNA (Clontech Laboratories, Mountain View, CA) as a template, and then ligated to the gp64 gene. Recombinant virus bearing the N-AS gene was prepared as described previously.(16,17) After 72 h of infection, the budded viruses (N-AS-BV) were collected from the Sf9 culture media by centrifugation at 40,000 g for 40 min and used as the immunogen. To avoid the unwanted reaction to gp64 itself, the gp64 transgenic mice were used for immunization as described.(17) The gp64 transgenic mice were immunized intraperitonially (i.p.) with 70 μg of N-AS-BV along with 0.1 μg of purtussis toxin. An additional immunization was performed i.p. with 70 μg of N-AS-BV without adjuvant twice at 2-week intervals. Three days after the final immunization, spleen cells were isolated and fused at a ratio of 1:10 with the mouse myeloma cell line NS-1 using standard procedures. The fused cells were cultured in HAT selection media (0.1 mM hypoxanthine, 0.1 mM aminopterine, and 0.16 mM thymidine) for 7 days. Eight days after the fusion, the hybridoma culture supernatants were harvested and screened for antibody production by ELISA and Western blotting against N-AS-BV. An ELISA using antigen-expressing BV (BV-ELISA) was performed as described previously.(17)
Cell lines and transfectant
K562 cells and MOLT-4 cells were purchased from the RIKEN Cell Bank (Ibaraki, Japan). K562 cells were suspension-cultured in F-12 Nutrient Mixture (Ham's F-12) medium (Life Technologies, Carlsbad, CA), and MOLT-4 cells were suspension-cultured in RPMI 1640 medium (Sigma-Aldrich, St. Louis, MO) containing 10% fetal bovine serum and penicillin and streptomycin under a 7% CO2 atmosphere at 37°C. For the generation of hemagglutinin epitope (HA)-tagged human ASNS (HA-ASNS), human ASNS cDNA was amplified by PCR with the following primers: 5′-GAAGATCTATGTGTGGCATTTGGGCGCTG-3′ and 5′-GAAGATCTCTAAGCTTTGACAGCTGACTTG-3′, using Human Fetal Brain Marathon-Ready cDNA (Clontech) as a template, and the amplified cDNA was ligated into a pEF-BOS-HA vector.(18) The expression construct was transfected into COS7 cells (ATCC, Manassas, VA) with Lipofectamine 2000 reagent (Life Technologies, Carlsbad, CA), in accordance with the manufacturer's instructions.
Western blot analysis
Cells were harvested and lysed in RIPA buffer (150 mM NaCl, 1% NP-40, 0.1% SDS, 50 mM Tris-HCl (pH 7.9), 0.5% sodium deoxycholate). Proteins in lysate were resolved on sodium dodecyl sulfate-polyacrylamide gel electrophoresis (SDS-PAGE) and blotted onto a nitrocellulose membrane (GE Healthcare, Buckinghamshire, England). Non-specific binding was blocked using Block Ace (Dainippon Sumitomo Pharma, Osaka, Japan), and the blots were probed with primary antibodies. After washing with TBS-T and 10 mM Tris-buffered saline containing 0.05% Tween-20, the blots were incubated with a horseradish peroxidase (HRP)-conjugated goat anti-mouse antibody (Jackson ImmunoResearch Laboratories, West Grove, PA) at a dilution of 1:10,000 and visualized using SuperSignal West Dura Extended Duration Substrate (Thermo Scientific, Waltham, MA). For the detection of the gp64 fusion protein, we used the specific monoclonal antibody to gp64, K7124, which we developed by immunizing with wild-type baculovirus.(17) Anti-HA monoclonal antibody (H9658) was purchased from Sigma-Aldrich. Control IgG (3423, 2AHB12) was purchased from the Institute of Immunology (Tokyo, Japan).
Immunofluorescent staining
The HA-ASNS transfected COS7 cells, which were cultured on the cover glass, were fixed with 4% paraformaldehyde in phosphate-buffered saline (PBS) and permeabilized with 0.1% Triton X-100 in PBS. After blocking with Block Ace, the cells were exposed to the primary antibodies, rabbit anti-HA polyclonal antibody (H6908, Sigma-Aldrich) and mouse anti-ASNS monoclonal antibody (Z5801 or Z5808) at a concentration of 10 μg/mL each. After washing with PBS, a mixture of Alexa Fluor 488 conjugated anti-rabbit IgG (Life Technologies) and Alexa Fluor 647 conjugated anti-mouse IgG (Life Technologies) was used as the secondary antibody (1:200 dilution). The cover glasses were mounted on slide glasses with ProLong Gold Antifade reagent with DAPI (Life Technologies). Images were taken under fluorescence microscopy (Leica DB LB, Leica Microsystems, Wetzlar, Germany).
Flow cytometry
Cells were fixed and permeabilized with IntraStain, a fixation and permeabilization kit for flow cytometry (Dako, Glostrup, Denmark), following the manufacturer's instructions. Along with the permeabilization reagent, the primary antibody was added at a concentration of 3 μg/mL. The cells were then washed with dilution buffer, 1% BSA and 0.1 mM EDTA in PBS, and reacted with R-Phycoerythrin (R-PE) conjugated anti-mouse IgG (Jackson ImmunoResearch Laboratories) diluted to 1:100 with dilution buffer. Finally, cells were washed with dilution buffer twice and analyzed by flow cytometry (GUAVA EasyCyte™ Plus System, Millipore, Billerica, MA).
Sandwich enzyme-linked immunosorbent assay
Cell extracts were prepared as follows. One×107 cells were permeabilized with 0.1 mL of 0.2% saponin in a saline-containing protease inhibitor cocktail (Complete, Roche, Mannheim, Germany) for 15 min at room temperature (RT), and the debris was removed by centrifugation at 20,000 g for 10 min. The supernatant was used as the cell extract. The monoclonal antibody Z5801 was coated on polystyrene 96-well plates (Greiner bio-one, Pforzheim, Germany) at 4 μg/mL in saline. After blocking with Block Ace in saline, cell extracts were applied to each well in an appropriate dilution from 1:20 to 1:160 along with the reaction solution, 0.1% saponin, and 50% Block Ace in saline, and incubated for 2 h at RT. The plate was then washed five times with washing solution, 0.05% Tween-20 in saline, and the biotinylated monoclonal antibody Z5808 was used as the detector antibody at 1 μg/mL in the reaction solution. Biotinylation was performed with EZ-Link Sulfo-NHS-LC-Biotin (Thermo Scientific, Karlsruhe, Germany) in accordance with the manufacturer's instruction. Finally, the plate was washed with washing solution, and then Streptavidin-PolyHRP40 (Stereospecific Detection Technologies, Germany) was added at a dilution of 1:2000 along with the reaction solution. The enzymatic reaction was visualized with TMB Soluble Reagent (ScyTek Laboratories, Logan, UT). After the reaction was stopped with TMB Stop Buffer (ScyTek Laboratories), the absorbance was measured at 450 nm using a microplate reader (Biotrak II, GE Healthcare, Piscataway, NJ).
Results
Generation of monoclonal antibodies against ASNS
The expression of the N-AS and viral gp64 fusion protein was checked by Western blot analysis using the anti-gp64 monoclonal antibody K7124. The antibody recognized a 64 kDa band of the gp64 protein in both the N-AS-BV and wild BV (Fig. 1A), and another protein of approximately 70 kDa, N-AS fused to gp64 (Fig. 1A, upper panel, arrowhead). To raise the anti-ASNS monoclonal antibodies, the budded viruses (N-AS-BV) were immunized to gp64 transgenic mice, and the spleen cells were then fused to the mouse myeloma cell line NS-1. Eight days after fusion, the hybridoma culture supernatants were screened by BV-ELISA and Western blotting against N-AS-BV. Finally, two positive clones, Z5801 and Z5808, were established, which reacted specifically to N-AS and displayed BV on both ELISA and Western blots (Fig. 1B, ELISA data not shown). The isotype of both of the antibodies was identified as IgG2a kappa using a Mouse Typer Sub-Isotyping kit (Bio-Rad, Hercules, CA).
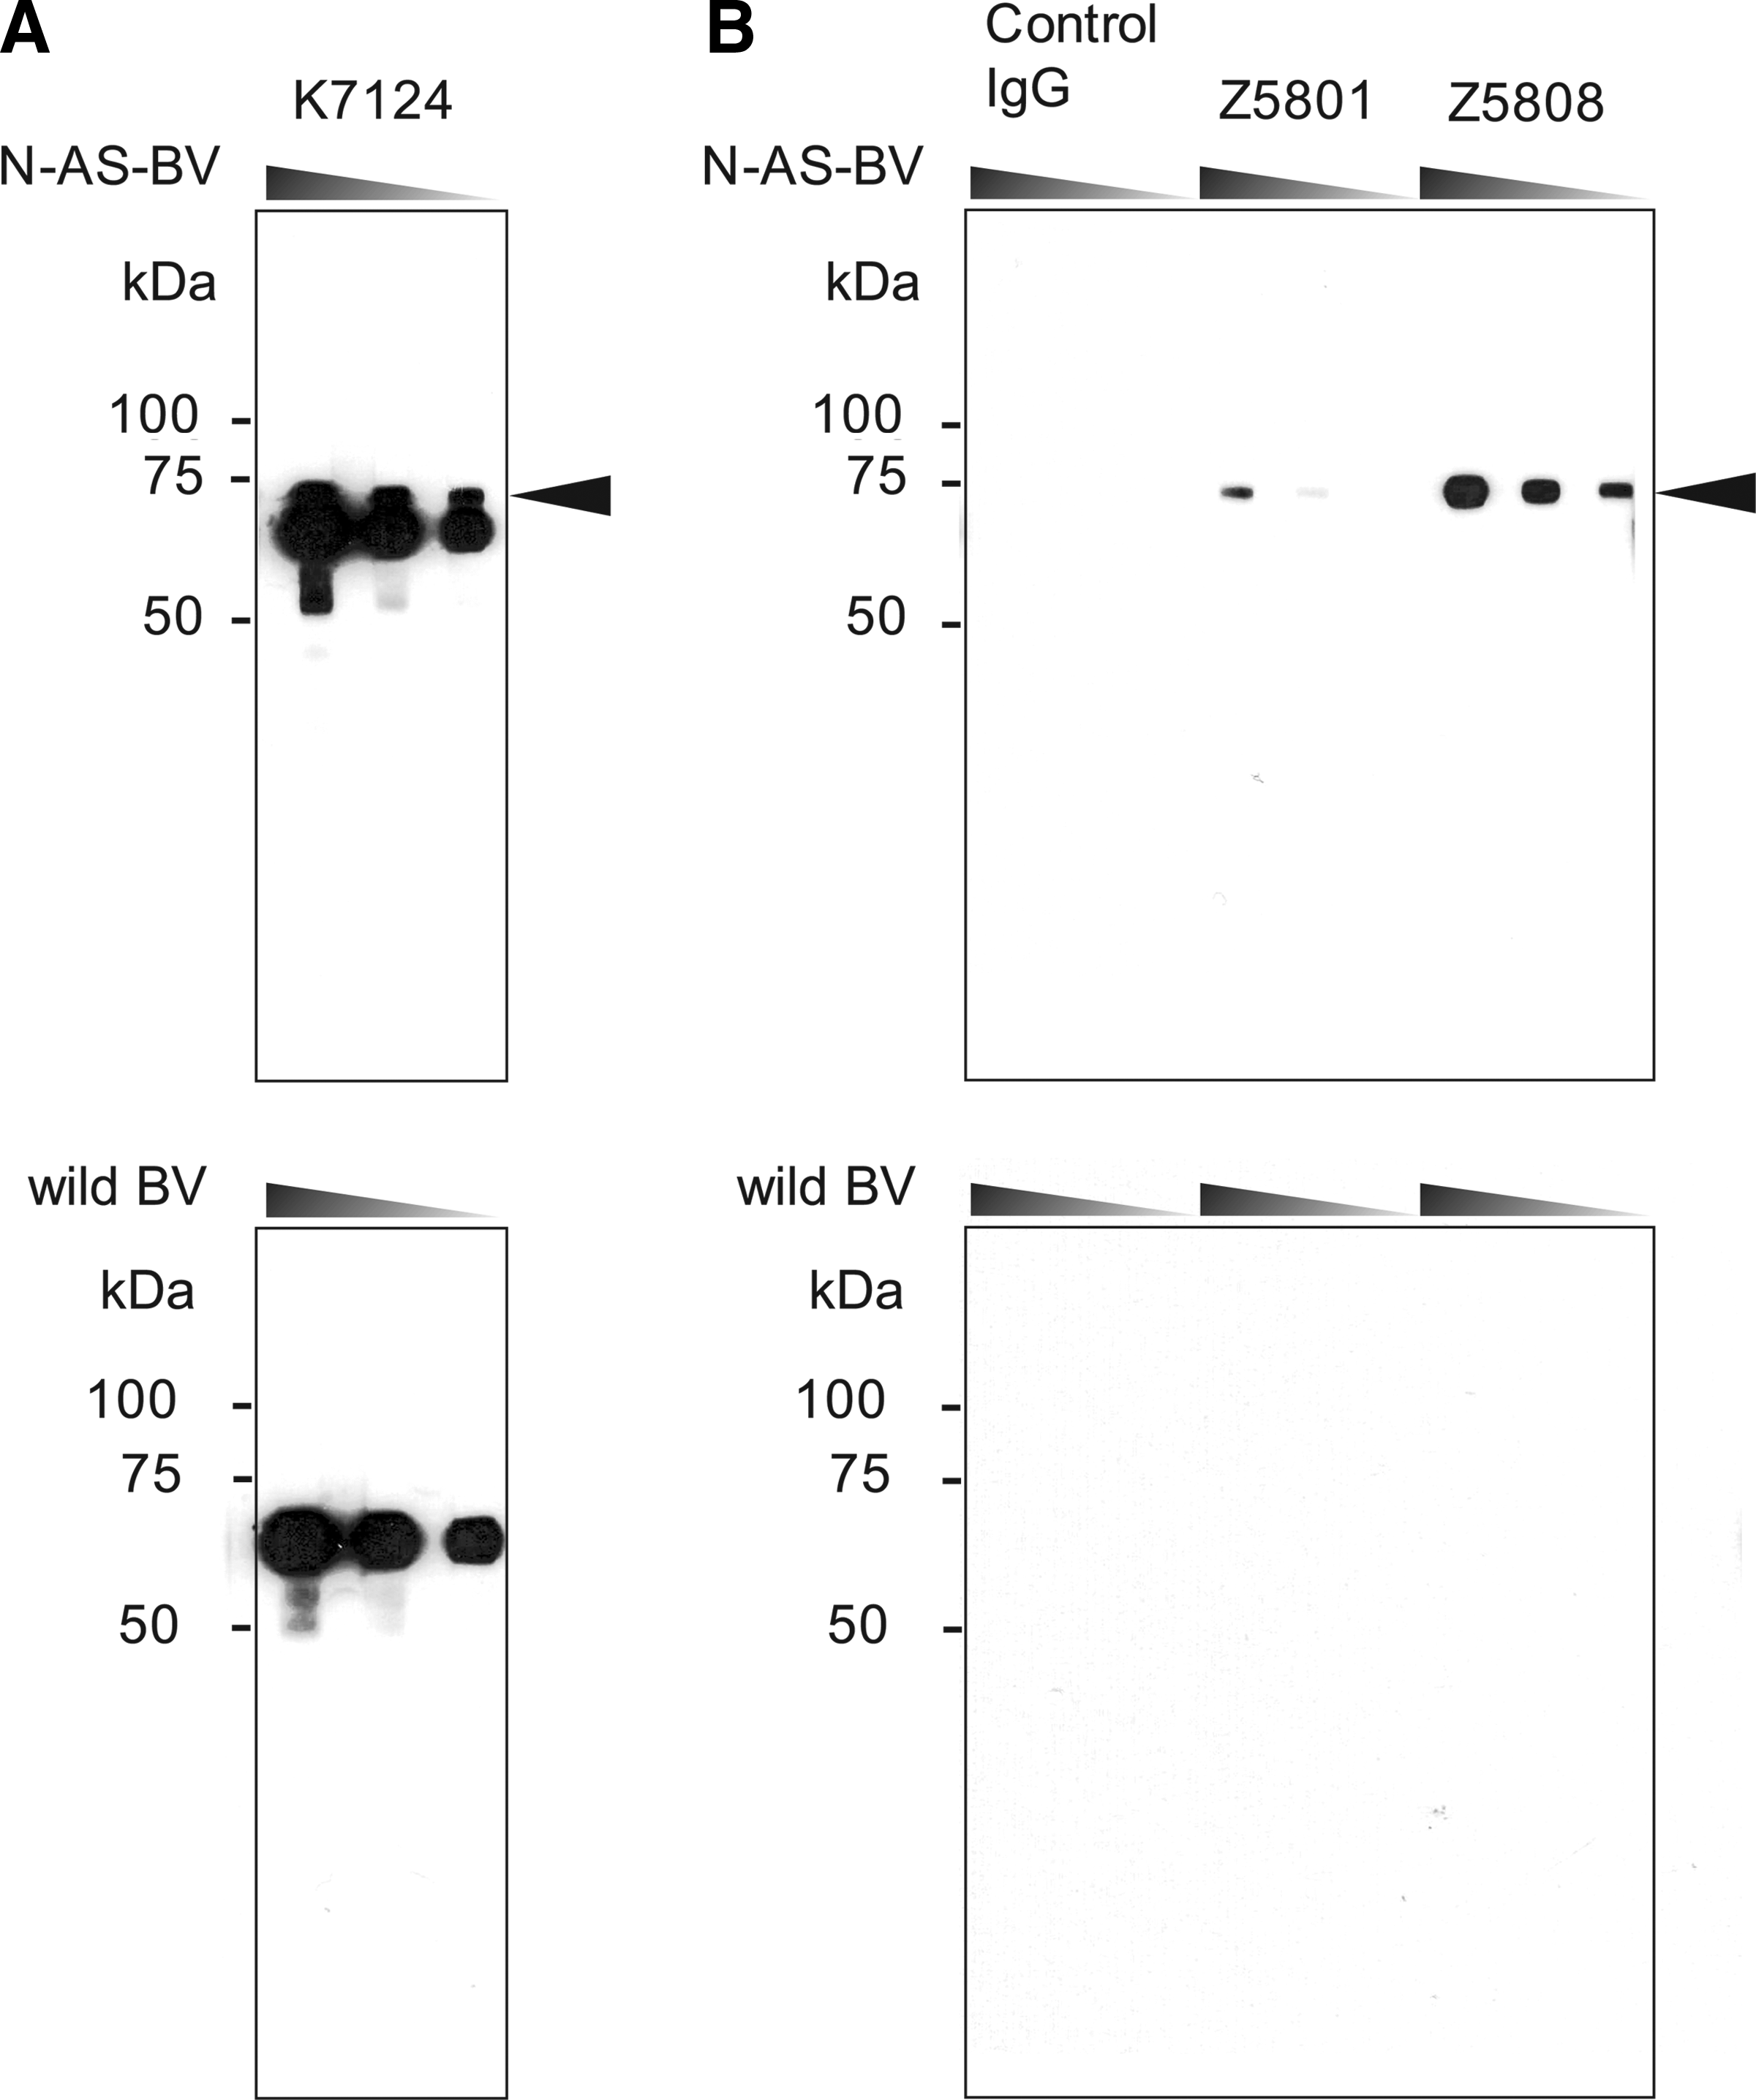
Western blot analysis against N-terminal region of ASNS displayed on budded baculovirus. (
Specificity of monoclonal antibodies against ASNS
The reactivity and specificity of the monoclonal antibodies to full-length ASNS were checked with HA-ASNS overexpressing COS7 cells. Western blot analysis of the cell lysate showed that these monoclonal antibodies only reacted with the same 64 kDa molecular weight band as the anti-HA antibody when the cells were transfected with HA-ASNS cDNA (Fig. 2A). Furthermore, Z5808 recognized endogenous ASNS in K562 cells (Fig. 2B). The reactivity of Z5801 was insufficient for the recognition of endogenous ASNS on Western blotting (data not shown). Upon immunofluorescent staining (Fig. 3), these monoclonal antibodies recognized HA-ASNS expressing cells in the same manner as the anti-HA antibody.
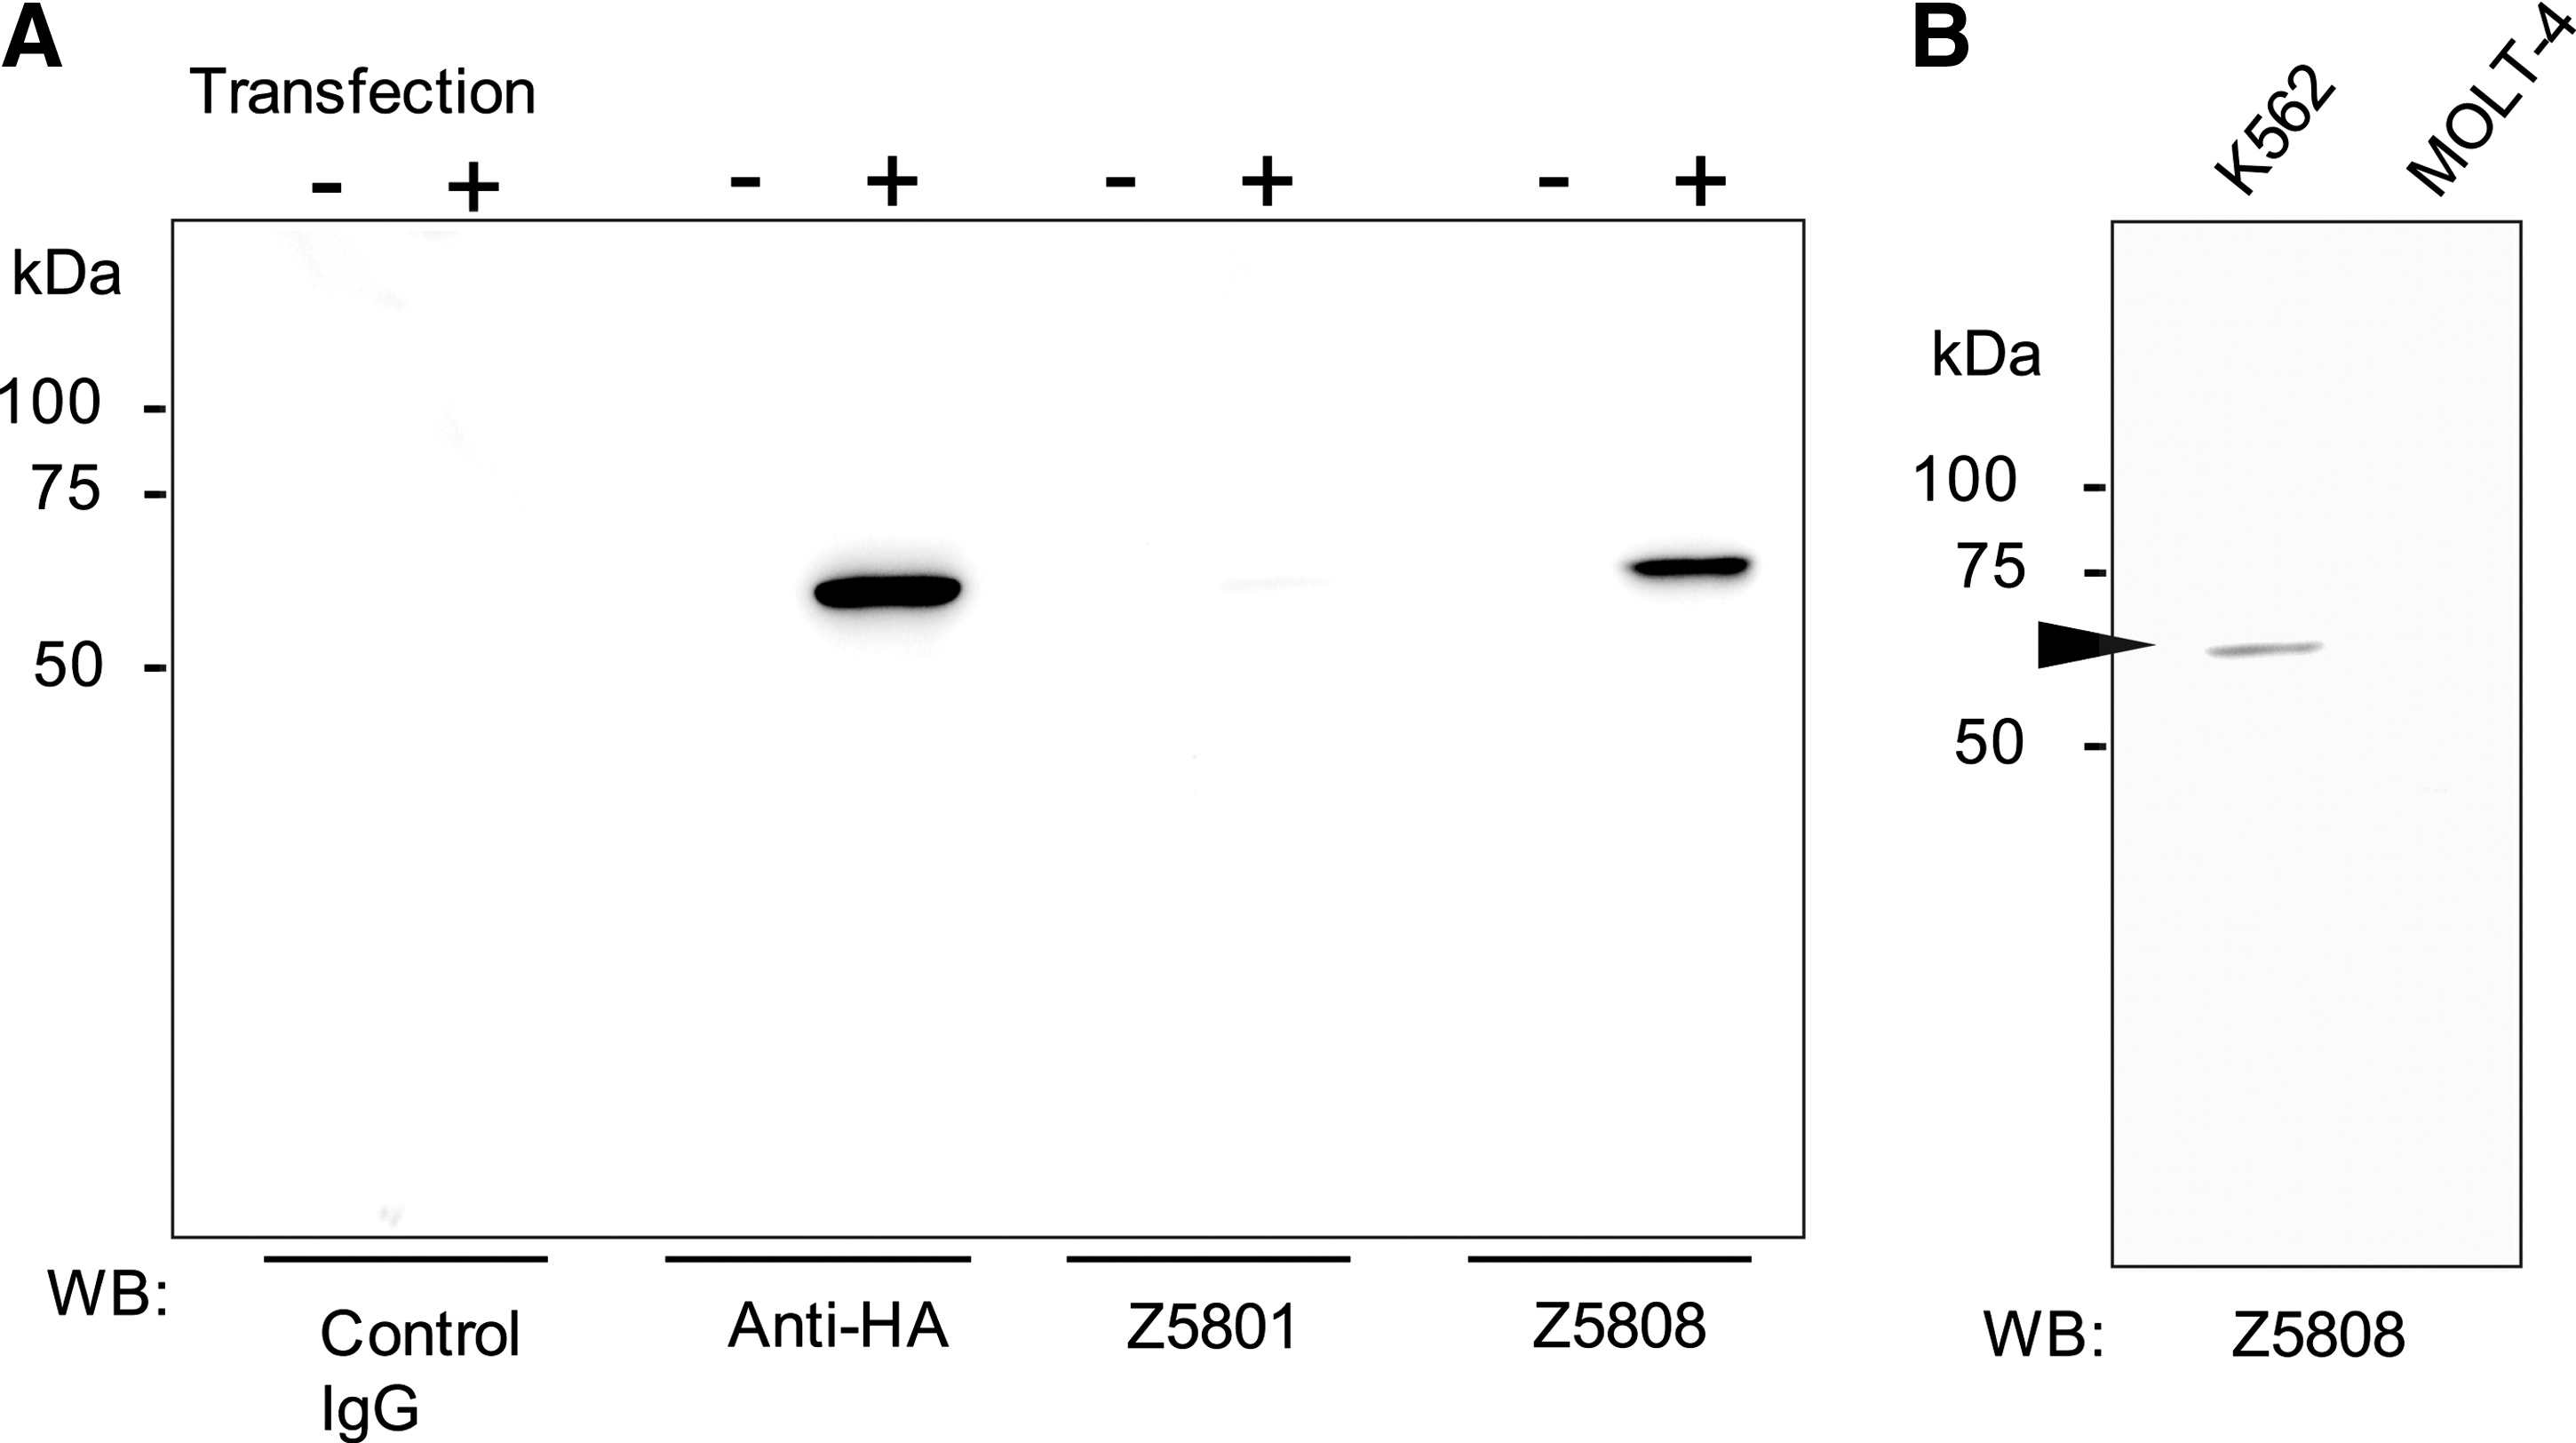
Western blot analysis against full-length ASNS. (
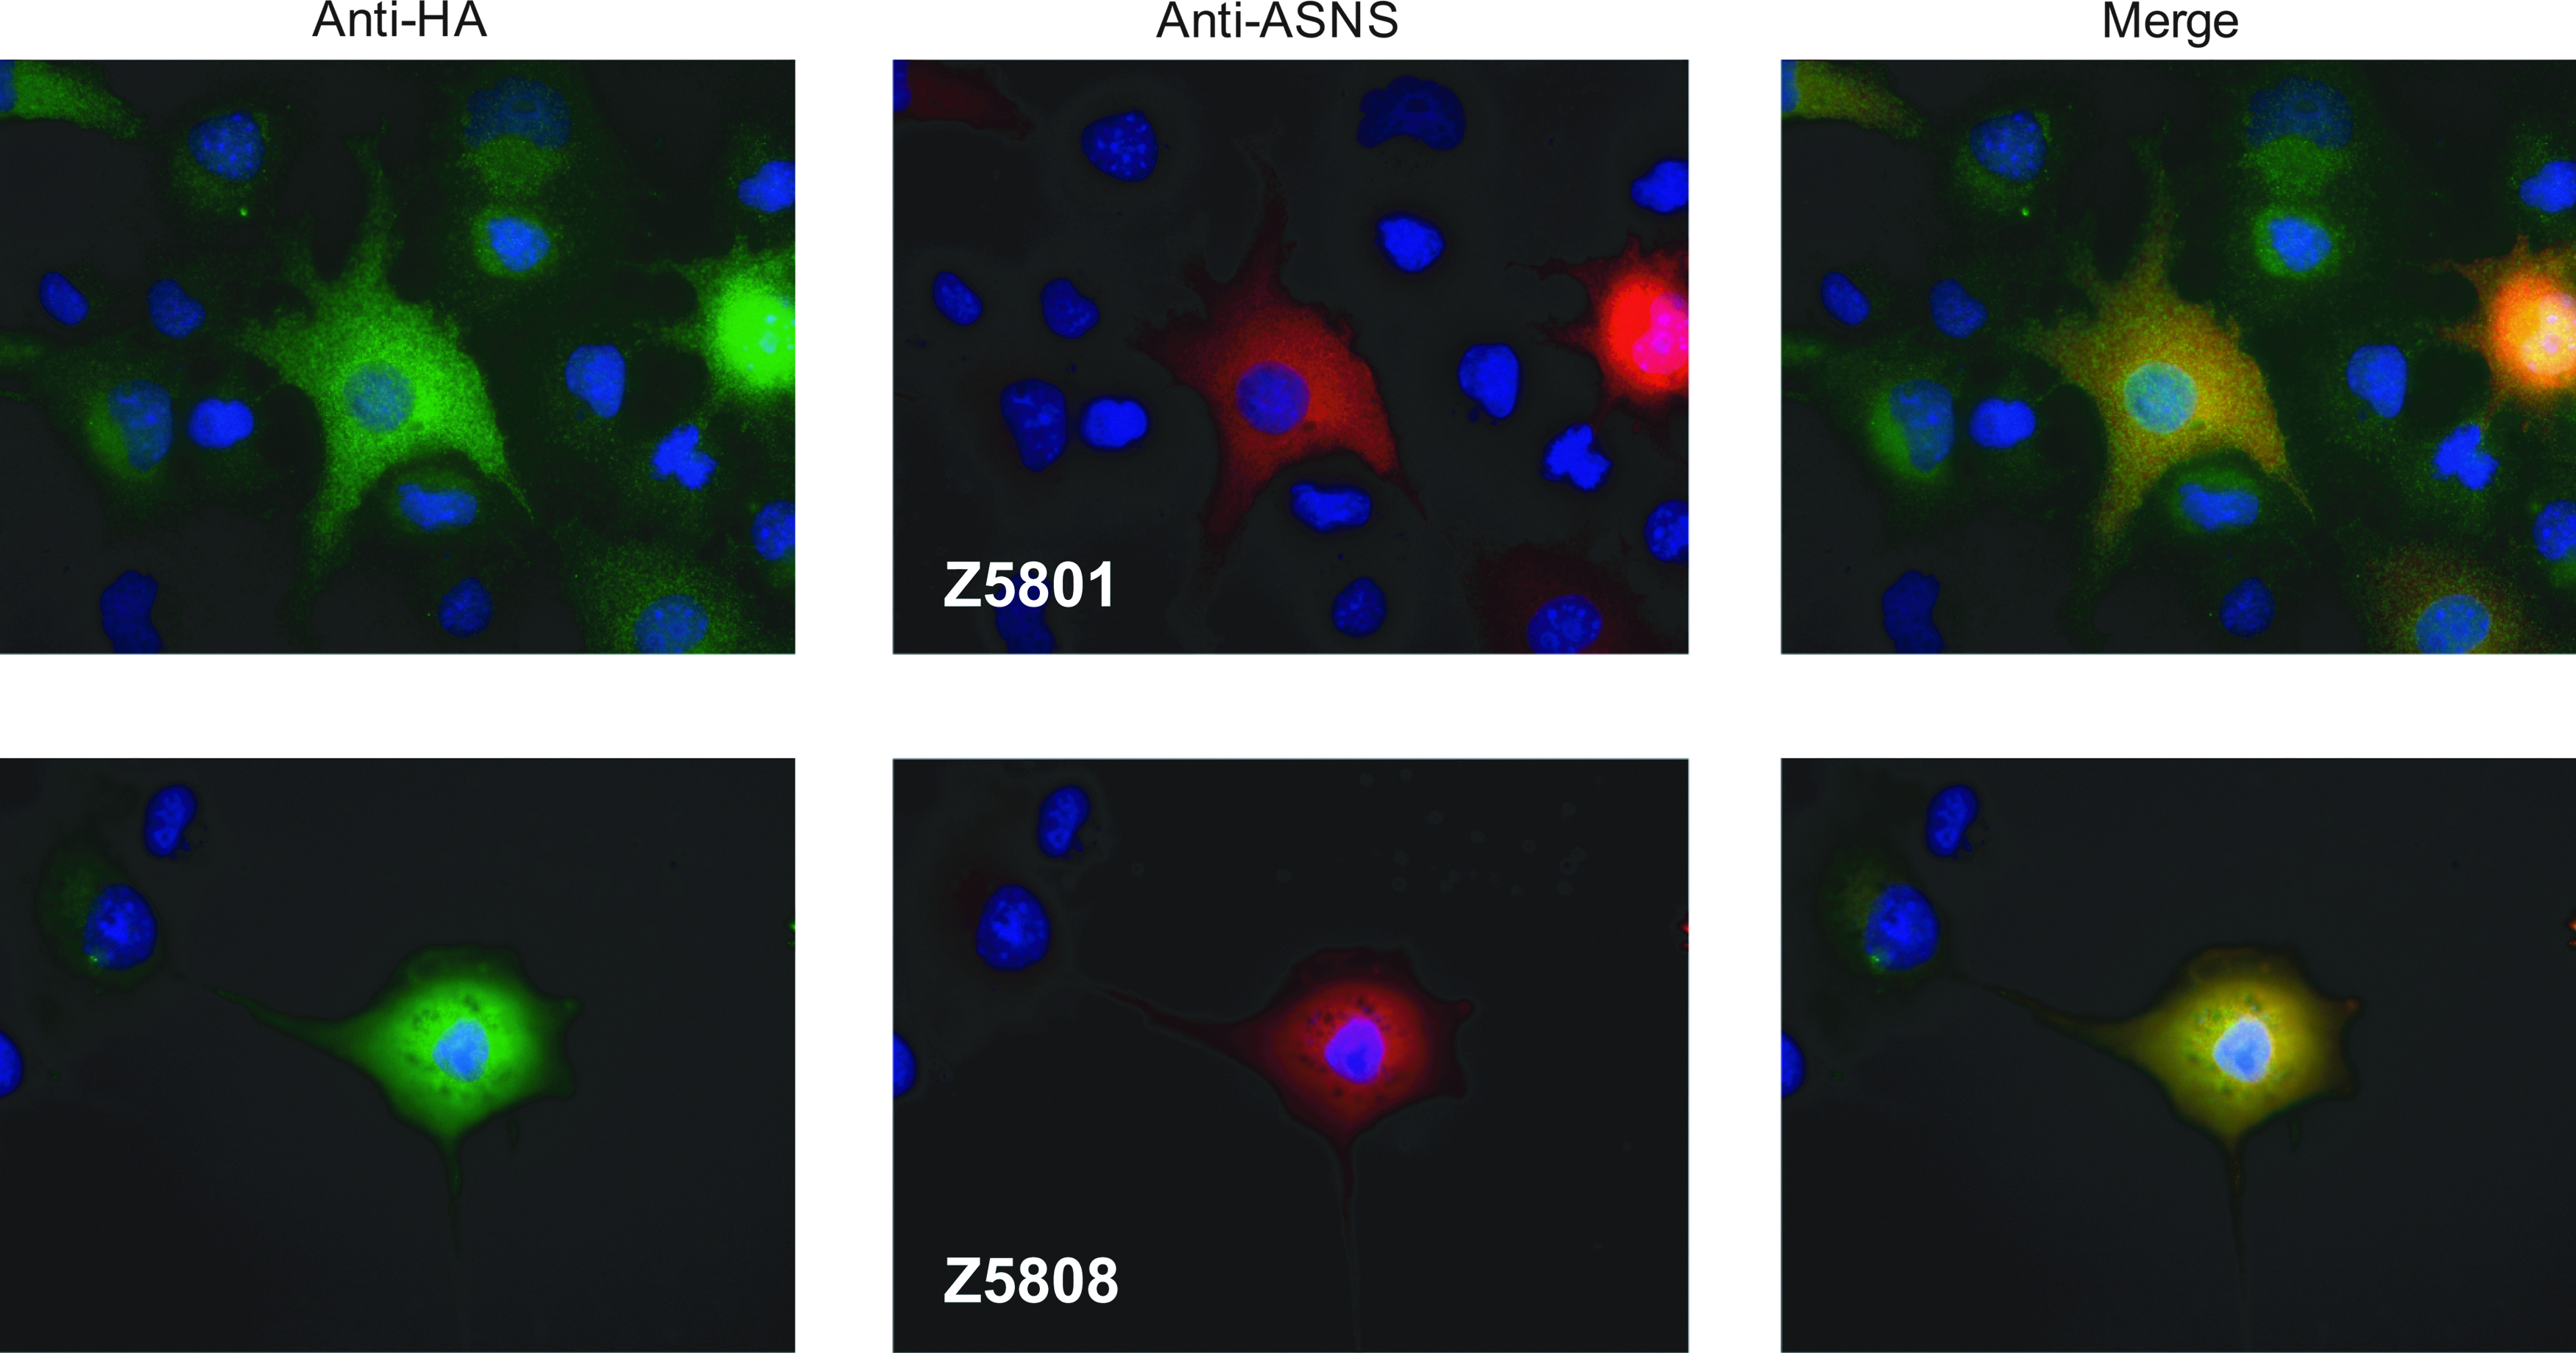
Immunofluorescent staining of HA-ASNS transfected COS7 cells. The cells were exposed to the primary antibodies, rabbit anti-HA polyclonal antibody, and a mouse anti-ASNS monoclonal antibody (Z5801 or Z5808) at a concentration of 10 μg/mL. Green represents the Alexa Fluor 488 fluorescence indicating the HA-ASNS expression, while red represents the Alexa Fluor 647 fluorescence indicating the anti-ASNS reactivity to HA-ASNS, and blue represents the DAPI-stained cell nuclei.
Application of the anti-ASNS monoclonal antibodies to flow cytometry
To check whether the monoclonal antibodies were applicable to flow cytometry, HA-ASNS over-expressing COS7 cells were permeabilized after fixation using a Dako Intrastain kit and stained with anti-HA, Z5801, or Z5808. Both of the anti-ASNS monoclonal antibodies, Z5801 and Z5808, exhibited a specific histogram shift in the same manner as anti-HA (Fig. 4A). Next, to determine whether the monoclonal antibodies recognize endogenous ASNS using flow cytometry, the leukemia cell lines K562 and MOLT-4 were stained and analyzed. The ASNS expression level of each cell line was such that K562 cells were found to be high in ASNS expression, while the level in MOLT-4 cells was very low.(19) Both monoclonal antibodies recognized K562 cells specifically (Fig. 4B) and exhibited a histogram shift. The reactivity of Z5808 was higher than Z5801 on flow cytometric analysis.

Anti-ASNS monoclonal antibodies were applied to flow cytometry. (
Quantification of the ASNS protein by flow cytometry
Flow cytometric quantification was assessed by QIFIKIT (Dako) following the manufacturer's instructions. First, the primary antibody Z5808 was titrated in K562 cells, and its saturating concentration was determined to be 3 μg/mL (data not shown). At this concentration, the mean fluorescence intensity (MFI) was converted to the number of monoclonal antibodies that bound per cell, as shown by using the calibration beads in the QIFIKIT. The six populations of beads were stained with R-PE conjugated anti-mouse IgG in the same manner as the cells (Fig. 5A). In this study, the MFI of the “F” calibration beads was out of range. The MFI for the B, C, D, and E calibration beads was plotted on a log-log scale (Fig. 5B). The calibration curve was fitted by the least squares method, which was used to convert the MFI of a sample into the antibody binding capacity (ABC) per cell. The cells were analyzed with flow cytometry and the ABC was calculated based on the fitted equation of the calibration curve (Fig. 5B). The number of ASNS was estimated to be approximately 5800 molecules per cell in K562, and 40 molecules per cell in MOLT-4 (Table 1).

Calibration curve converting mean fluorescence intensity into antibody binding capacity. (
To quantify the ASNS protein in K562 and MOLT-4, each mean fluorescence intensity (MFI) was estimated at 3 μg/mL of Z5808, subtracting the basal value from the control IgG. Assuming that the number of the ASNS molecules per cell is the same as the antibody binding capacity (ABC) per cell, the ASNS molecules were calculated with the following equation: ASNS molecules per cell=ABC (Z5808) − ABC (control IgG).
The results shown are the mean±SD from three separate experiments. Statistical analysis was performed using Student's t test. The number of ASNS in K562 is significantly different from MOLT-4 (p<0.001). Significance is indicated by an asterisk (*).
Availability for enzyme-linked immunosorbent assay of ASNS
To check the availability for the ELISA of ASNS, the anti-ASNS monoclonal antibody Z5801 was used as the capture antibody and biotinylated Z5808 as the detector antibody. To enhance the assay sensitivity, Streptavidin-PolyHRP40 was used as the detection enzyme. This assay system detected ASNS from K562 in a dose-dependent manner, but not MOLT-4 extracts (Fig. 6).
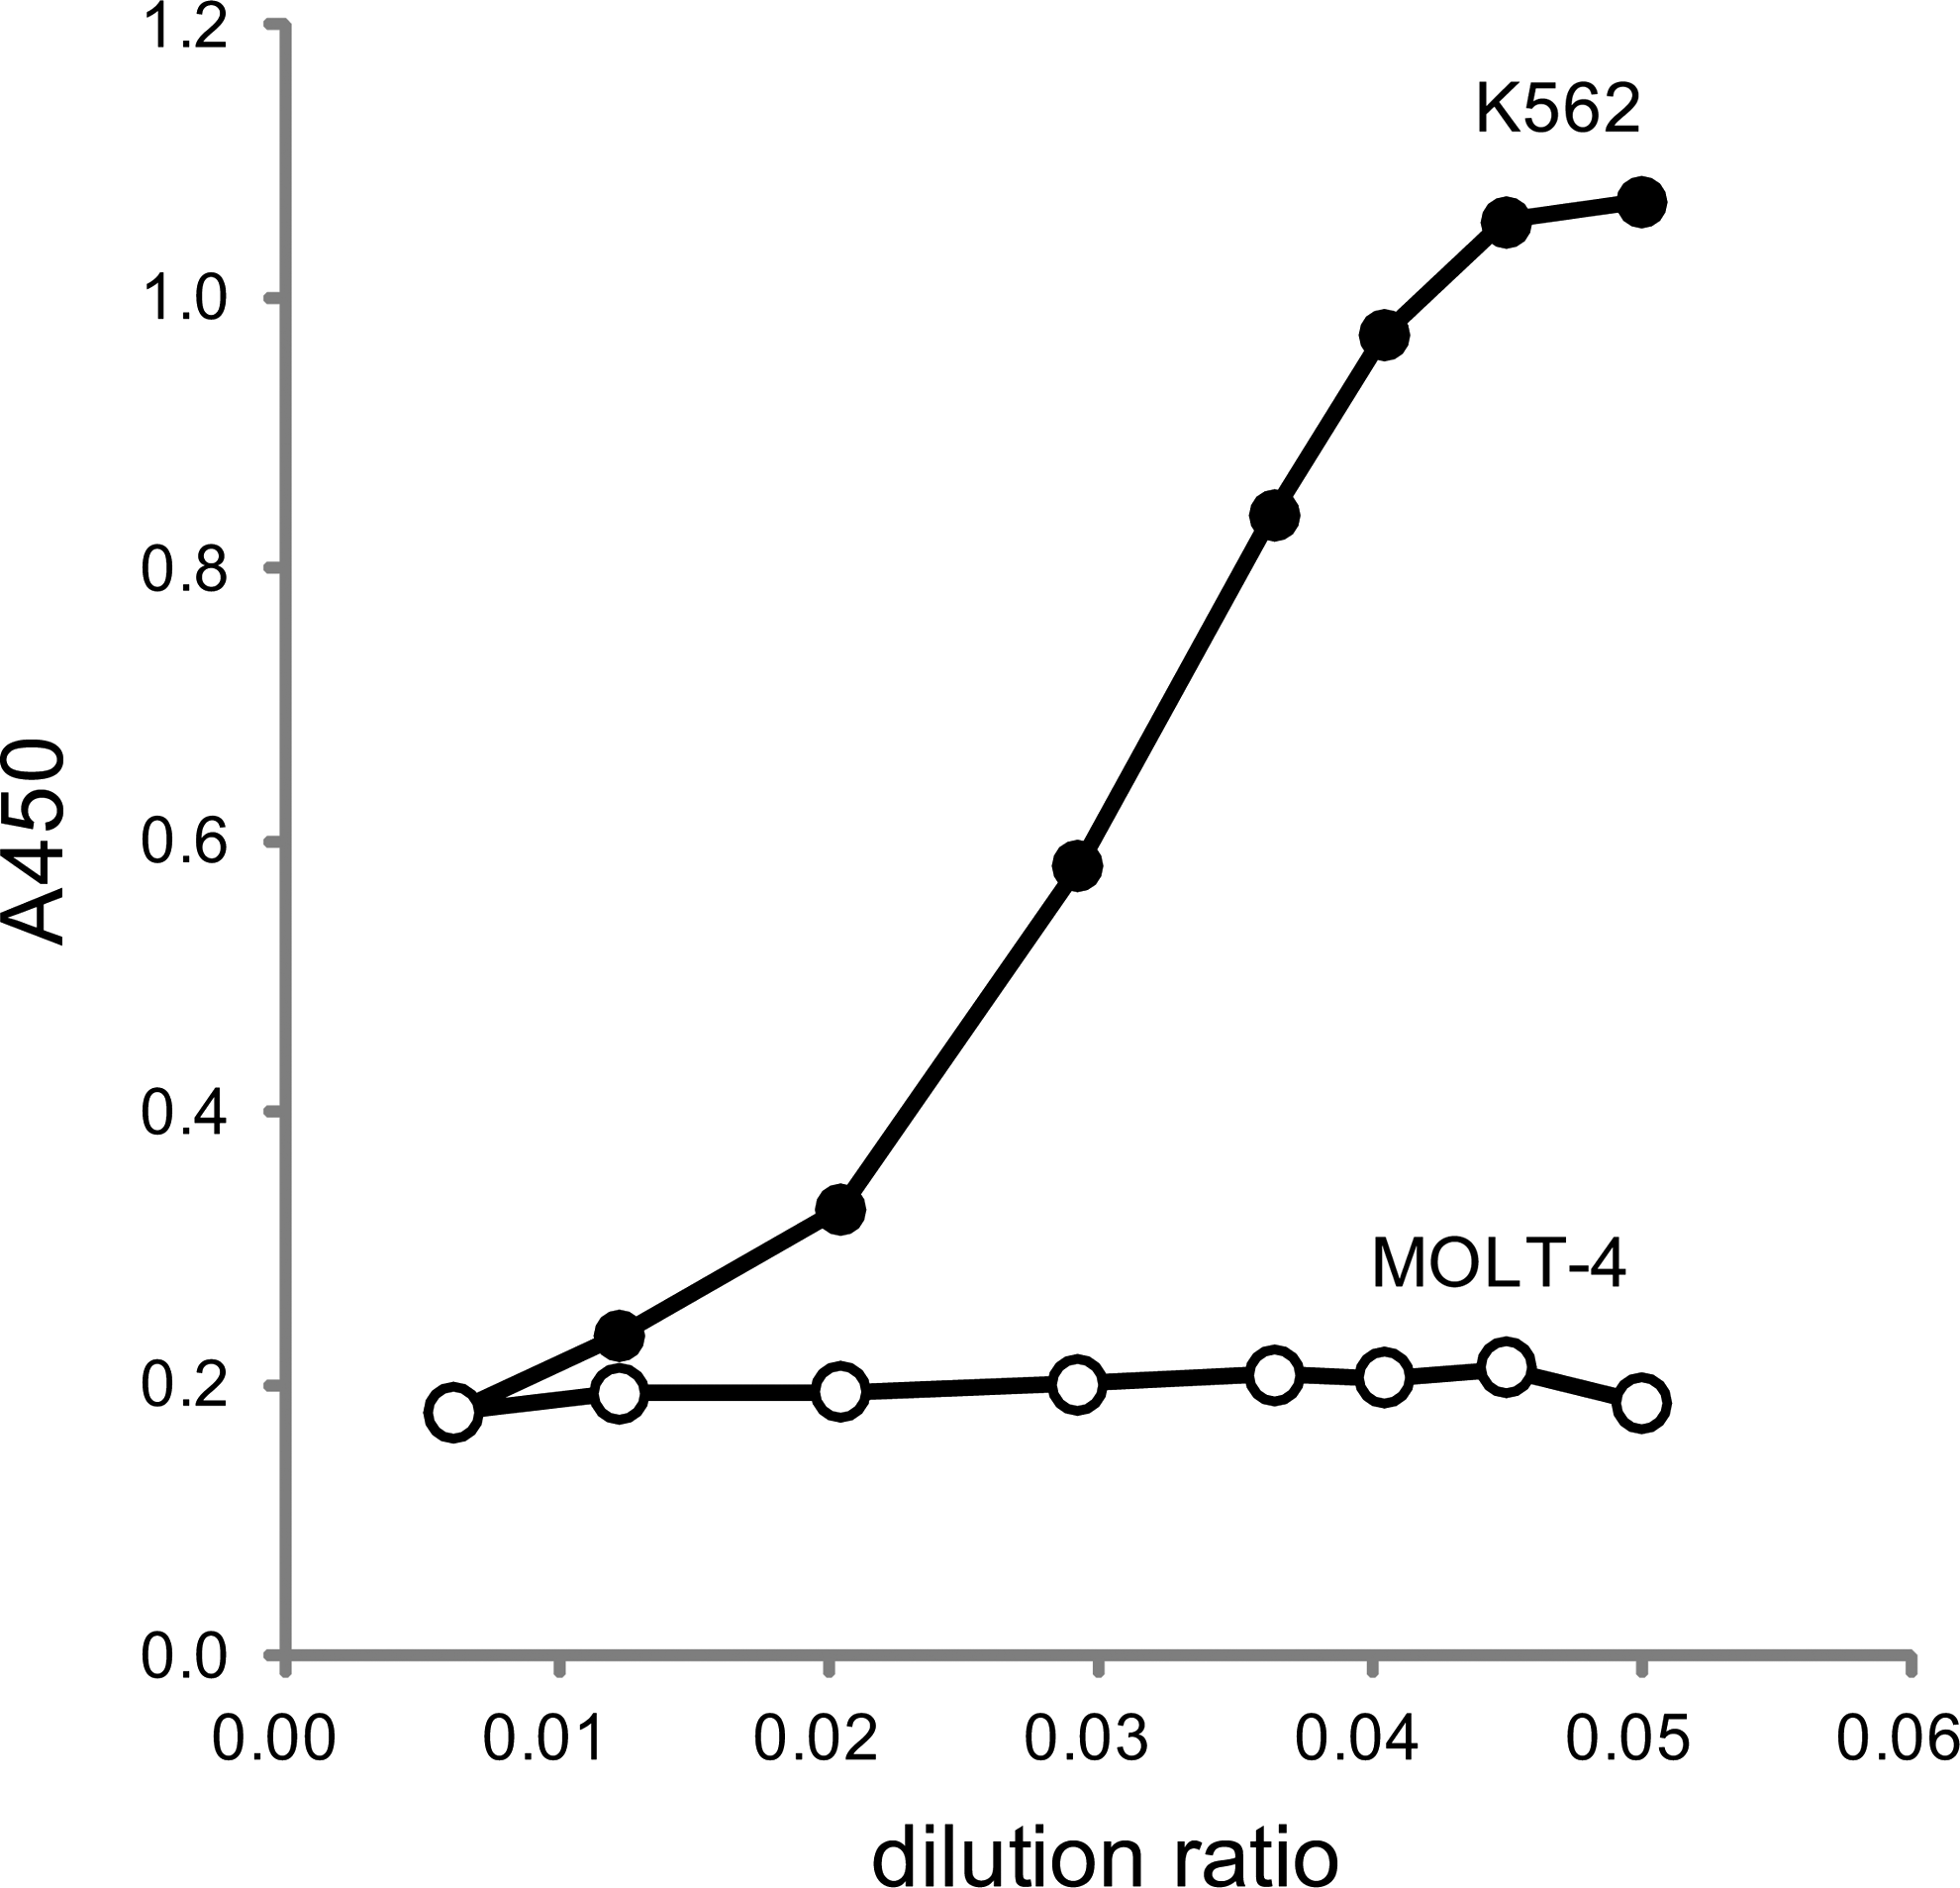
Availability for enzyme-linked immunosorbent assay of ASNS. The closed circle is the reactivity to a diluted series of the extract from K562, and the open circle is the reactivity from MOLT-4. Data represent the mean value in duplicate.
Discussion
Several lines of evidence have shown that determination of the ASNS protein level is critical for evaluation of the efficacy of ASNase treatment.(12,13) Although the mechanism of ASNase-resistance remains to be unveiled, this phenomenon has been correlated with elevated ASNS expression levels in some, but not all, patient subsets.(20,21) In this study, we generated two monoclonal antibodies, which were used in Western blotting, immunofluorescent staining, flow cytometry, and ELISA. Although several studies have reported anti-ASNS antibodies,(7,8,12) a monoclonal antibody applicable to flow cytometric analysis has not been reported thus far. For estimation of the sensitivity to ASNase in clinical diagnosis, quantitative flow cytometric analysis is considered to be highly valuable. It is interesting to note that the flow cytometric quantification found a difference in the relative amounts of ASNS in K562 and MOLT-4 cell lines to be 100:1, approximately the same as that Abbatiello and colleagues reported for the mass spectrometric quantification.(12) Furthermore, we checked to make sure these monoclonal antibodies were applicable to sandwich ELISA. Because a colorimetric ELISA is one of the simple and quick assays in clinical use, establishment of a colorimetric ELISA for ASNS quantification will be important for clinical diagnosis.
The use of a baculovirus protein display system for the generation of monoclonal antibodies has two clearly evident advantages. First, one can avoid the protein purification step, in which it is sometimes difficult to obtain an amount sufficient for immunization, and preparation of the antigen displayed on the baculovirus is simple and easy. Second, the baculovirus itself exerts a potent adjuvant effect, so a high affinity antibody may be readily obtained for the detection of native proteins. The one major drawback of this technique is the powerful antigenic character of the virus itself. We have therefore generated the viral envelope protein gp64, using a transgenic mouse model in order to overcome this disadvantage. The gp64 transgenic mouse exhibits a tolerance for gp64, indicating it has a very low reactivity to this virus.(17)
The monoclonal antibodies generated here have potential efficacy as a new assay tool, which may be used to quantify the ASNS protein with flow cytometry and/or ELISA, and this in turn will help elucidate the correlation between the ASNS protein level and ASNase-resistance.
A new insight has recently emerged with regard to L-asparaginase-resistant leukemia. Mesenchymal cells in the bone marrow serve as a protective niche for leukemic cells by releasing large amounts of asparagine. This extra supply of asparagine helps leukemic cells survive despite ASNase treatment. Leukemic cells that resist L-asparaginase and survive in this protective niche of the bone marrow may be one reason that leukemia recurs in children who have been treated with this drug. The ASNS expression level in mesenchymal cells is therefore key to protecting leukemic cells in the bone marrow from ASNase.(22,23) The histological quantification of ASNS in mesenchymal cells is thus important for evaluating ASNase sensitivity. The anti-ASNS monoclonal antibodies that have been generated are expected to be helpful in studying how mesenchymal cells protect leukemic cells.
Footnotes
Acknowledgments
We thank Dr. Kevin Boru (Pacific Edit, San Francisco, CA) for reviewing the manuscript. We thank Dr. Scheldon M. Schuster (Keck Graduate Institute, Claremont, CA) for helpful discussion. We also thank Mr. Hisahiko Yamashita, Ms. Junko Kumakura, Ms. Rie Aoi, and Ms. Sayuri Kashiwagi for their technical assistance.
This study was supported by the NFAT project of the New Energy and Industrial Technology Development Organization (NEDO) and the Funding Program for World-Leading Innovative R&D on Science and Technology (First Program).
Author Disclosure Statement
The authors have no financial interests to disclose.