
Abstract
Soybean meal (SBM) is commonly used as a livestock feed due to its high protein content (45%) and desirable balance of amino acids. Unfortunately SBM contains several oligosaccharides that are poorly digested or even considered anti-nutritional. Alcohol extraction of SBM is commonly used to remove these carbohydrates and produce soy protein concentrate (SPC), which contains 65% protein. An alternative to alcohol extraction would be to convert the carbohydrates to ethanol that could be recovered as a valuable co-product. In this project we investigate the first step of this process—conversion of oligosaccharides into fermentable sugars—by comparing mixtures, dosages, and operating conditions for several hydrolytic enzymes. The goal was to generate the maximum amount of fermentable sugars so that the residual solids, following subsequent fermentation, would contain comparable protein levels to SPC. Extruded soybean white flakes were hydrolyzed using five different enzyme combinations to identify the enzyme combination that achieved the highest sugar recovery. Dosages of the oligosaccharide-degrading enzyme Novozyme 960 and the cellulose-degrading enzyme Cellic CTec were then varied to identify the best dosage based on effectiveness and usage rates. The influence of hydrolysis temperature (50°C or 55°C) was then evaluated. After these variables had been optimized, extruded white flake (extrusion at 50°C, 75 rpm, and 15% wb moisture) was hydrolyzed with Novozyme 960 (0.5 inulinase units (INU)/g), Cellic CTec (6% based on cellulose), and Cellic HTec (0.3% of total solids) at 55°C. The resultant residue was analyzed for protein content and then subjected to double ethanol washing to remove sugars. Sugar recovery was 4 times higher than that of non-treated white flake, and the protein content increased from 46% to 69%, which would increase the value of the product by at least $0.375/kg.
Introduction
To increase protein content, SBM can be subsequently extracted with alcohol to remove sugars and oligosaccharides. This results in the production of soy protein concentrate (SPC), which contains up to 65% protein. After ethanol recovery the extracted carbohydrates are evaporated to a syrup or molasses. A simpler alternative could be to ferment these sugars to ethanol in SBM-water slurry. Church and Meyers found that Pichia guilliermondii produced the α-galactosidase necessary to metabolize raffinose and stachyose, and Sugimoto used yeast to metabolize sugars in soybean solubles. 1,2 Following fermentation, the ethanol would be recovered by distillation, and the solids separated by centrifugation. Assuming similar sugar removal, this fermented SBM should have higher protein content than SPC due to the presence of yeast protein.
To our knowledge, no studies have been reported concerning the conversion of soybean carbohydrates into ethanol. Before this conversion can take place, it is first necessary to hydrolyze the oligosaccharides into simple sugars. Soybeans contain a small amount of cellulose and hemicellulose, along with oligosaccharides such as stachyose and raffinose. Extrusion pretreatment has been evaluated as a method to open the structure of SBM and increase digestibility of these polysaccharides. Karki et al reported that the disruption of the cellular integrity of cotyledon cells by flaking or extrusion as a pretreatment increased the access of saccharification enzymes to their substrates. 3
Each of the polysaccharides in soybeans requires a unique enzyme for hydrolysis, and these enzymes are costly. Overdosing enzymes will result in high operating costs, whereas insufficient dosages would incompletely hydrolyze the carbohydrate polymers. Thus, determining the optimum enzyme combination, dosages, and operating conditions is critical. The current study seeks to determine the enzyme combination (Novozyme 960, Celluclast 1.5L, Novozyme 188, Cellic CTec, and Cellic HTec) and dosage for optimal sugar recovery and the hydrolysis temperature at which this enzyme combination results in the highest sugar recovery.
Materials and Methods
WHITE FLAKES
White flakes were obtained from South Dakota Soybean Processors (Volga, SD) and stored at room temperature until use. Moisture, protein, fat, sugar, and ash content were determined following standard Association of Analytical Communities (AOAC, Gaithersburg, MD) methods. 4
EXTRUSION PRETREATMENT
Extrusion of white flakes was carried out using a Plasti-corder PL2000 lab-scale single-screw extruder, (C.W. Brabender Instruments, South Hackensack, NJ) equipped with a computer control and data acquisition system. The extruder has a length-to-diameter ratio of 20:1, a screw with a compression ratio of 3:1, and a 7.5-hp motor. The extruder barrel had provisions to control the temperature of the feed and transition zone in both the barrel and die sections via air cooling. The temperature of the transition and die sections was maintained at 50°C, the screw speed was set at 75 rpm, and white flakes at 15% moisture (wb) were manually fed through a hopper to keep the screws filled and avoid accumulation of material in the hopper. We had previously determined these conditions to be optimal for white flake extrusion. 5 The collected extrudates were stored in polyethylene bags in a freezer until use in the enzymatic hydrolysis study.
ENZYMES
The enzymes used in this study, gifts from Novozymes (Bagsvaerd, Denmark), were refrigerated until use. The functions and activity of the enzymes used for hydrolysis are listed in Table 1 .
Activity, Function, and Recommended Dosages of Enzymes Used in This Study
One inulinase unit (INU) is the amount of enzyme that produces 1 μmol of reducing carbohydrate (calculated as glucose) per minute under the given analytical conditions.
The endo-glucanase unit (EGU) and the fungal xylanase unit (FXU-S) are measured relative to their corresponding Novozyme enzyme standards.
One filter paper unit (FPU) is the amount of enzyme required to produce reducing sugar equivalent to 2.0 mg of glucose when assayed according to the standard FPU method.
One cellobiohydrose unit (CBU) is defined as the amount of enzyme that releases 2 μmol glucose/min under standard conditions with cellobiose as substrate.
g enzyme/g cellulose.
OPTIMAL ENZYME COMBINATIONS
Five combinations of enzymes were tested at the mid-value of their recommended dosages to determine which worked better to hydrolyze white flakes. For ease of notation, these enzyme combinations were coded ( Table 2). The hydrolysis was done at 150 rpm for 72 h in an incubator shaker (Model 420 Forma Orbital Shaker, Thermo Fisher Scientific, Marietta, OH). Each hydrolysis trial was conducted in triplicate in stoppered, 500-mL conical flasks containing 300 mL of slurry that contained 10% w/v solids loading rate of white flakes in 0.1 M, pH 4.8 sodium citrate buffer, with appropriate enzymes.
Enzyme Combinations Used in This Study
INU=inulinase unit
OPTIMAL ENZYME DOSAGES
White flakes have considerable amounts of oligosaccharides, and the dosage of Novozyme 960 enzyme is important for converting them into mono- and disaccharides. Hence, conversion was tested at three different dose levels [0.1, 0.3, and 0.5 inulinase units (INU)/g dry matter (DM)]. Similarly, in another study, Cellic CTec was also varied from 3–15% w/w (3, 6, 9, 12, and 15%). Hydrolysis trials were conducted as described above.
OPTIMAL HYDROLYSIS TEMPERATURE
Novozyme 960 and Cellic CTec enzymes have different optimal hydrolysis temperatures of 50°C and 55°C, respectively. To determine the optimal temperature for simultaneous activity of the two enzymes, hydrolysis trials were conducted at 50°C and 55°C under the conditions described previously.
PROTEIN ENHANCEMENT
Extrusion pretreated white flakes were subjected to enzymatic hydrolysis at the identified optimum conditions to maximize oligosaccharide saccharification. Hydrolysis trials were conducted in 500-mL flasks with 10% w/v solids loading in a working volume of 300 mL made up of 0.1 M, pH 4.8 sodium citrate buffer (sodium azide was added as an anti-microbial agent), and optimum enzyme dose for 72 h at 150 rpm and 55°C. A solids loading of 10% was used because it allowed adequate mixing. The protein in white flakes is very hydroscopic, and at higher solids loading rates viscosity becomes a limiting factor. The hydrolyzed mash was processed via two methods to remove sugars, as a model for eventual sugar removal via fermentation. Fig. 1 shows these two protocols. The protein content of the solids was analyzed after each step following the AOAC method.
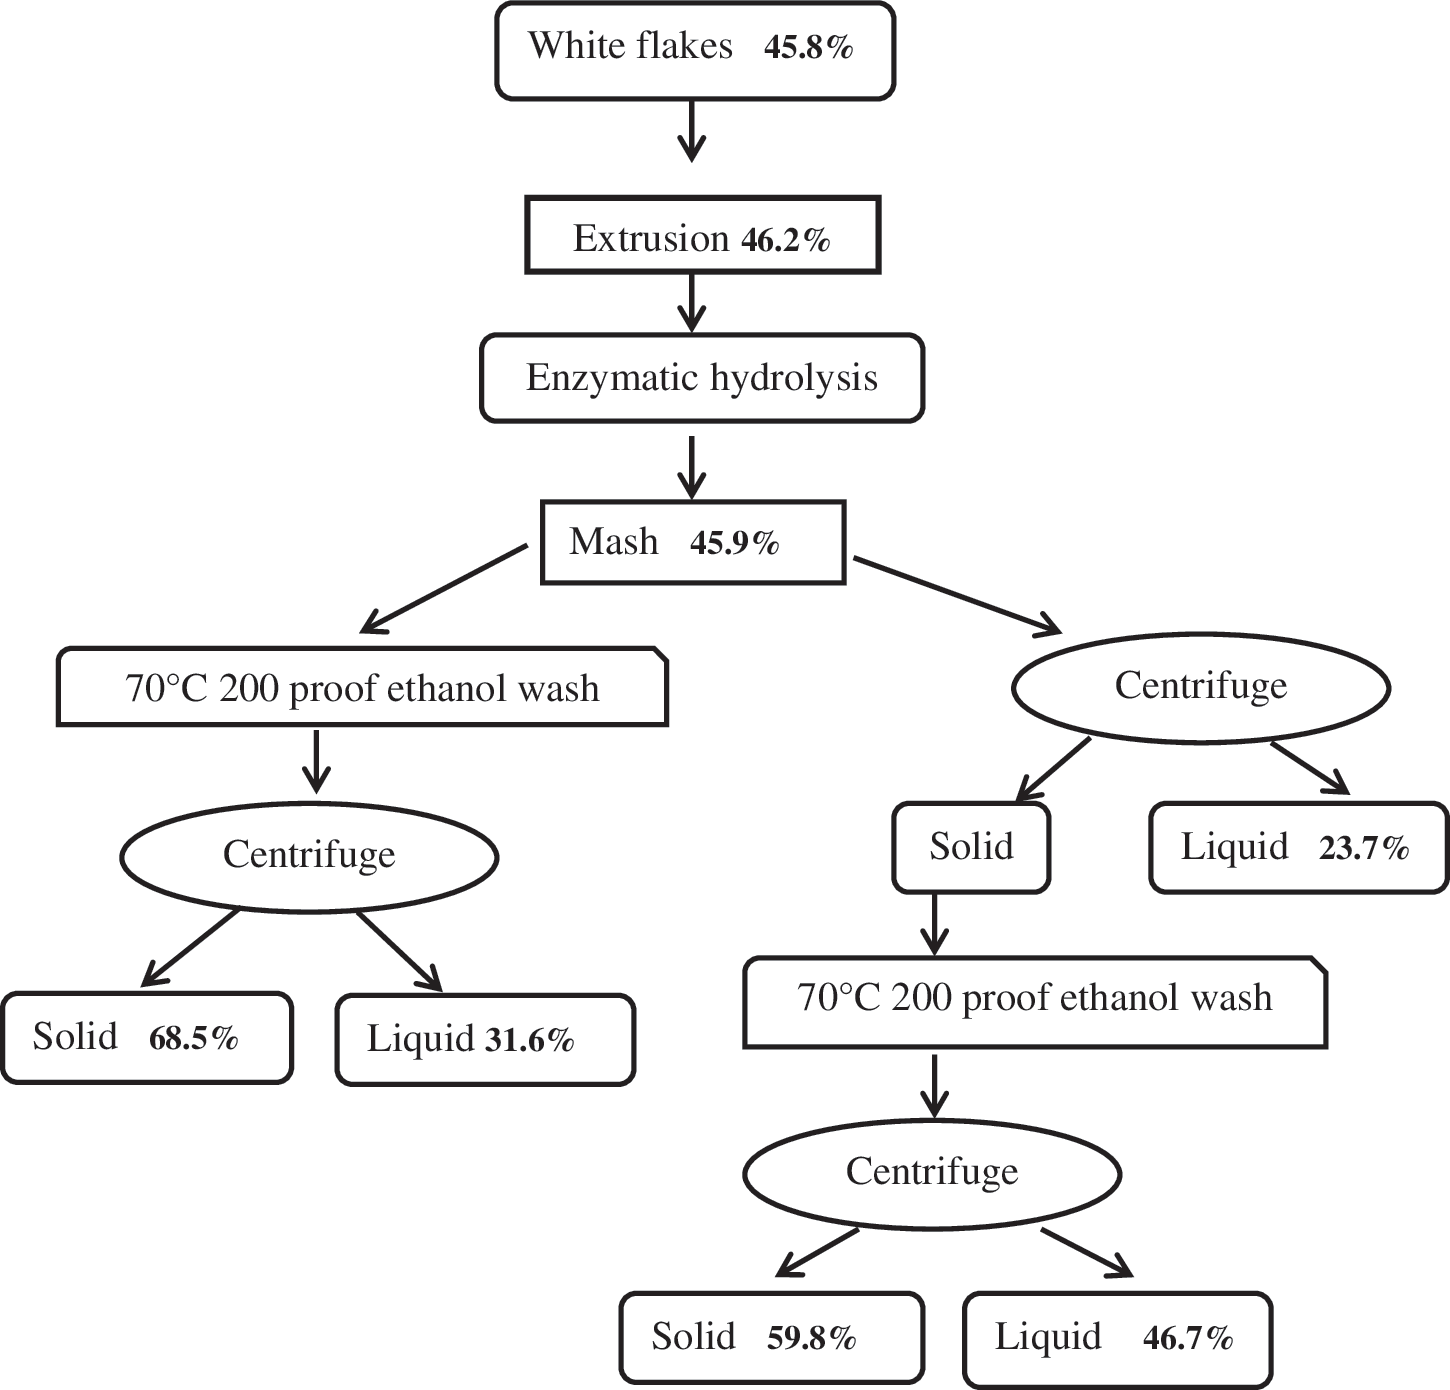
Flow diagram showing sample preparation and protein content on dry matter basis.
ANALYTICAL PROCEDURES
Samples (1.5 mL) were aseptically removed from saccharification trials at 0, 12, 24, 48, and 72 h, placed in boiling water for 10 min to inactivate enzymes, and then centrifuged at 13,000 rpm for 15 min. Supernatants were frozen and thawed twice to obtain clear supernatant that was then transferred into autosampler vials. A size-exclusion chromatography column (Water's SugarPak I column with pre-column module, Waters Corporation, Milford, MA) and high-performance liquid chromatography (HPLC, Agilent Technologies, Santa Clara, CA) were used for sugar quantification. The SugarPak I column was operated at 80°C, and the sugars were eluted with HPLC-grade deionized water at a flow rate of 0.5 mL/min. Peaks from the refractive index detector were identified and quantified by comparing them to the retention times of known standards. Stachyose, raffinose, sucrose, glucose, xylose+galatose+mannose, and arabinoise+fructose had retention times of 6.8, 7.2, 8.3, 9.9, 10.6, and 12.7 min, respectively.
STATISTICAL ANALYSIS
The protein content of white flakes at the end of each process was statistically analyzed using Statistical Analysis Software (SAS) 9.2 (SAS, Cary, NC).
Results and Discussion
COMPOSITION OF WHITE FLAKES
White flakes used in this study had the following composition: 1.2% arabinose, 0.2% xylose, 0.3% mannose, 8.6% sucrose, 0.1% glucose, 0.1% fructose, 0.1% galactose, 0.8% raffinose, and 4.8% stachyose. The total carbohydrate content was 16.5%, including oligosaccharides and cellulose. In general, SBM and white flakes have similar composition, and the carbohydrate levels in the white flakes used in this study were well within the range reported for SBM by Irish and Balnave, Bach Knudesen, and Grieshop et al., although higher than that reported by Parsons et al. 5 –9 According to Hartwig et al., sugar content in soybean was negatively correlated with protein content. 10 Oligosaccharide content varies with the type of soybean (high oil/protein) and year of cultivation. In 1991 and 1992, the oligosaccharide (stachyose+raffinose+sucrose) content of high oil soybeans was 9.7% and 10.3%, respectively, while high protein soybeans contained 8.9% and 8.6% oligosaccharides, respectively. White flakes used in this study had protein and oligosaccharide contents of 45.8% and 14.2%, respectively. Although the carbohydrate levels in soybeans and white flakes are relatively low, there is potential to convert them into ethanol, and thereby increase the protein content in the solid fraction.
EFFECT OF ENZYME COMBINATIONS ON SUGAR RECOVERY
Fig. 2 shows the effect of various enzyme combinations on carbohydrate levels as a function of hydrolysis time. Among the enzyme combinations tested, Enz 2 and Enz 5 performed well and similarly to each other. Enz 2 contained Celluclast 1.5L, Novozyme 188, and Novozyme 960, while Enz 5 contained Cellic CTec, Cellic HTec, and Novozyme 960. For both of these enzyme combinations, the concentration of stachyose decreased rapidly, with no stachyose detected after 24 h. This was likely due to its complete hydrolysis into monomers such as glucose, fructose, and galactose in the presence of an adequate dosage of Novozyme 960. Enz 4 contained only Novozyme 960, and stachyose was not detected after 48 h. Thus, it appears that the presence of cellulolytic enzymes in treatments Enz 2 and Enz 5 opened the matrix to allow more rapid activity of Novozyme 960. The concentration of raffinose was too low to be detected (data not shown), and this result was expected since white flakes contain low levels of raffinose. The concentration of glucose generally increased throughout saccharification due to hydrolysis of oligosaccharides. Sucrose concentrations rapidly spiked as the matrix was opened to solubilize bound sucrose, but then gradually fell. We assume that the enzyme cocktails may have trace amounts of invertase activity or cross-reactivity enabling hydrolysis of sucrose into glucose and fructose.
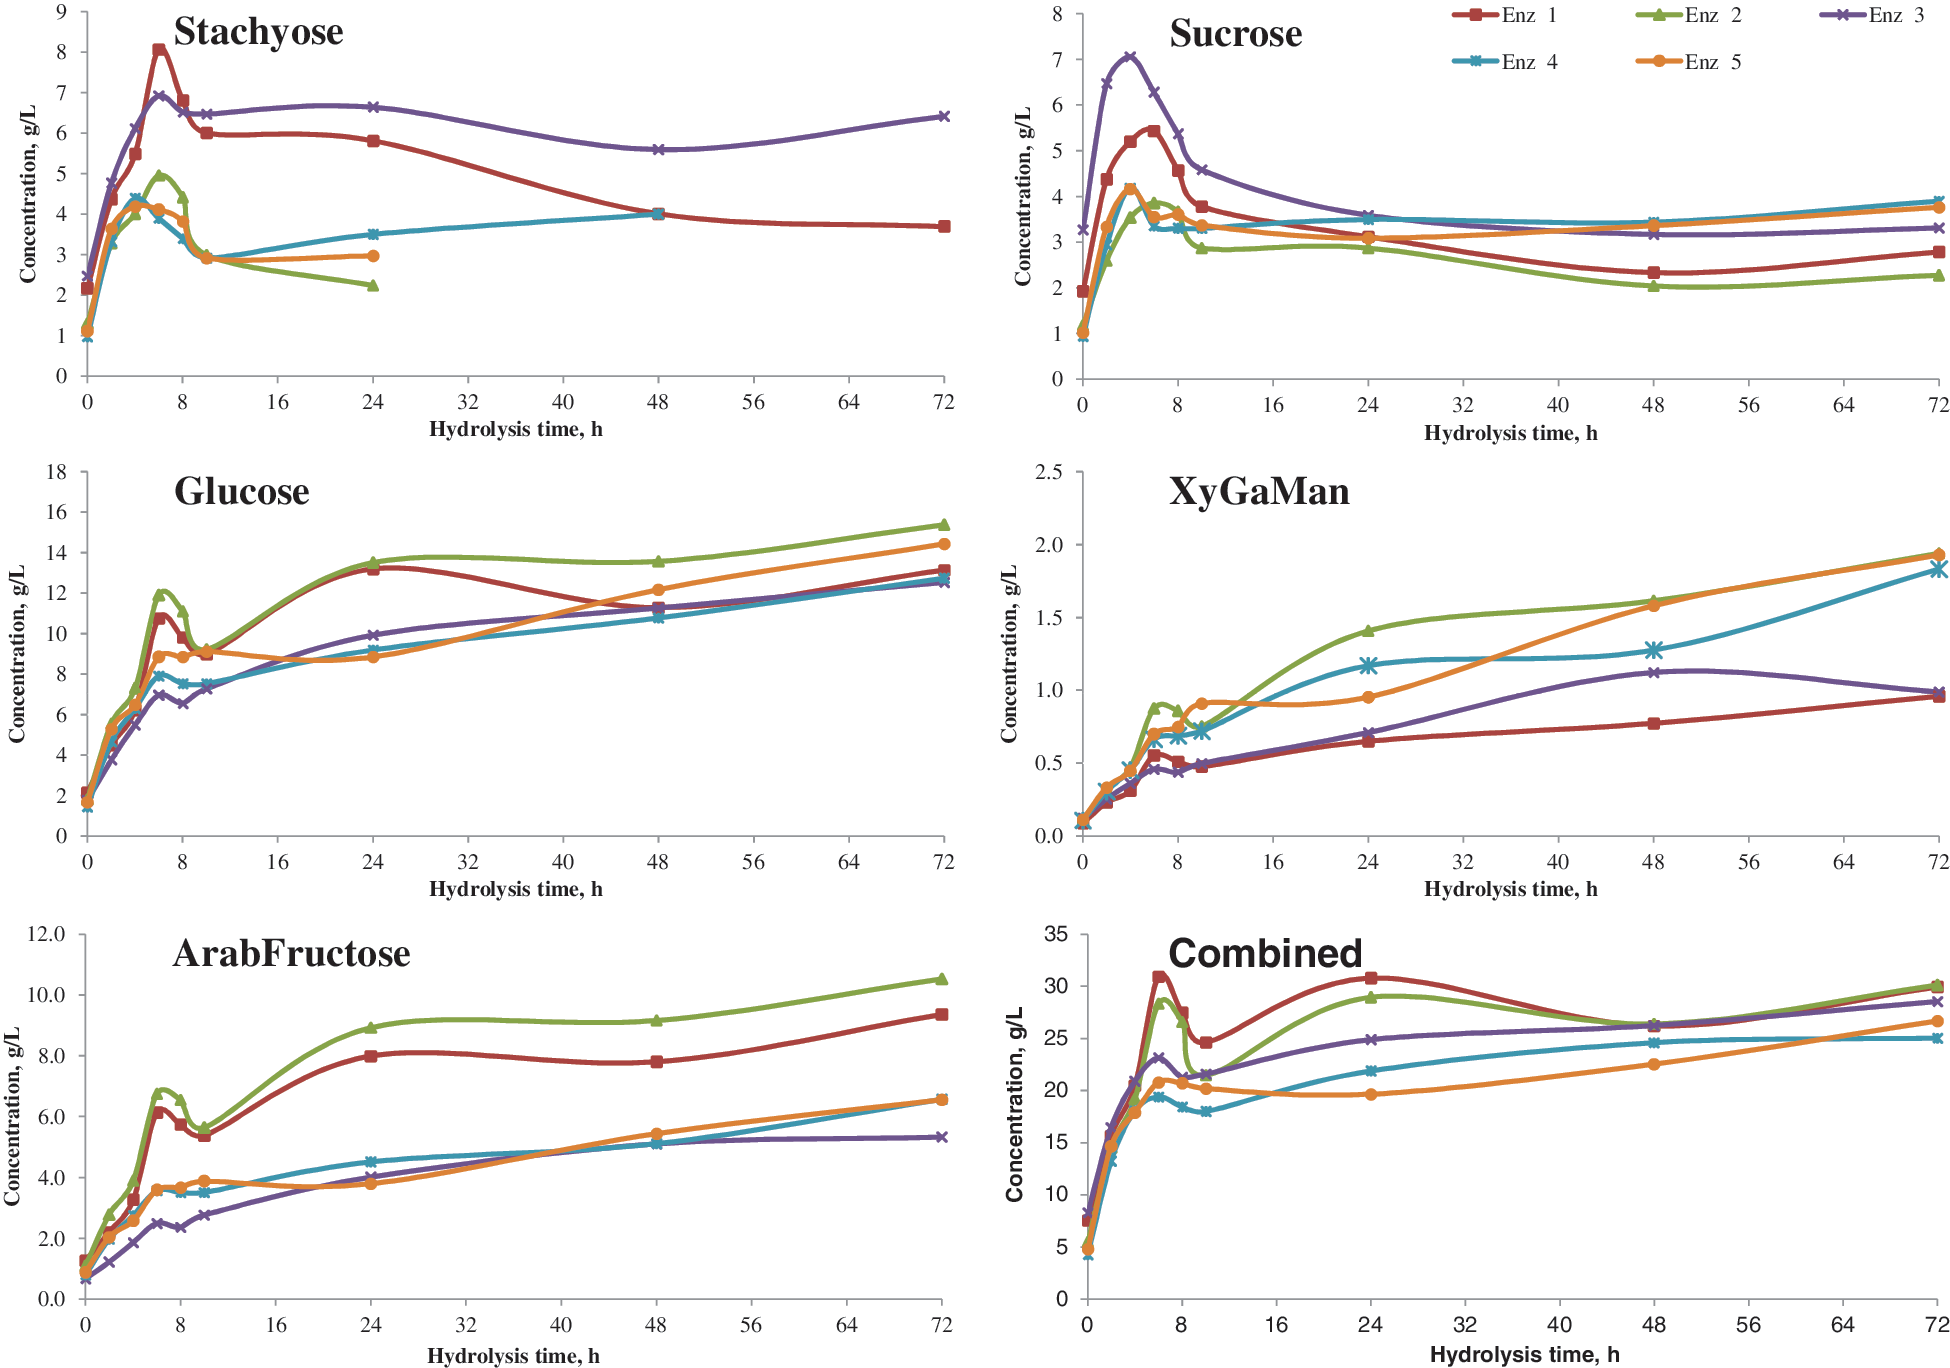
Effect of enzyme combinations on oligosaccharide and monosaccharide concentration from ethanol extracted white flakes (Enz 1: Celluclast 1.5L+Novozyme 188; Enz 2: Celluclast 1.5L+Novozyme 188+Novozyme 960; Enz 3: Cellic CTec+Cellic HTec; Enz 4: Novozyme 960; Enz 5: Cellic CTec+Cellic HTec+Novozyme 960). Color images available online at
The SugarPak column identified xylose, galactose, and mannose as a single peak (referred to as XyGaMan), and arabinose and fructose as another single peak (referred to as ArabFructose). As expected, the concentrations of glucose, XyGaMan, and ArabFructose increased during hydrolysis, and Enz 2 and Enz 5 exhibited relatively similar performance, as noted in Fig. 2.
EFFECT OF NOVOZYME 960 DOSAGE ON SUGAR RECOVERY
Due to the relatively high levels of oligosaccharides in white flakes, Novozyme 960 was tested at low, intermediate, and high dosages relative to recommended dosages. The data exhibit a typical dosage response (Fig. 3). Stachyose levels decreased faster and to a greater extent with the highest enzyme dosage (0.5 INU/g DM). Levels of sucrose and monomers also increased faster and to a greater extent with the highest Novozyme 960 dosage. As recommended by the manufacturer, the dose of 0.5 INU/g DM was selected for further studies.
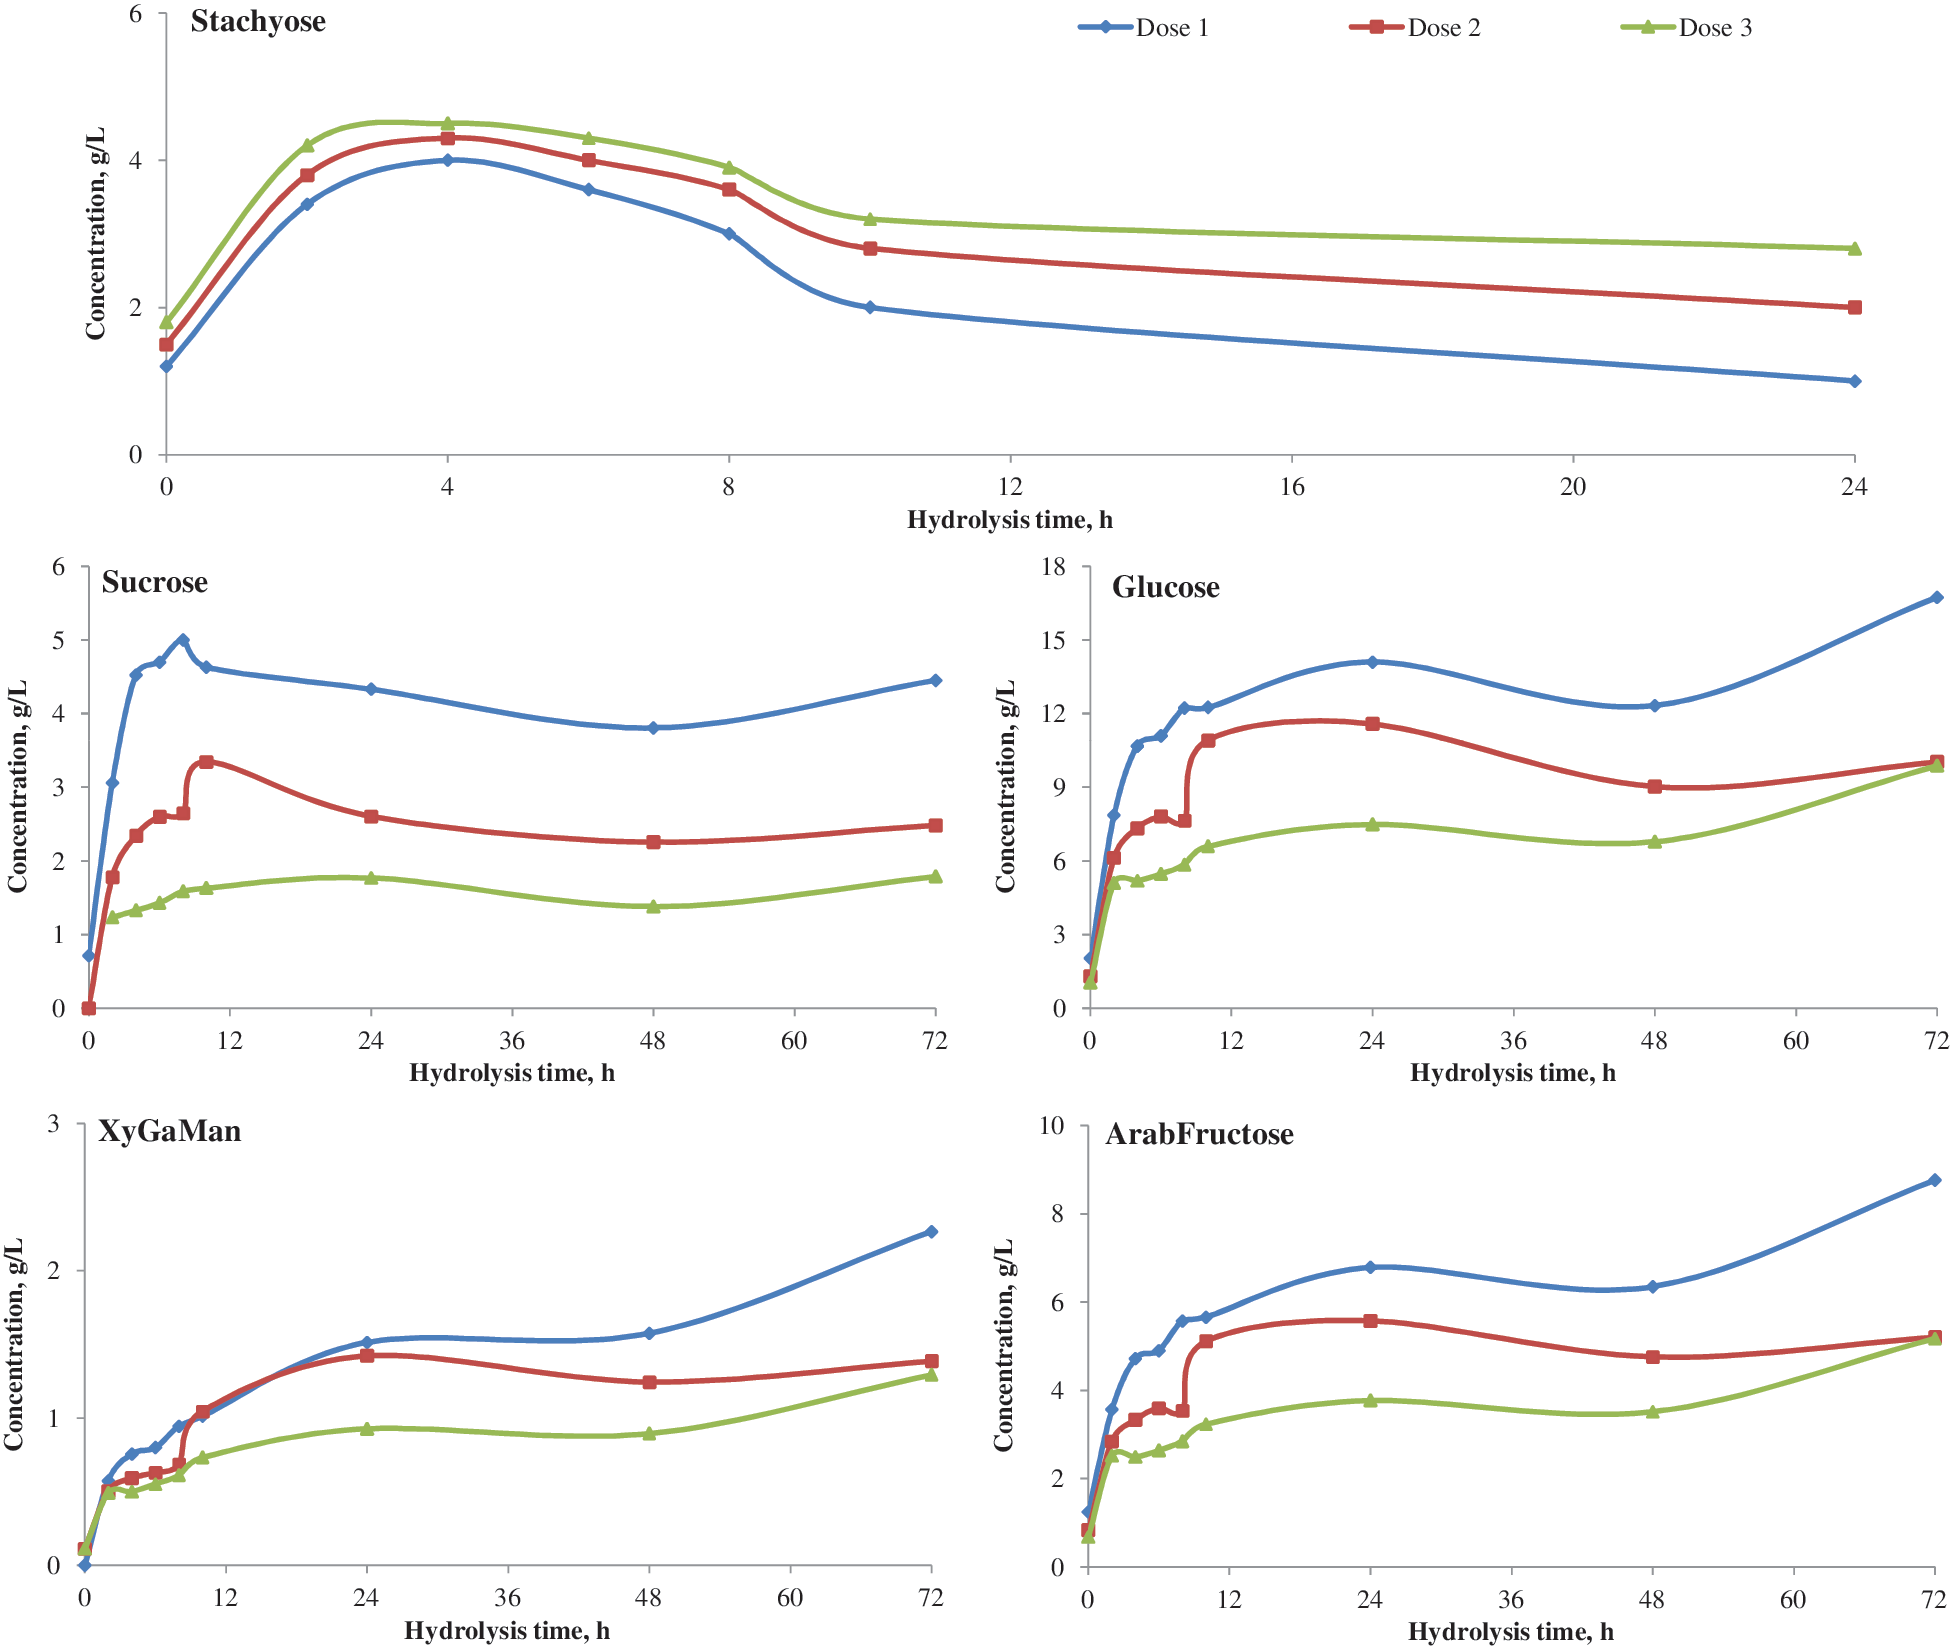
Effect of Novozyme 960 enzyme dose on sugar release from soybean white flakes (Dose 1: 0.5; dose 2:0.3; and dose 3: 0.1 INU/g dry matter). Color images available online at
EFFECT OF CELLIC CTEC DOSAGE ON SUGAR RECOVERY
Soybean white flakes also contain cellulosic fiber, and, therefore, Cellic CTec dosages were tested at levels from 3–15% (w/w). An increase in stachyose confirmed the absence of Novozyme 960 (Fig. 4). The increase of individual monomers and combined sugar confirms Cellic CTec performance. Considering the cost and sugar release, 6% (w/w) Cellic CTec was selected as the optimum dosage for further studies.

Effect of Cellic CTec enzyme dose on sugar release from white flakes. Color images available online at
EFFECT OF HYDROLYSIS TEMPERATURE ON SUGAR RECOVERY
Temperature is one of the factors that influences the hydrolysis process. The enzymes used in this study had different optimal temperatures, with Novozyme 960 in the range of 55–60°C, and Cellic CTec, Cellic HTec, Celluclast 1.5L, and Novozyme 188 at 50°C. To determine the best hydrolysis temperature to maximize hydrolysis of both oligosaccharides and cellulosic fibers while avoiding thermal inactivation of enzymes, we tested the two optimal enzyme cocktails under both temperatures.
Researchers have suggested using different temperatures in a number of methods for removing oligosaccharides from feedstocks. Sarkar et al. suggested fermenting soybeans for complete removal of raffinose family oligosaccharides, even though soaking and cooking reduced oligosaccharide content by 73–88%. 11 Mulimani et al. showed decreases of 90.4% and 91.9% in raffinose and stachyose, respectively, after treating soybean flour with crude α-galactosidase at 50°C for a 4 h incubation period. 12 In another study, Thippeswamy and Mulimani found that when free and immobilized α-galactosidase from Gibberella fujikuroi were used at the optimum temperatures of 56°C and 54–56°C, respectively, raffinose family oligosaccharides were reduced by 79% and 66% after a 3 h incubation time. 13 Kim et al. found a 5:1 ratio of water to soybean meal at 50°C to be optimal for extracting oligosaccharides. 14 Ekvall et al. reduced stachyose by16.3% and raffinose by 28.4% in vine peas using blanching, and they found that temperature did not affect the extraction yield from vine peas. 15 Viana et al. showed decreases of 72.3% and 89.2% for stachyose and raffinose, respectively, after 6 h of incubation at 40°C by α-galactosidase. 16 In another study, Viana et al. found optimum temperatures of 60°C and 80°C for free and immobilized α-galactosidase and obtained complete saccharification of stachyose in soymilk after 4 h of incubation at 60°C, respectively. 17 Recently, Karki et al. found an optimum hydrolysis temperature of 45°C for Accellerase 1000 (Danisco, Copenhagen, Denmark) for enzyme-assisted aqueous extraction of extruded full-fat soybean flakes. 3
Fig. 5 shows sugar concentrations from extruded white flakes at hydrolysis temperatures of 50°C and 55°C for both enzyme combinations. Stachyose disappeared after 6 h, irrespective of enzyme combinations and, as expected, no hydrolysis of sucrose occurred without the addition of the invertase enzyme. In general, the concentrations of monomers increased after 24 h of hydrolysis. Glucose was the monomer with maximum concentration, followed by fructose and galactose. Total monomer increased until 48 h, and then dropped slightly for the hydrolysis temperature of 50°C. In contrast, a hydrolysis temperature of 55°C showed an increased monomer concentration throughout saccharification. As shown in Fig. 5, total sugar concentration was greater at 55°C than at 50°C, irrespective of enzyme combination. Though both enzyme combinations showed similar results for white flakes, the more recently developed Novozyme enzymes Cellic CTec and Cellic HTec had greater activities. Hence, the enzyme cocktail of Novozyme 960+Cellic CTec+Cellic HTec at 55°C was selected for subsequent trials. The temperature mentioned by Thippeswamy and Mulimani is in accordance with the results of the current study. 13
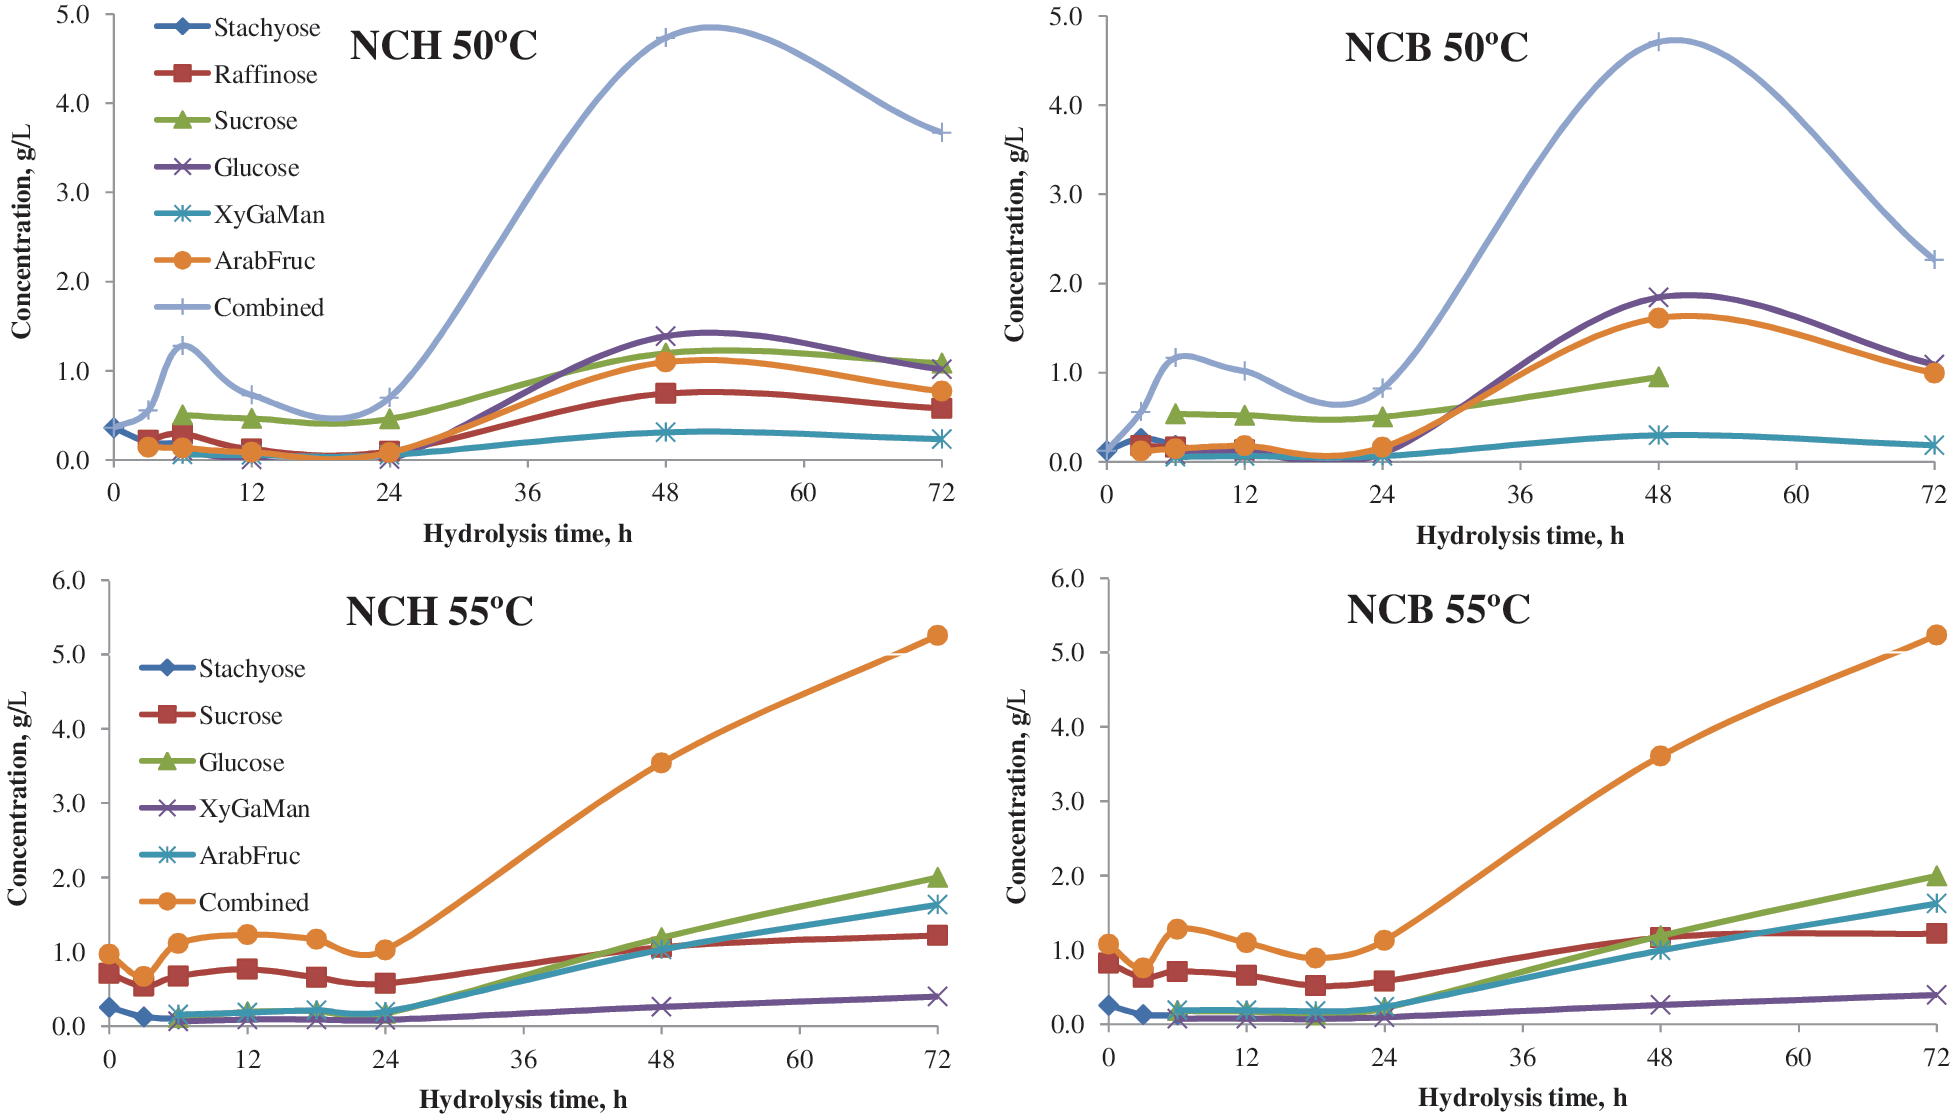
Effect of hydrolysis temperature on sugar recovery from white flakes (NCH: Novozyme 960+Celic CTec+HTec; NCB: Novozyme 960+Cellulase+β-glucosidase). Color images available online at
MAXIMIZING PROTEIN CONTENT BY PRETREATMENT AND HYDROLYSIS
White flakes at 15% moisture were extruded at a barrel temperature of 50°C and screw speed of 75 rpm and subjected to the optimized saccharification conditions previously identified (Novozyme 960, Cellic CTec, and Cellic HTec cocktail at dosages described above and hydrolysis temperature of 55°C). 5 Carbohydrate levels during saccharification of a 10% solids loading rate of white flakes are shown in Fig. 6. As expected, the oligosaccharides stachyose and raffinose decreased with time, and the monosaccharides increased. Most of this conversion was completed by 12 h, with a maximum total carbohydrate level of ∼13 g/L.
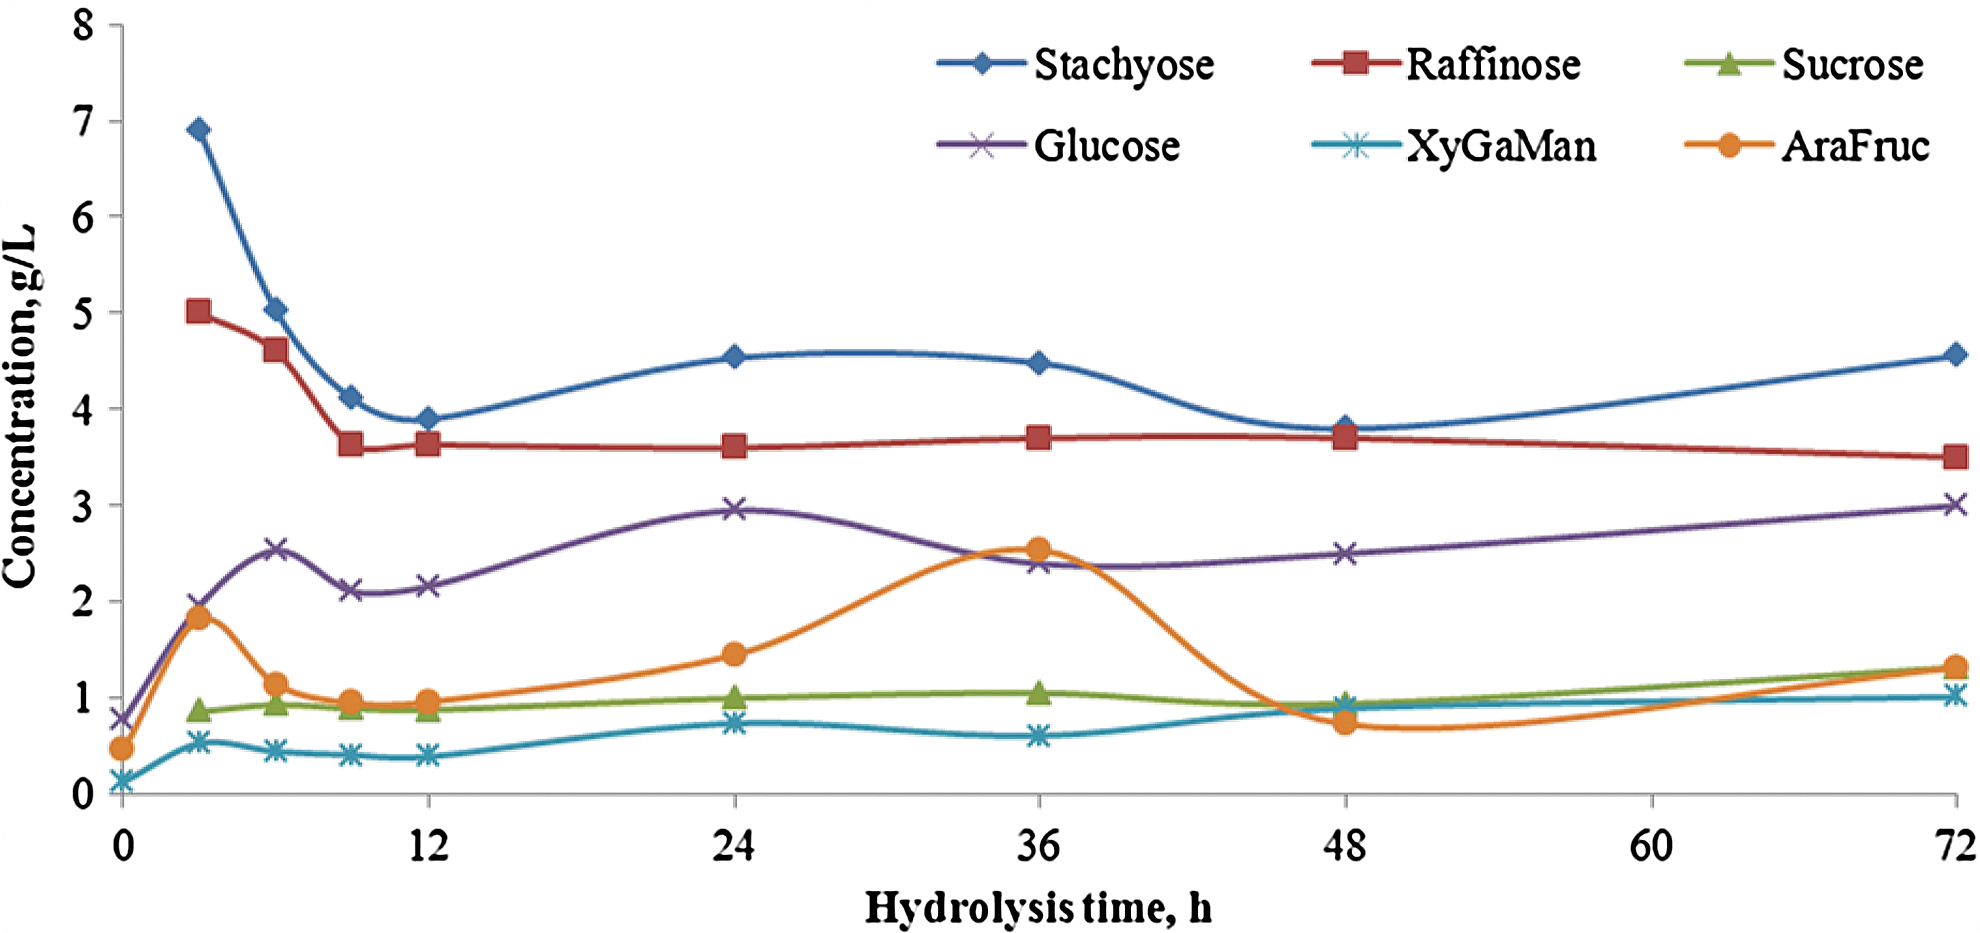
Carbohydrate levels during saccharification of extruded white flakes at optimal conditions (Novozyme 960 (0.5 INU/g), Celic CTec (6%), and HTec (0.3% total solids); hydrolysis temperature of 55°C; extrusion conditions: 15% mc, 50°C, and 75 rpm). Color images available online at
At a 90% yield, the theoretical ethanol titer from this amount of sugar would be 6 g/L, which would equate to 60 g ethanol per kg of white flakes. At a current ethanol price of $0.53/L, each kg of white flake would produce an ethanol yield valued at $0.04. Enzyme costs/kg of white flakes would be $0.04, $0.06, and $0.1 for Cellic Ctec, Cellic Htec, and Novozyme 960, respectively, assuming prices of $10, $20, and $50/kg. Therefore the value of ethanol produced would only cover 20% of the enzyme costs. However, as noted below, the increased protein content and value of the solid residue would more than compensate for these added expenses.
The second objective of this study was to maximize the protein content of the solid residue by fractionating the pretreated, saccharified white flakes using the processes shown in Fig 1. Protein content of solids at the end of the two different processes was statistically analyzed and found to be significantly different. However, extruded white flakes (the control) and mash had similar protein content. The mash that went through the ethanol wash-centrifuge process had higher protein content (68.5%) than that of the centrifuge-ethanol wash-centrifuge process. Karki et al. also found that enzymatic hydrolysis using Accellerase 1000 resulted in higher levels of residual protein. 3 Dust et al. observed that mild and moderate extrusion conditions affected chemical composition of soy flour (i.e., total dietary fiber, insoluble dietary fiber, and soluble dietary fiber), but observed no changes in oligosaccharides and monosaccharides. 18 This observation was in agreement with twin-screw extrusion pretreatment of full-fat soybean flakes. 1 Irish et al. reported that alcohol extraction had no effect on the true metabolic energy of soybean meal, whereas Coon et al. observed an increase in true metabolic energy due to ethanol extraction. 19–20 The hypothesis of this study was that the ethanol wash to remove sugars (as a simulation for fermentation) would enhance the protein content, which was in agreement with Coon et al. 20
Increasing the protein content of soybean meal from 48% to a concentrate of 69% significantly increases value (from $0.375/kg to more than $0.75/kg, assuming a cost of raw soybeans at $10/bushel). As noted above, the saccharification enzymes used in this process add $0.20/kg to the processing cost, which is partially offset by the $0.04/kg value of the ethanol recovered. Factoring in the increased value of the soy protein concentrate ($0.375/kg) leaves a net improved value of $0.215/kg, less the cost for the conversion process.
Conclusions
This study had two primary objectives: to select a suitable enzyme combination, enzyme dosages, and hydrolysis temperature and to enhance the protein content of the residue. The optimized enzyme combination consists of Novozyme 960 (0.5 INU/g), Cellic CTec (6% based on cellulose), and Cellic HTec (0.3% of total solids), with a hydrolysis temperature of 55°C. Saccharification of extrusion pretreated soybean white flakes resulted in a 4-fold increase in sugar recovery compared to the untreated control; following sugar removal by an ethanol wash and centrifugation the protein content of the solids increased from 46% to 69%. This would increase the value for soybean meal from ∼$300/ton to at least $700/ton for the 69% protein product.
Footnotes
Acknowledgments
This research was supported by funding from the South Dakota Agricultural Experiment Station and United Soybean Board. The authors thank South Dakota Soybean Processors and Novozymes for providing feedstocks and enzymes, respectively, used in this study.
Author Disclosure Statement
No competing financial interests exist.