
Abstract

Introduction
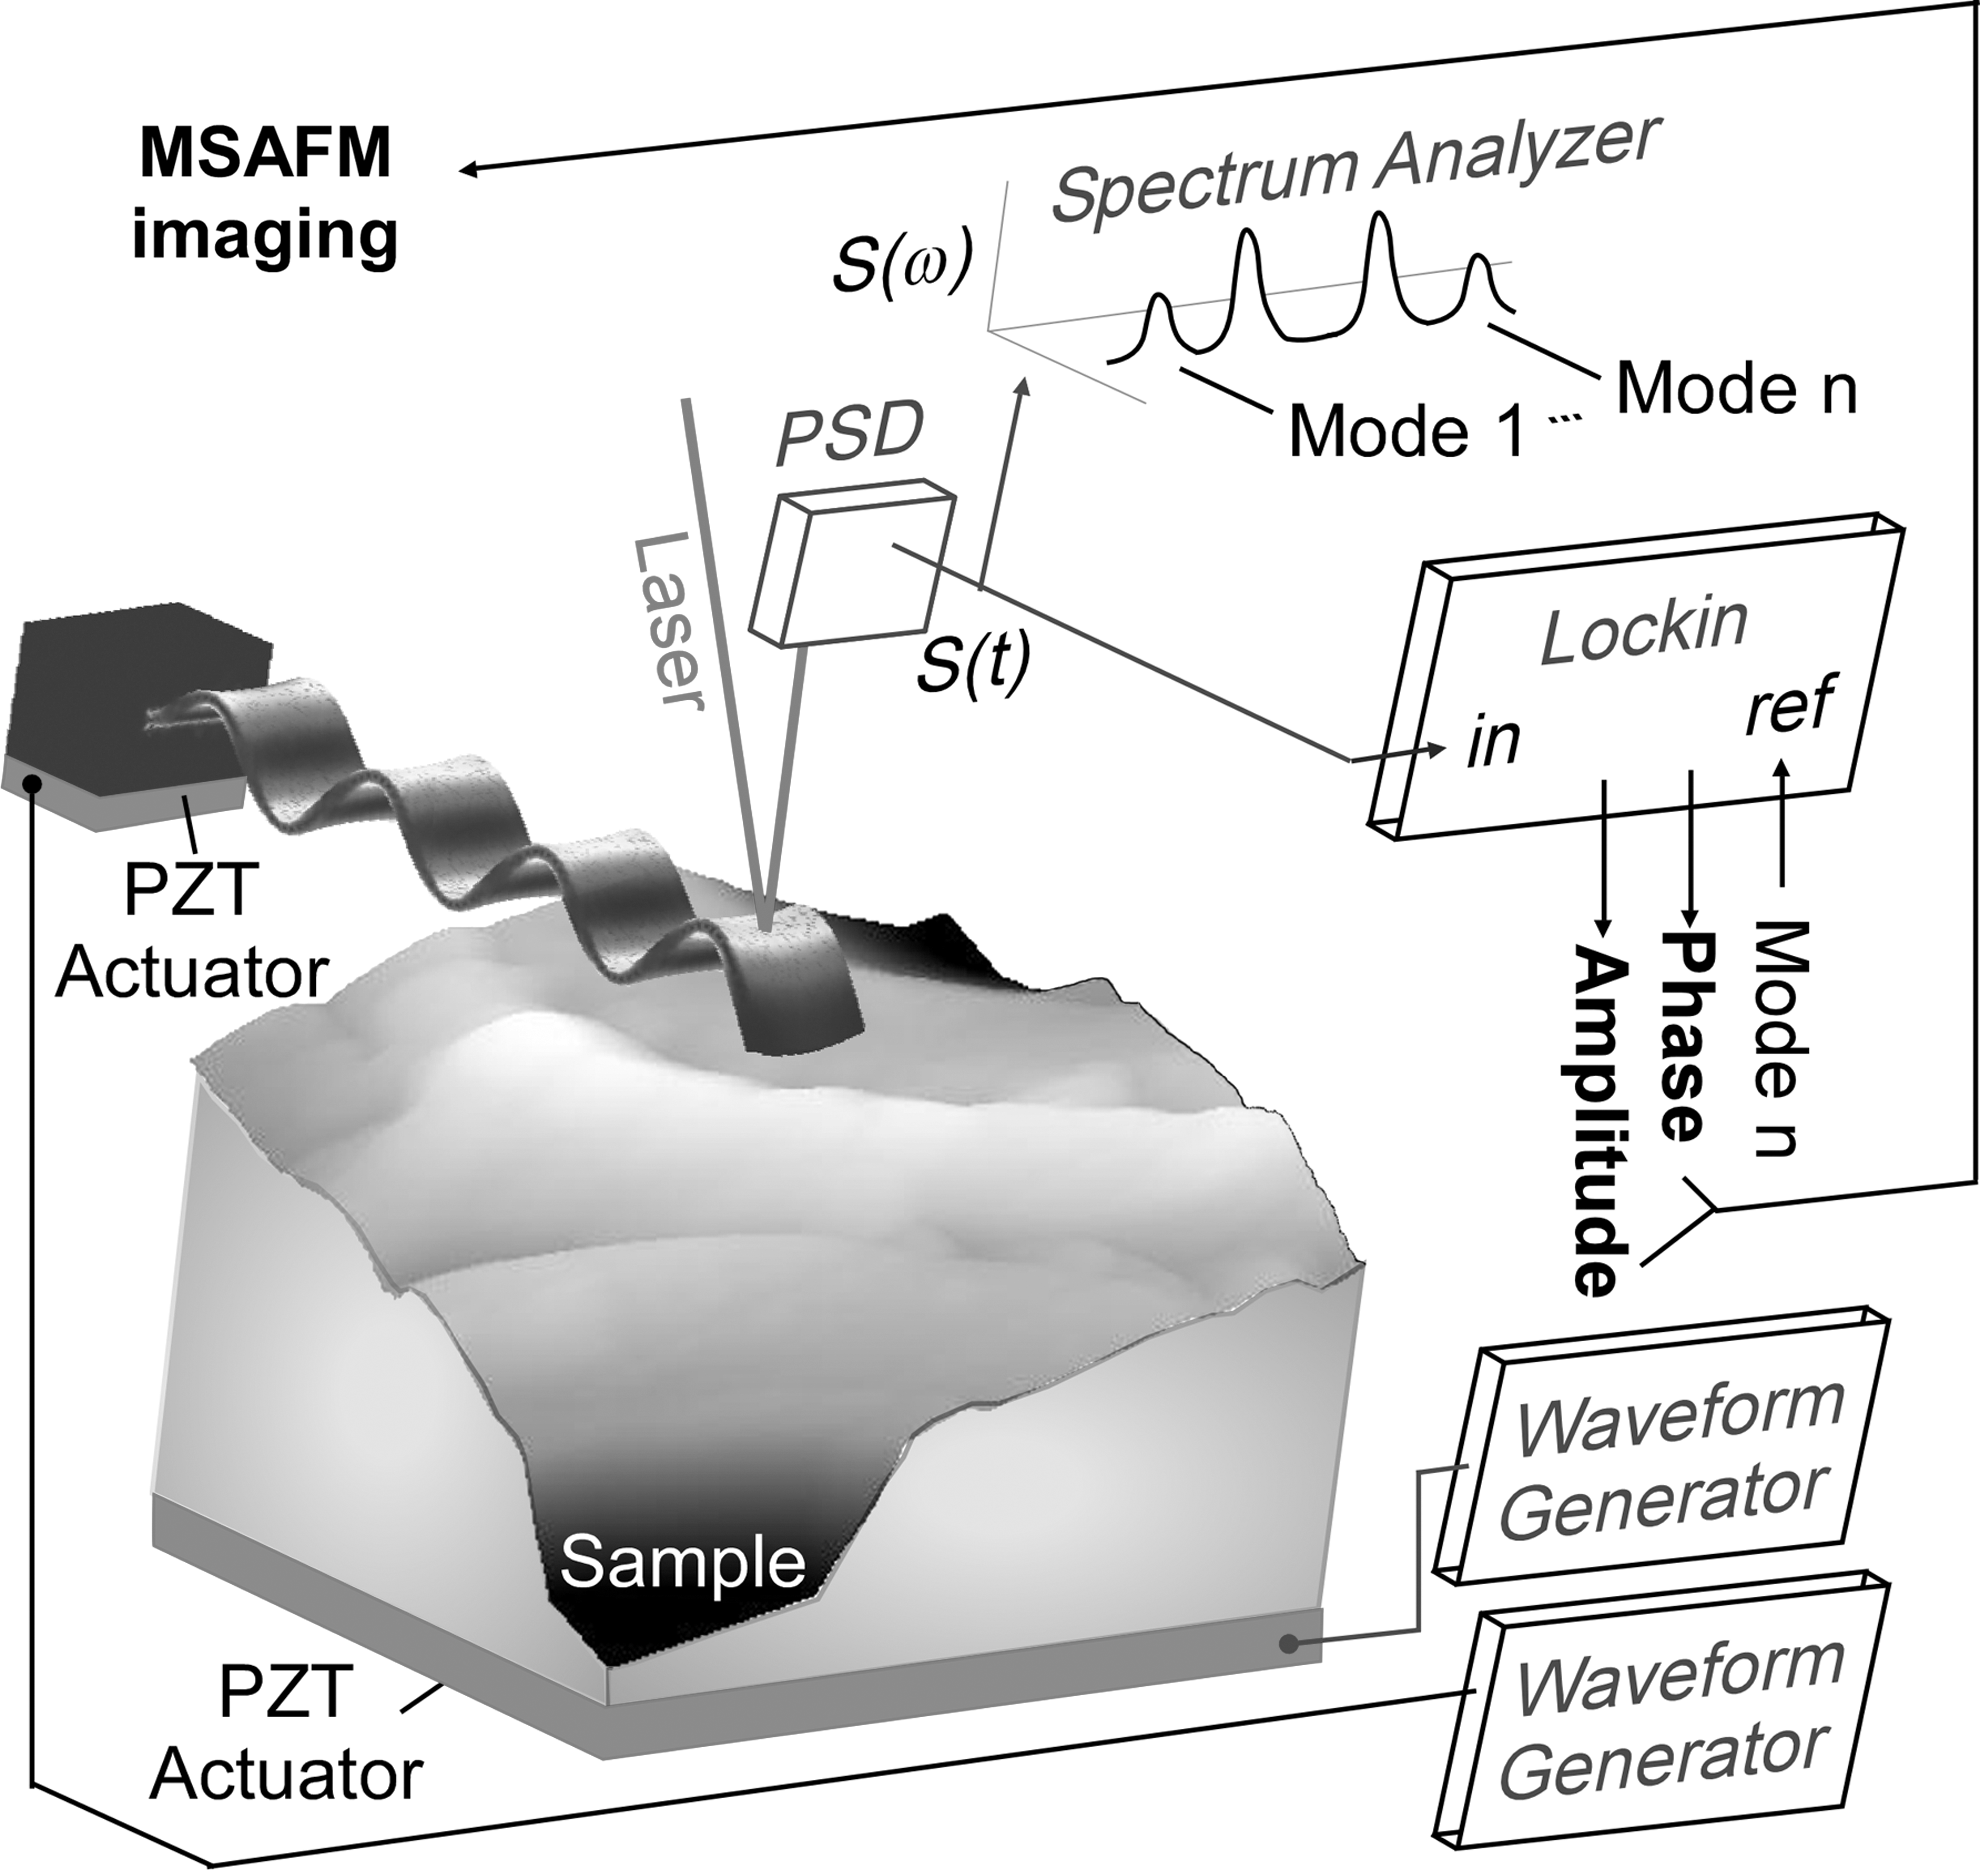
Schematic representation of the MSAFM experimental setup. The signal S(t), generated by the position sensing detector (PSD), is decomposed in frequency domain using a spectrum analyzer. The synthesized modes, labeled as modes n=1,2,…in the resulting spectrum S(ω), correspond to various (sum and difference) frequency mixings. The mixing occurs as a result of nonlinear probe-sample interaction when the PZT actuators are excited using the waveform generators. The amplitude and phase of a given mode n are detected with a lock-in amplifier and processed to form the nth MSAFM image.
Morphological studies of cell walls using electron microscopy (e.g., scanning electron microscopy, transmission electron microscopy, electron spectroscopy for chemical analysis, or immuno-electron microscopy) and force microscopy (e.g., nanoindenter or AFM) have been attempted. 12,14,17,18 Yet, because the plant cell wall thickness is in the micrometer range and underlying features, such as cellulose nanofibrils, are in the nanometer range, there is an urgent need to characterize morphology and physical and chemical properties simultaneously and at nanoscale. 19 MSAFM constitutes a first step toward this goal.
We propose to utilize the high spatial resolution capabilities and rich dynamic attributes of MSAFM to resolve new features of the plant cell wall using sectioned fresh Populus samples—each typically 50 micrometers thick and less than a centimeter in diameter—as model substrates. The motivation behind using this plant system is to advance the understanding of cell wall structure to improve the effectiveness of further chemical treatments, such as the holopulping processes and acid treatments involved in the conversion of polysaccharides into simple sugars for fermentation into ethanol for biofuel.
Materials and Methods
AFM and Force Curve Measurements
In AFM, a cantilever with a sharp tip is scanned across a region of the sample surface (Fig. 2Center). The tip-sample interaction is monitored by detecting the horizontal and vertical displacements of the cantilever probe, while the tip-sample distance and scanning are controlled by a feedback loop and piezoelectric actuators. By registering the tip-sample interaction force as the probe approaches the surface at a given location of the sample, also known as force curve measurement (Fig. 3), one obtains the local mechanical properties of the sample (e.g., Young modulus E, adhesion forces, stiffness, etc.). 20 Here we carried out force curve measurements and analyzed the results using a commercial analysis software, Bruker Nanoscope (Bruker AXS, Madison, WI). By fitting the approach curves (Fig. 3) using a linearized (Hertz spherical) model, the Young moduli were calculated for a cantilever (CSC 17, Mikromasch, San Jose, CA) with specified dimensions (length=460.0 μm±5.0 μm, width=50.0 μm±3.0 μm, thickness=2.0 μm±0.5 μm) and parameters (elastic constant k=0.15 N/m, tip radius=10 nm, tip half angle=20°). The values consist of an acceptable average over the range of measurements on various areas and tip replacements. Thus, the elastic constant k=0.15 N/m was used to derive the force (F) as F=k·Z, where Z is the displacement (Fig. 3). As the contact area (A) is a challenging parameter to calculate in the case of complex heterogeneous biological samples, the diameter of the contact area, in the Hertz model, is determined using a cone shape for the geometry of the tip.
Characterization of the cell walls of fresh Populus,
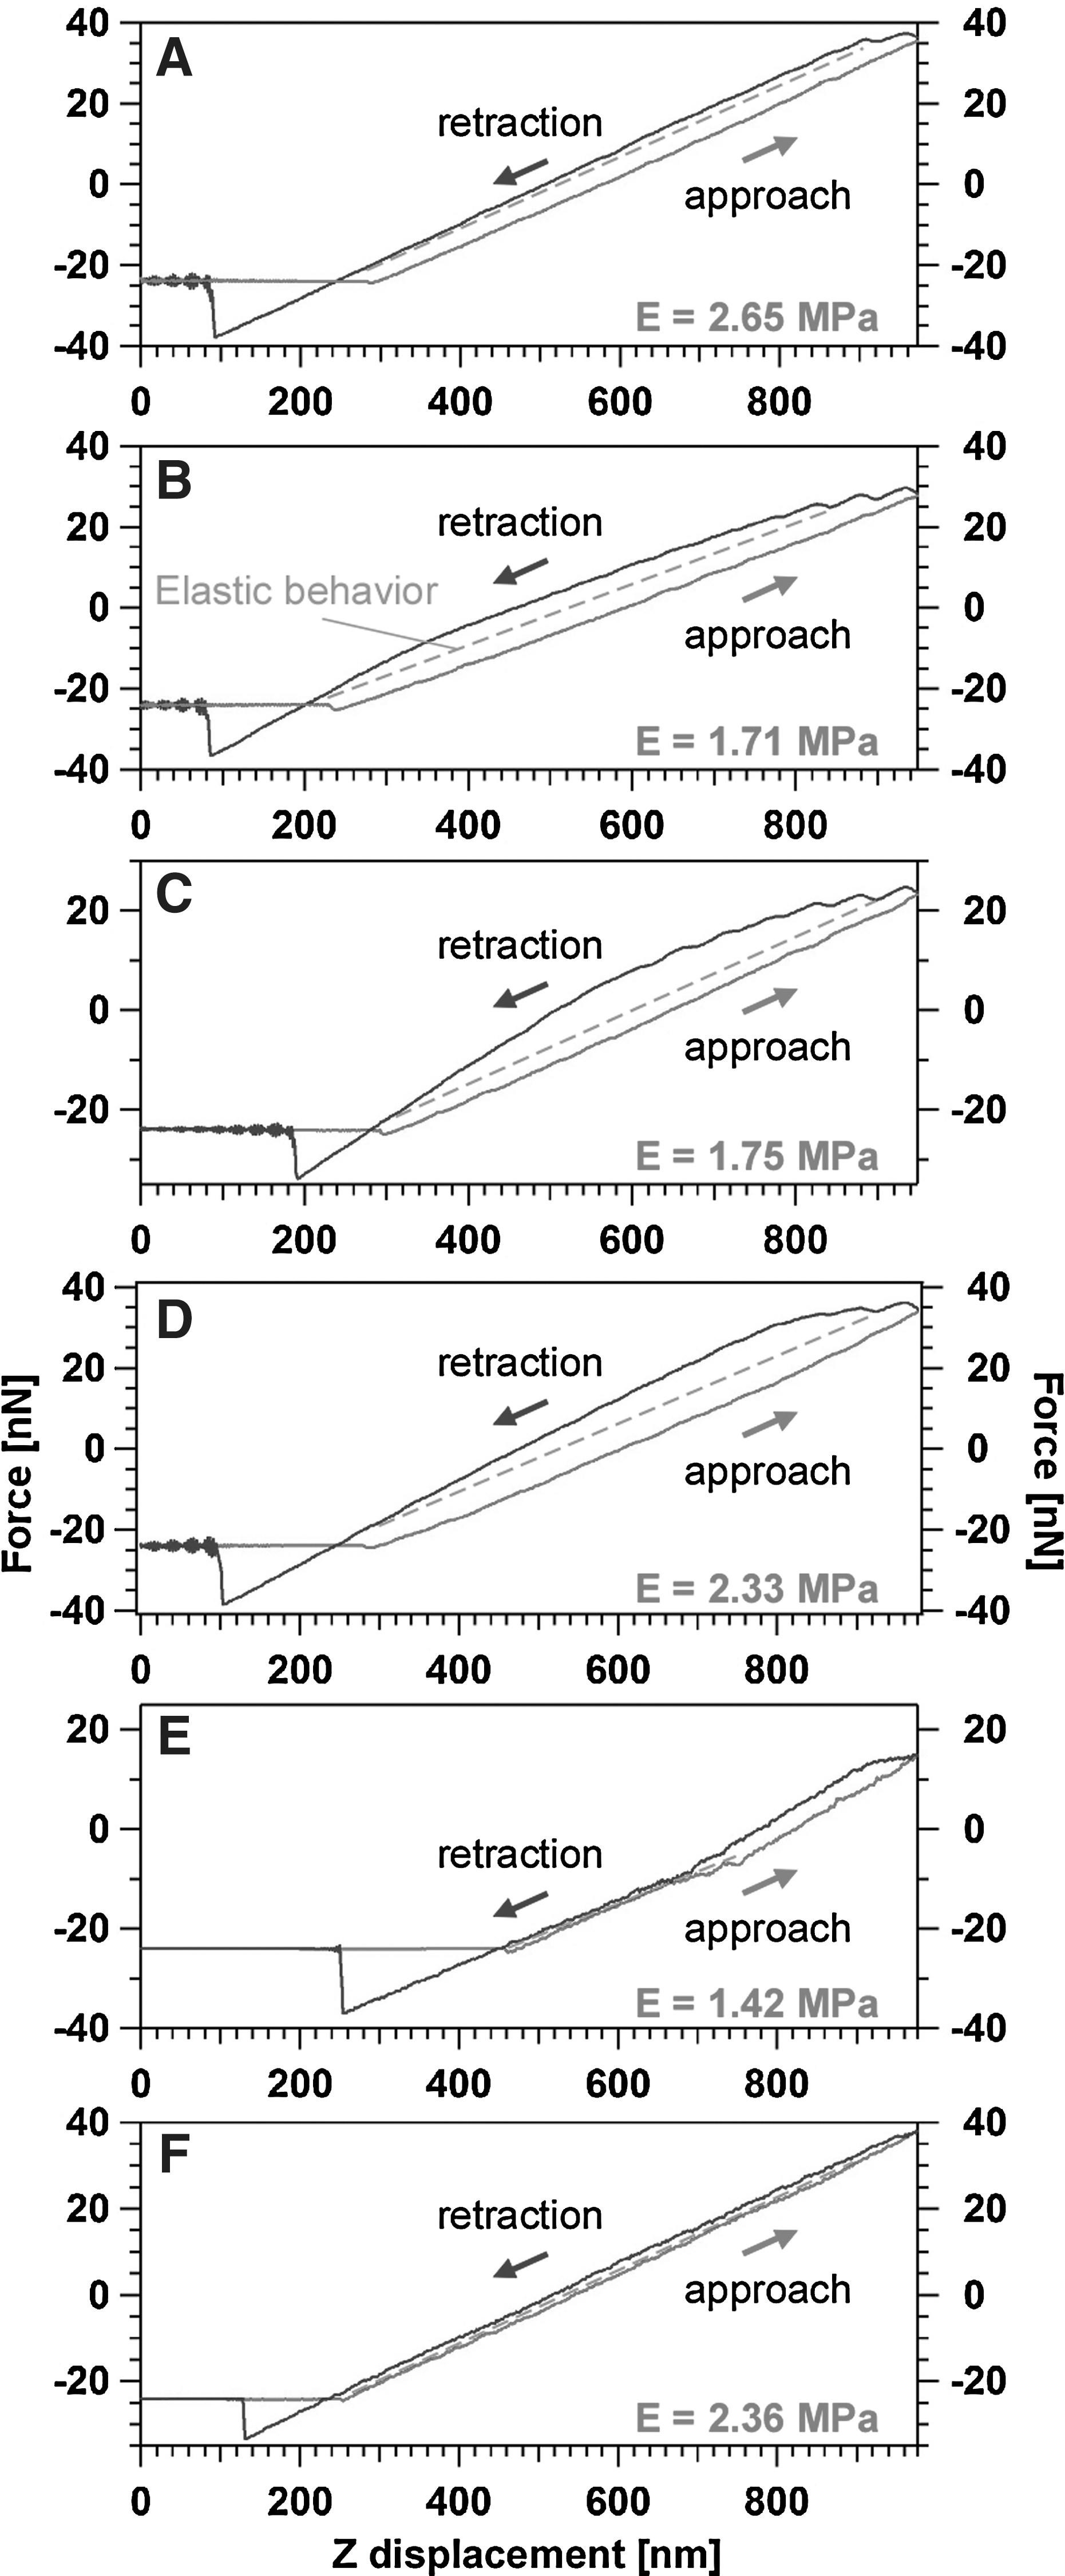
Force curve measurements at the various sample surface locations (A-F, as indicated in Fig. 2Center) as a function of probe-sample distance Z. The solid curves represent the force experienced by the probe when it approaches the surface or retracts from it. The dashed curve indicates the relative deviation of the material elastic response (characterized by E, the Young modulus) in the various measurements.
Multi-Frequency AFM and MSAFM
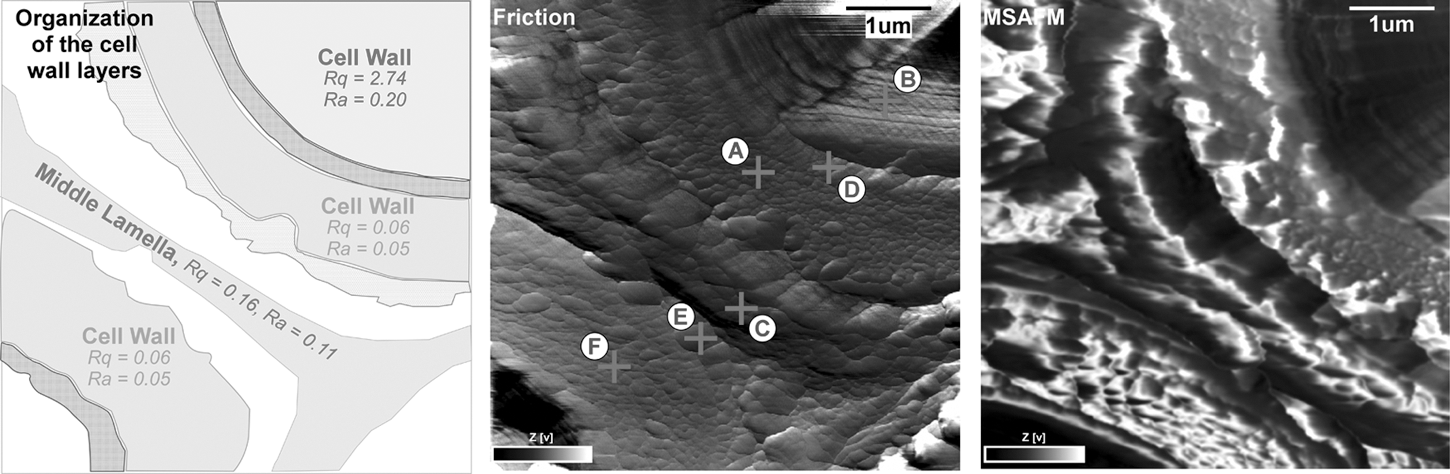
The image formation in AFM is based on the measurement of variations in the deformation state (dynamic and/or static attributes) of the probe induced by the probe tip-sample interaction at each point of the scanned area. In the case of MSAFM, the probe and the sample are driven by external forcings of different amplitudes, phases, and frequencies delivered via piezoelectric oscillators in contact with the cantilever and the sample, respectively (Fig. 1). 5 In doing so, the tip-sample interaction creates a set of new elastic excitations in the coupled probe-sample system. 5,12 Since the tip-sample interaction is described by a nonlinear function of the separation distance, the new oscillations occur at a broad variety of mixed frequencies. Thus the probe senses the elastic response of the sample, that is, the variations in a given collection of the new modes register the variations in the mechanical properties of the plant cell walls over the scanned region. The observed differences in the textures and contrast in the MSAFM maps correspond to variations in the properties of the sample, which are of great interest for characterizing the different layers of the cell walls (Fig. 2Right).
Time of Flight Secondary Ion Mass Spectrometry (TOF-SIMS)
To further analyze surface composition of the samples, we carried out secondary ion mass spectrometry. TOF-SIMS (TOF-SIMS V, ION-TOF, Münster, Germany) images were acquired by sputtering the biomass surface using Bi3 ++ as the primary ions. The instrument was operated in high-resolution image positive mode (20 kV) with intermittence flood gun. A raster size of 50 μm×50 μm was used for all data acquisitions from the samples. Cellulose and lignin characteristic ions were assigned in mass spectra identified according to published literature values. 21,22 TOF-SIMS images and mass spectra were acquired at least at three locations on each sample to obtain a reliable data set. The data were processed using the IonSpec Version 4.1 and IonImage Version 3.1 software (ION-TOF).
Sample Preparation
The Populus deltoides stems used in our work were grown at the National Renewable Energy Laboratory (NREL) and harvested between 2007 and 2008. The stems were then stored at −20°C. The stem of a juvenile Populus deltoides was sectioned into 50 μm-thick layers using a LEICA CM 3050S (Leica Microsystems, Wetzlar, Germany) equipped with a disposable steel blade. To avoid contamination from the embedding medium, which can be an issue, the sample was directly attached on a metal stage. 23 This delicate and controlled sample preparation constitutes an alternative to the sawdust or milled wood traditionally used for chemical analysis, in which the structural information of the cell wall can be destroyed. Using spectroscopic measurements, the sections were shown to have the same composition as the 20-mesh ground (milled) Populus material usually used for larger scale studies. 23 Thus, the nearly intact structural properties of the plant cell walls and the lamella in the cross sections are particularly suitable for high-resolution image analysis.
For TOF-SIMS measurements, sequential Soxhlet extractions were used to remove the extractives from the fresh Populus slices, thus obtaining a set of extractive-free Populus cross-sections. After sectioning, the samples were placed between two glass slides to create a dry environment, preserve the native form of the samples, and prevent damage from the environment and distortion. High-resolution imaging requires a stable immobilization of the sample to limit the background noise. To preserve the composition of the samples and maintain propagation of the ultrasonic waves through the cell walls, we used an adhesive film, thus enabling the coupling between the sample and the piezo-actuator.
Results and Discussion
The underlying mechanisms of the MSAFM operation hinge upon nanomechanical sum and difference frequency generation, a process not necessarily based on nonlinear material, but rather on nonlinear interaction. 5,12,24 We have demonstrated previously that the amplitude of these synthesized modes can be enhanced by careful spectral tuning with respect to the flexural resonances of the probe for a given set of excitation frequencies. 5,12 The resonant oscillations of the microcantilever can be measured using a spectrum analyzer or a lockin amplifier (Fig. 1) for the sake of identifying the imaging parameters, and can also be calculated computationally. The microcantilever exhibits an infinite number of resonant modes, although practical response and measurement bandwidths limit the accessible modes available for imaging. However, invoking the recently discovered concept of virtual resonance, it is possible to excite new “resonant” modes in the MSAFM system, which will behave as resonances of the system and make it possible to explore new dynamics in the samples. 24 The new functional modes correspond to a linear combination of the difference and sum of the driving frequencies applied on the probe and the sample, and can all be used to form unique images containing mechanical information on the sample. Each of the images acquired corresponds to the amplitude or phase of the MSAFM modes, highlighting unique features of the plant cell walls not retrievable from the other modes on post-processing. 5
Nanoindentation measurements conducted on lignocellulosic plants have led to a better understanding of the mechanical properties of wood, such as its hardness and Young modulus. 25 Previous results indicated a constant hardness of the various parts of the sample [corner middle lamella (CC) and secondary wall (S2)], but large variations in the Young modulus. In particular, the modulus of the CC was lower than that of the S2 by up to 50%. In Figure 3, we present a set of force curve measurements performed on the fresh Populus sample. Changes in roughness, as observed in the different regions of the friction map ( Fig. 2Center) and highlighted in the schematics of Figure 2Left, were used to hypothesize on the variation in composition of the different layers of the cell wall and lamella. Rq, the standard deviation of the Z values (for the areas depicted in Fig. 2Left), indicates a variation of the roughness from 0.06 to 2.74. Ra, the arithmetic average of the absolute values of the surface height deviations measured from the mean, also exhibits variations across the various regions, from 0.05 to 0.20 (Fig. 2Left). The Young modulus (E) was extracted from the force curves (Fig. 3) performed on each of the regions, as described in Figure 2Left. The cell wall—points A and F in Figure 2 Center—exhibited an E of about 2.6 megapascals (MPa), repeatable at several locations of the sample, whereas a lower E of about 1.7 MPa was measured for the middle lamella (Fig. 2Center, point C). The regions at the interface of the cell wall layers (Fig. 2Center, points D and E) also showed some variation, with values between 1.4 and 2.3 MPa. The results are in agreement with Wimmer et al. regarding the variations between the modulus of the cell wall and the middle lamella. 25
For a displacement of the Z scanner of about 300 nm when the tip is in contact with the surface of the sample, the force curves indicate different behaviors in the response of the materials. The cell wall, with higher E, exhibits an elastic behavior (Fig. 3A and F) with low deformation at the point on contact, while the hysteresis observed in the force curves obtained on the middle lamella (Fig. 3C) is indicative of a behavior similar to an adhesive-like soft material. The force curves obtained at the interfacial regions (Fig. 3D and E) also exhibit a hysteresis, although with a smaller amplitude than that of the middle lamella. The local mechanical behavior of the different regions of the sample is indicative of a change in composition and/or structural properties of the cell wall layers, which can be explained by different cellulose and lignin distributions along the cross-sectioned cell wall. To explore the chemical information of the cell wall, we employed TOF-SIMS (Fig. 4). The total ion image of the extractive-free Populus represents the cell wall structure, and a line scan was applied on a single cell wall (dashed line in the inset of Fig. 4) to characterize the spatial distribution of cellulose and lignin in a single cell wall. Based on cellulose ion intensity (Fig. 4, dashed line) higher cellulose content can be observed on both sides (S2 areas) of the center area (middle lamella), while relatively higher lignin ions were primarily observed in the middle lamella region (Fig. 4 dotted line). Thus, regions with higher values of the Young modulus of the cell wall S2 are seen to coincide with regions of higher cellulose content (with its densely packed structure), while a lower Young modulus appears to be characteristic of the lignin rich composition of the middle lamella and cell corner.
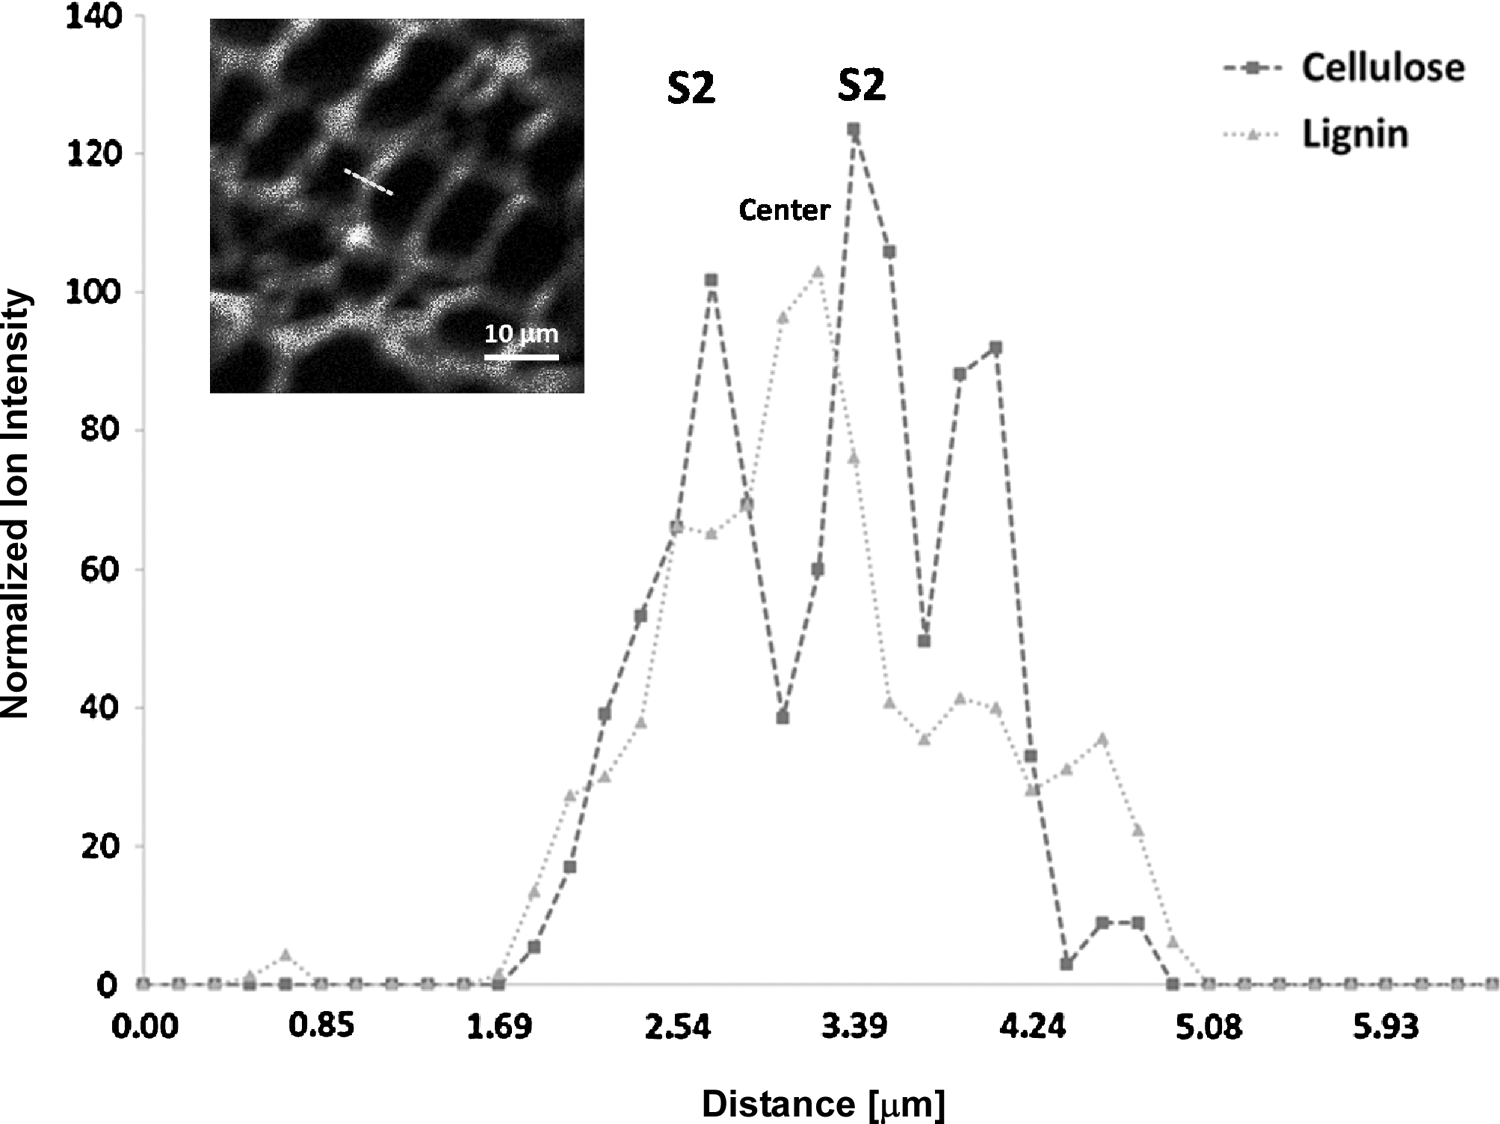
Line scan intensities of the characteristic ions of cellulose (dashed line) and lignin (dotted line) along the dashed line in the inset indicated in the total ion image of cross-sections of extractive-free Populus by TOF-SIMS (inset).
Similarly, the contrast variations in the MSAFM maps presented in Figure 2Right and the corresponding cross section presented in Figure 5 indicate variations in phase across the cell wall, middle lamella, and cell corner. The various regions (e.g., cell wall, middle lamella, interfaces) could be identified in Figure 5 and are labeled for direct comparison to Figure 2Left. These observations indicate a link between the mechanical properties and high variability in the plant cell walls structures. In previous studies by Tetard et al., MSAFM measurements on chemically treated holocellulose samples indicated that a large portion of the middle lamella and cell corner had been removed in the holocellulose sample, which is consistent with the location of adhesive-like material response identified with the force curve measurements (Fig. 3) and the MSAFM phase image (Fig. 2Right). 12
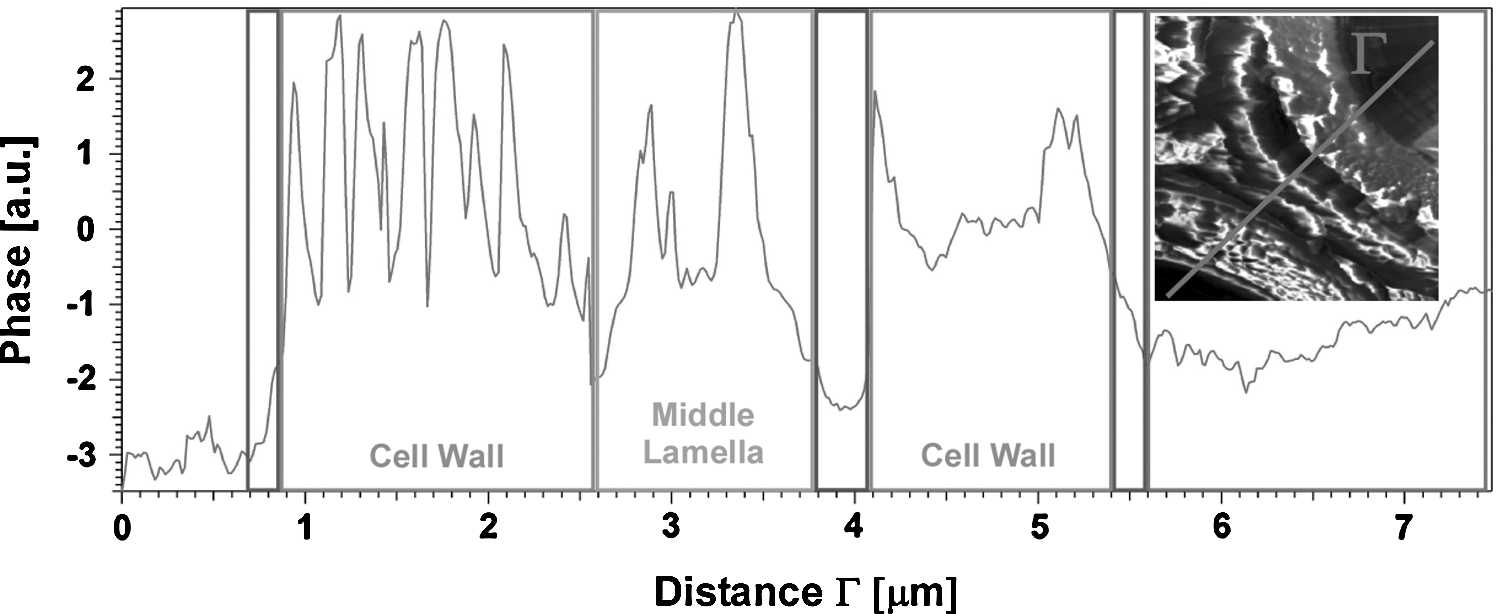
MSAFM phase variation along Γ across the cell wall of fresh Populus. The observed phase fluctuations are representative of changes in elasticity of the different layers, in accordance with the force curve measurements presented in Figure 3.
In the course of our studies, we were able to find a correlation between the mechanical properties of the sample and the MSFAM phase images at the resolution of tens of nanometers. Given its label-free, noninvasive, and high-resolution capabilities, as well as the possible option of liquid imaging, the potential for MSAFM to provide insightful results for biofuels research is tremendous, in particular to improve the chemical treatments associated with polysaccharides conversion and to design more efficient systems for large-scale lignocellulosic biomass production.
Footnotes
Acknowledgments
Laurene Tetard would like to acknowledge partial support from the Wigner fellowship program. The authors would like to thank Dr. Mark Davis and Robert Sykes at NREL for providing the Populus stems that were used for cross-sectioning. This research was sponsored by the BioEnergy Science Center (BESC) of the Oak Ridge National Laboratory (ORNL). The BESC is a US Department of Energy (DOE) Bioenergy Research Center supported by the Office of Biological and Environmental Research in the DOE Office of Science. ORNL is managed by UT-Battelle, LLC, for the US DOE under contract DE-AC05-00OR22725.
Author Disclosure Statement
No competing financial interests exist.