




Abstract
Near-infrared (NIR) calibration models for lignin, glucan, and xylan were developed with 55 samples of individual and mixed biomass species containing wheatgrass (Thinopyrum spp.), switchgrass (Panicum virgatum L.), wild rye (Leymus spp.), big bluestem (Andropogon gerardii), alfalfa (Medicago sativa L.), and sweetclover (Melilotus officinalis L.) planted in five locations across North Dakota. The models were developed using a diode array (DA) 7200 NIR spectrometer (950–1,650 nm) and GRAMS statistical software. Models were validated with 10 samples, and the root mean square errors of prediction (RMSEP) were 0.54, 1.12, and 0.97 for lignin, glucan, and xylan, respectively. Lignin, glucan, and xylan models had R2 values of 0.873, 0.843, and 0.902, respectively. The RMSEP and R2 values indicate that it is possible to develop acceptable calibration models to predict chemical composition for mixtures of herbaceous perennials. NIR instrument-based component predictions were consistent over a period of hours with coefficients of variation (CV) for replications between 0.8% and 1.8%. The effect of repacking (presentation) was also low, as the CVs for lignin, glucan, and xylan contents of repacked replicate samples were all less than 3.6%. NIR prediction was more precise than wet chemistry analysis as 95% confidence intervals for NIR composition predictions for replicates analyzed over 10 successive days were 50–63% lower than those for standard wet chemistry analyses.
Introduction
Biomass has organic components—primarily cellulose, hemicellulose, and lignin—that are vital resources in the biochemical and thermochemical conversion processes used to produce biofuels or biopower. Cellulose and hemicellulose, which are sugar polymers embedded in plants' cell walls, are important fermentation substrates, while the likely near-term use for lignin is as a process energy feedstock. The inorganic components of biomass, namely ash, cannot be converted to energy or used for biofuel production. High amounts of ash reduce the relative amount of organic components, which is undesirable for thermal processes. Knowledge of biomass chemical composition is a vital step toward determining the expected yields of biofuel or thermal energy from combustion. Plant genetics, environmental conditions, and agricultural management practices will influence constituent composition. The rate of polysaccharide formation during photosynthesis and the amount of inorganic substance absorbed from the soil are among the many factors that influence the heterogeneity and complex chemical composition of biomass species. 2,3 Due to such differences in biomass composition, feedstock pricing should be based on compositional value rather than just dry matter.
Compositional analysis of biomass is usually determined using standard wet chemistry protocols developed by the US Department of Energy's National Renewable Energy Laboratory (NREL). However, these protocols are time-consuming, expensive, and laborious. Uncertainty with regard to the repeatability of results with these wet chemistry protocols has also been reported. 4,5 Compositional variability of up to 3% has been reported when analysis was done by different technicians or in different laboratories using standard wet chemistry methods. 5 Spectroscopic techniques have become popular in recent years due to the increasing demand for faster and cheaper methods to determine chemical composition for product quality improvement in the food, pharmaceutical, and petrochemical industries. 6 Near-infrared (NIR) spectroscopy has been used for quantification of many biological materials. NIR spectroscopy often requires minimal or no sample preparation and allows for rapid, nondestructive quantitative analysis. 7
NIR calibration models to predict lignin, glucan, xylan, arabinan, and galactan have been developed for single biomass feedstocks such as corn (Zea mays) stover, rice (Oryza sativa) straw, and switchgrass. 8 –10 Since future cellulosic industries may use multiple or mixed feedstocks, it would be beneficial to develop NIR calibration models that can predict chemical composition for multi-species biomass feedstocks. Liu et al. showed that it is possible to have a broad-based model for biomass material using switchgrass, corn stover, and wheat (Triticum sativum) straw. 11 These materials are expected to have more dissimilarity in physical properties than different herbaceous/grass perennial species. No study on developing a model to predict the composition of multiple herbaceous perennial species has been reported.
Many advantages of Fourier transform near-infrared (FT-NIR) spectroscopy over dispersive spectroscopy have been reported. 12 –14 However, in recent years, the development of an advanced dispersive spectrometer diode array (DA) has been possible due to the availability of silicon-based sensors in linear arrays. DA spectrometers incorporate a DA detector as well as fiber optics that improve the energy throughput of the instrument. The array effectively contains hundreds of detectors that acquire a complete spectrum simultaneously, in contrast to conventional dispersive spectrometers. 15 The DA detectors enable many spectra to be collected from a single sample in a fraction of second. The diode also accumulates energy that enables the spectrometer to produce spectrum during low energy measurements by exposing the diode arrays. The fiber optics collect most of the reflectance spectra from the sample directly to a fixed grating in a monochromator, improving the energy throughput. 15 Due to these improved features, the DA is widely used in dispersive NIR instruments. 14
Once an NIR calibration model has been developed, many factors can affect the accuracy and precision of NIR prediction. Variations in particle size, cell thickness, and sample moisture content can arise during sample preparation and presentation, but these can generally be controlled. 16 –18 Providing a consistent, uniform surface when adding samples to the sampling cup is an ongoing challenge in sample presentation. 19 The primary objectives of this study were to develop an NIR model for mixed herbaceous perennials and to use the model to study the effect of sample presentation on chemical constituent prediction. The model was also used to study the influence of sampling time on NIR prediction, as no study has reported the degree to which NIR spectroscopy is stable over time. Lastly, the accuracy and precision of the model with respect to wet chemistry data were studied.
Materials and Methods
BIOMASS SAMPLE COLLECTION
Biomass samples were provided by the Central Grassland Research Extension Center (Streeter, ND). To increase the variability in chemical composition, samples were obtained from five locations across central and western North Dakota (Williston, Carrington, Minot, Hettinger, and Streeter). Williston plots were irrigated to give approximately 635 mm of water per year, while the other locations were non-irrigated. Species planted in monocultures or mixtures in these five locations in 2006 included two cultivars of switchgrass (SG) (Dacotah and Sunburst); intermediate wheatgrass (IWG) (Thinopyrum intermedium) cultivar Haymaker; tall wheatgrass (TWG) (T. elongatum) cultivar Alkar; two species of wild rye (WR), Magnar WR (Leymus cinereus) and Mustang WR (L. angustus); big bluestem (BB) (Andropogo gerardii) cultivar Sunnyview; alfalfa (AL) (Medicago sativa); and yellow sweetclover (CL) (Melilotus officinalis).
A total of 10 single and conglomerate species treatments were planted in these five locations across North Dakota (Table 1). Seven treatments from Williston (2009) and Minot (2008) were manually separated into leaf and stem fractions to increase constituent variability and sample number. These treatments included: Dacotah SG; Sunburst SG; Magnar and Mustang WR; Sunburst SG and BB; Sunburst SG and Mustang WR from Minot (2008); Sunburst SG and Mustang WR; and Haymaker IWG from Williston (2009). These samples had nearly equal proportions of leaf and stem tissues, which were easily separated. Therefore, 14 more samples (7 leaf and 7 stems) were obtained from this process, which were combined with the 51 samples identified in Table 1 to obtain 65 total samples. Of the 65 samples collected, 55 samples were used in the calibration and 10 samples were used as a validation set. Calibration and validation samples were randomly selected.
Biomass Samples Obtained by Treatment, Location, and Year of Harvest
Chemical Composition
Biomass samples were ground using a Wiley Mill Model 4 (Thomas Scientific, Swedesboro, NJ) with a 1-mm sieve size. The ground samples were fractionated to 0.18–0.85 mm particle size using mesh #20 and #80 ASTM E-11 standard sieves. These samples (-20/80 particle size) were used for NIR analysis and for determination of moisture, ash, lignin, glucan, xylan, arabinan, and galactan. Compositional analysis was performed using the NREL analytical procedures. 20 –22 The chemical composition and NIR calibration model development procedures are illustrated in Fig. 1.
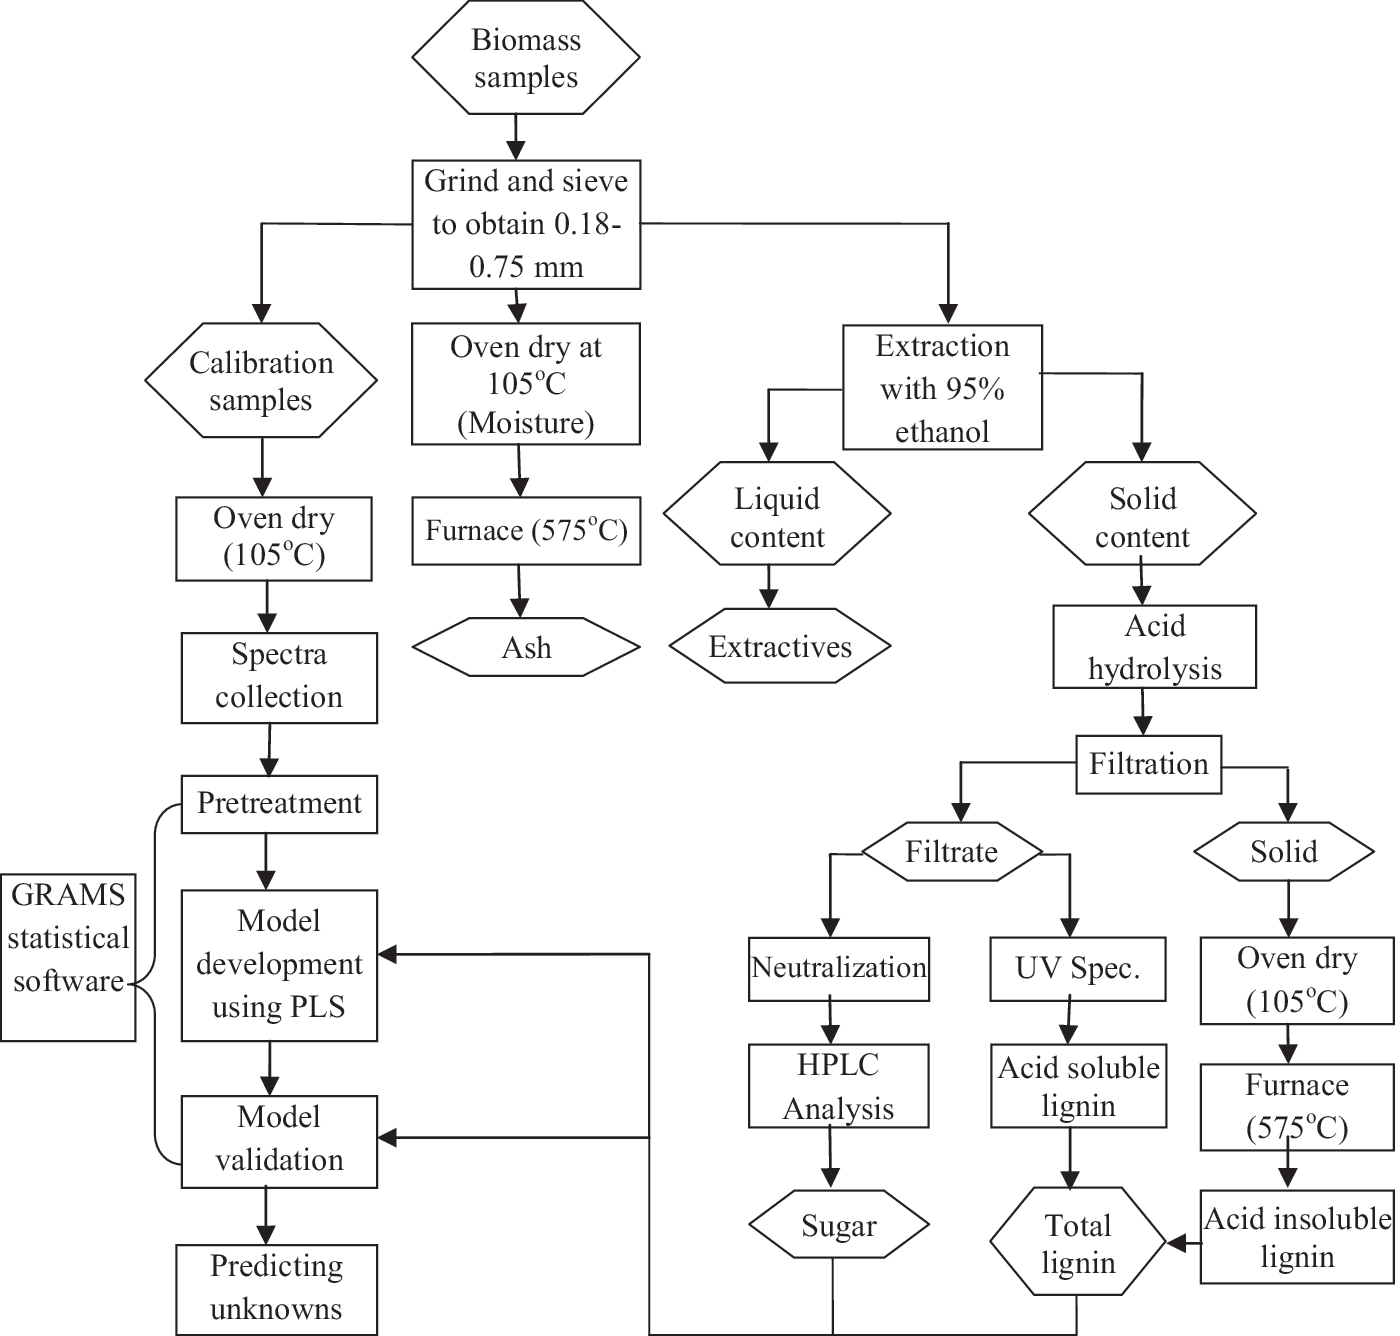
Flow chart of experimental procedure.
Non-structural components such as chlorophyll, waxes, and other minor components in biomass were removed with 95% ethanol using an automated ASE 200 solvent extractor (Dionex, Sunnyvale, CA) set at 100°C and 10.3 MPa for 5 min heating time and 7 min static time. Dried extractives-free biomass samples (0.3 g) were hydrolyzed in 72% sulfuric acid (EMD Chemicals, Darmstadt, Germany) at 30°C for 1 h. The slurry was diluted to 4% sulfuric acid and further treated in an autoclave (Consolidated Stills & Sterilizers, Boston, MA) at 121°C for 1 h. The filtrate of the hydrolyzed biomass was neutralized with calcium carbonate (EMD Chemicals) and sugar concentrations (glucose, xylose, arabinose, and galactose) were obtained using high performance liquid chromatography (HPLC, Waters Corporation, Milford, MA) with an Aminex HPX-87P (300×7.8 mm) carbohydrate column (Bio-Rad Laboratories, Hercules, CA) running at 85°C using 18 mΩ nanopure water as the mobile phase. Sugar peaks were detected by a refractive index detector, Model 2414 (Waters Corporation) at 50°C and quantified using 4-point external standard curves.
Filtrate (1–2 mL) was used to determine acid soluble lignin (ASL) using an ultraviolet spectrophotometer (Varian, Santa Clara, CA) at 205 nm. The solid components after hydrolysis were dried in an oven at 105°C for 4–6 h and put into a furnace at 575°C for 4–6 h to determine acid insoluble lignin (AIL). The values for AIL and ASL were added to obtain the total lignin content. During carbohydrate and lignin quantification, six samples were analyzed concurrently; one sample—Alkar TWG, Williston 2009 harvest—was included in all batches to measure reproducibility of compositional analysis methods.
Nir Spectra Acquisition For Model Development
Samples were oven dried at 105°C for 4–6 h before spectra acquisition. A DA 7200 NIR spectrometer (Perten Instruments, Springfield, IL) was used to collect spectra for all samples. The spectra were collected from 950 nm to 1,650 nm wavelength with a scan resolution of 5 nm. A non-NIR absorbing Teflon small sampling dish (diameter 75 mm, depth 7.6 mm) was used. Approximately 6 g of each sample were scanned in duplicate, and again after repacking (refilling of the sampling cup), also in duplicate. The four spectra obtained for each sample were averaged on exportation of spectral data. Averaging the spectra helps reduce the total number of spectra and processing time during calibration development. The data were exported to Thermo Fisher Scientific (Waltham, MA) GRAMS statistical software for model development.
Multivariate Calibration
Partial least square (PLS) regression was used to build a multivariate calibration for lignin, glucan, and xylan in GRAMS IQ v9.0. Within the PLS, cross-validation was used as it optimizes the model with variability in constituent values. Cross-validation is done by removing and predicting one sample until all samples have been excluded and predicted once. The spectra were variance-scaled before a pre-processing method was selected. Variance scaling gives all values equal weight by emphasizing small variations in spectral data. A spectral region of 1,100 nm to 1,650 nm was selected during model development because Shenk et al. showed that lignin, glucan, and xylan are absorbed above 1,100 nm. 23 Savitzky-Golay first-order derivative method, which is a part of GRAMS software, was used with the standard normal variant detrending pre-processing method. Outliers were excluded after identification using spectral residual and concentration residual plots.
Evaluating The Influence Of Sampling Time And Repacking
The NIR calibration models developed to predict lignin, glucan, and xylan were installed into the NIR spectrometer. These models were used to test variability in compositional prediction based on sampling time and repacking. Three grass samples—Haymaker IWG and Alkar TWG (Williston 2010), sample 1; Dacotah SG stem only (Minot 2008), sample 2; and Sunburst SG (Streeter 2008), sample 3—had a strong prediction for at least two of the three constituents during validation and were used to test the effect of sampling time and repacking. Samples were oven dried at 105°C for 4–6 h and stored in a desiccator before prediction. To test variability due to sampling time and repacking, prediction was done 10 times under the following conditions: at 30-min intervals on a single day with no repacking in between readings; at 30 min intervals on a single day with repacking; and single readings over 10 successive days with repacking and powering off the instrument after each day. Each individual reading was completed in duplicate without repacking.
Statistical Analysis
The regression coefficient (R2), root mean square errors of prediction (RMSEP), and ratio of the range of dataset (R) to standard error of prediction (SEP) were used for model evaluation based on standards developed by the American Association of Cereal Chemists (AACC). 24,25 Coefficient of variation (CV) was used to evaluate variability of NIR spectroscopy based on standards from Williams. 25
Results and Discussion
Model Evaluation
NIR calibration models were developed to predict lignin, glucan, and xylan contents for herbaceous perennial biomass species. Calibration models were not developed for galactan and arabinan because they accounted for less than 5% of total mass according to wet chemistry analysis and standard errors were relatively high. The compositional range for lignin, glucan, and xylan used for NIR calibration and validation is presented in Table 2. The range of constituent values was similar to previously published reports for several varieties of switchgrass and big bluestem. 9,11,26
Summary of Wet Chemistry Data for All 65 Biomass Samples
During model development, some samples were detected as outliers and were removed using spectral and concentration residual plots. Due to outlier removal, the number of samples used for the calibration models were 45, 46, and 46 for lignin, glucan, and xylan, respectively. Outliers may have arisen from either anomalies in wet chemistry results or spectral data. Some biomass samples were affected by static electricity during spectra collection, and this may have influenced their spectra data as reported. 17,27
Figs. 2 and 3 show the correlation between the wet chemistry and the predicted values for both the calibration and validation sets. As expected, the R2 for the validation set was somewhat lower than for the calibration set for all three constituents. The AACC developed evaluation criteria using R/SEP to validate NIR calibrations. 24 They stated that a model with R/SEP≥4 is fair and acceptable for screening, R/SEP≥10 indicates a good and acceptable model for quality control, and R/SEP≥15 indicates a very good model acceptable for research quantification. Williams proposed guidelines for using R2 to validate NIR models in which an R2 of 0.66–0.81 should be used for screening and approximate calibration, a model with R2 of 0.83–0.90 is good for quality assurance purposes but should be used with caution, and a model with R2≥0.92 is very good for quality assurance. 25 Table 3 shows the parameters obtained in this study to evaluate the NIR model developed. Based on AACC standards, R2 values in Table 3 indicate that the models for lignin and xylan are acceptable for quality assurance, while the glucan model was slightly below the acceptable limit. These values were slightly lower than those reported elsewhere for single feedstocks such as corn stover (lignin 0.92; glucan 0.85; xylan 0.90), rice straw (lignin 0.89), and switchgrass (lignin 0.98; glucan 0.93; xylan 0.94], although models developed here were for multi-species biomass samples. 8,28,29
Statistics for Model Calibration and Validation
SEP=standard error of prediction; R/SEP=ratio of R (range of the validation dataset) to SEP; R2=coefficient of determination; RMSEP=root mean square error of prediction.
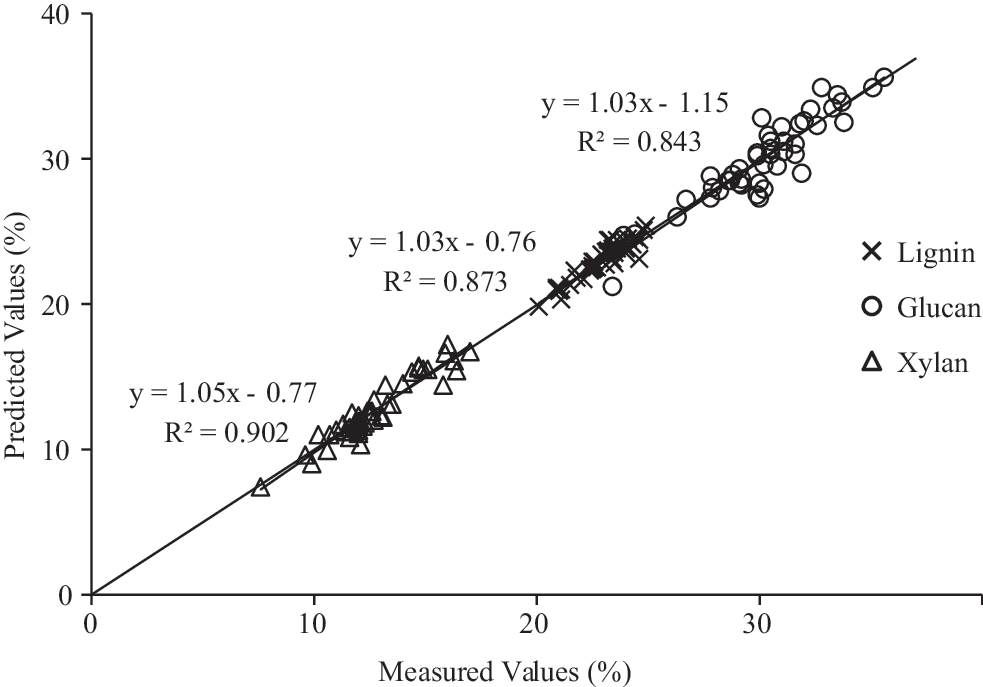
Chemical composition of perennial biomass species predicted by NIR calibration model versus measured values from wet chemistry method of the calibration set.
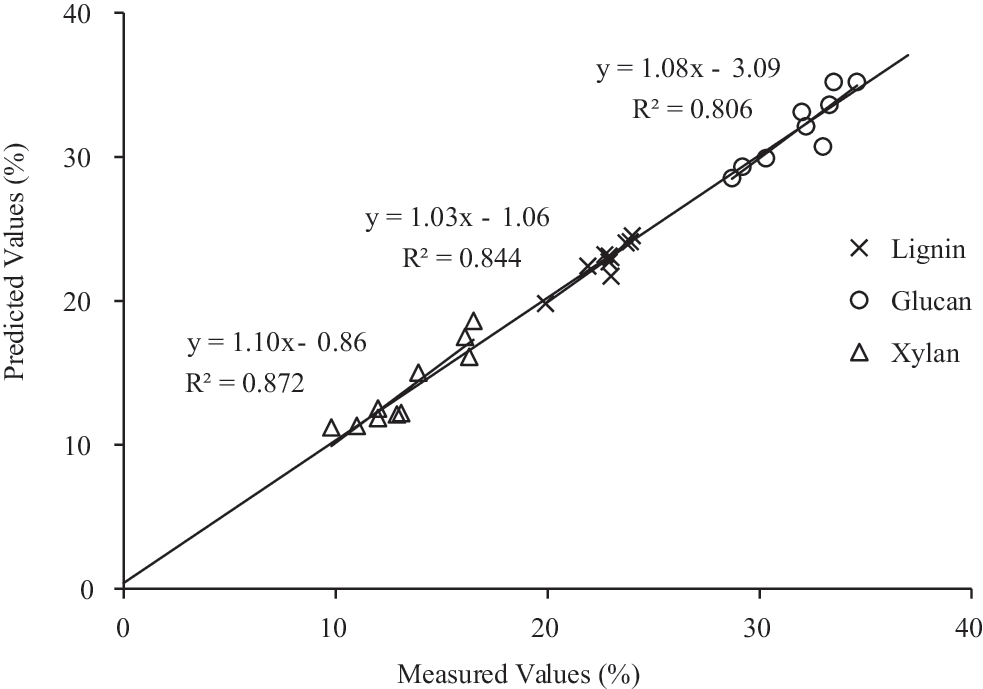
Chemical composition of perennial biomass species predicted by NIR calibration model versus measured values from wet chemistry method of the validation set.
Another statistical parameter for evaluating the models is RMSEP. Lower RMSEP values indicate stronger calibrations. RMSEP values for lignin and xylan of up to1.12 and 1.03, respectively, were reported for a corn stover model. 10 Both the RMSEP and R2 values indicated that the models were good when compared to the single biomass models that have been reported. Upon validation, the RMSEP for glucan (0.77) and xylan (0.46) reported in the broad-based model of Liu et al. were better than the values of 1.12 and 0.97, respectively, reported in this study (Table 3), while the value for lignin (0.81) was higher than that found in this study (0.54). 11 The different wavelength ranges and spectrometers used may have led to the higher RMSEP for glucan and xylan models reported here. The wavelength range used in this study was between 950 nm and 1,650 nm, limiting glucan and xylan spectra to the first and second overtone bands. Liu et al., however, used a wavelength range of 1,000 nm to 2,500 nm. 11 The absence of the combination band (1,800 nm to 2,500 nm) of O-H and C-H stretching, which are important for carbohydrate prediction, may have reduced the performance of glucan and xylan models. 30 In the case of lignin, the combination band is found between 1,100 nm and 1,650 nm, which is why lower RMSEP and higher R/SEP values were observed for the lignin model.
The use of different NIR instruments in the two studies could also be a factor. In this study, an advanced dispersive NIR spectrometer was used as opposed to FT-NIR in the report by Liu et al. 11 Both instruments have higher energy throughput than conventional dispersive spectrometers, but an FT-NIR spectrometer can collect spectra faster and at lower resolution than a DA NIR spectrometer. However, the R2, RMSEP, and R/SEP from this study showed that it is still possible to develop satisfactory calibration models to predict chemical composition for mixed perennial biomass using DA NIR spectroscopy.
Influence Of Sampling Time And Repacking On Nir Prediction
After validation, the calibration models were combined and installed into the Perten DA 7200 spectrometer. Of the 65 samples, three were used to test the influence of sampling time and presentation (packing) in NIR prediction. These samples were selected based on how best the models predicted at least two of the three constituents (lignin, glucan, and xylan) when prediction was done 10 times daily (Figure 4). The daily data were used because they can be affected by variability in both repacking and time. Apart from the xylan content of sample 1, the differences between the NIR prediction and measured values were less than 2%. The model accurately predicted glucan for samples 1 and 3, with differences between measured and predicted values of 0.4% and 0.2%, respectively. Predicted lignin contents were within 1% and 2% of measured values for all three samples.
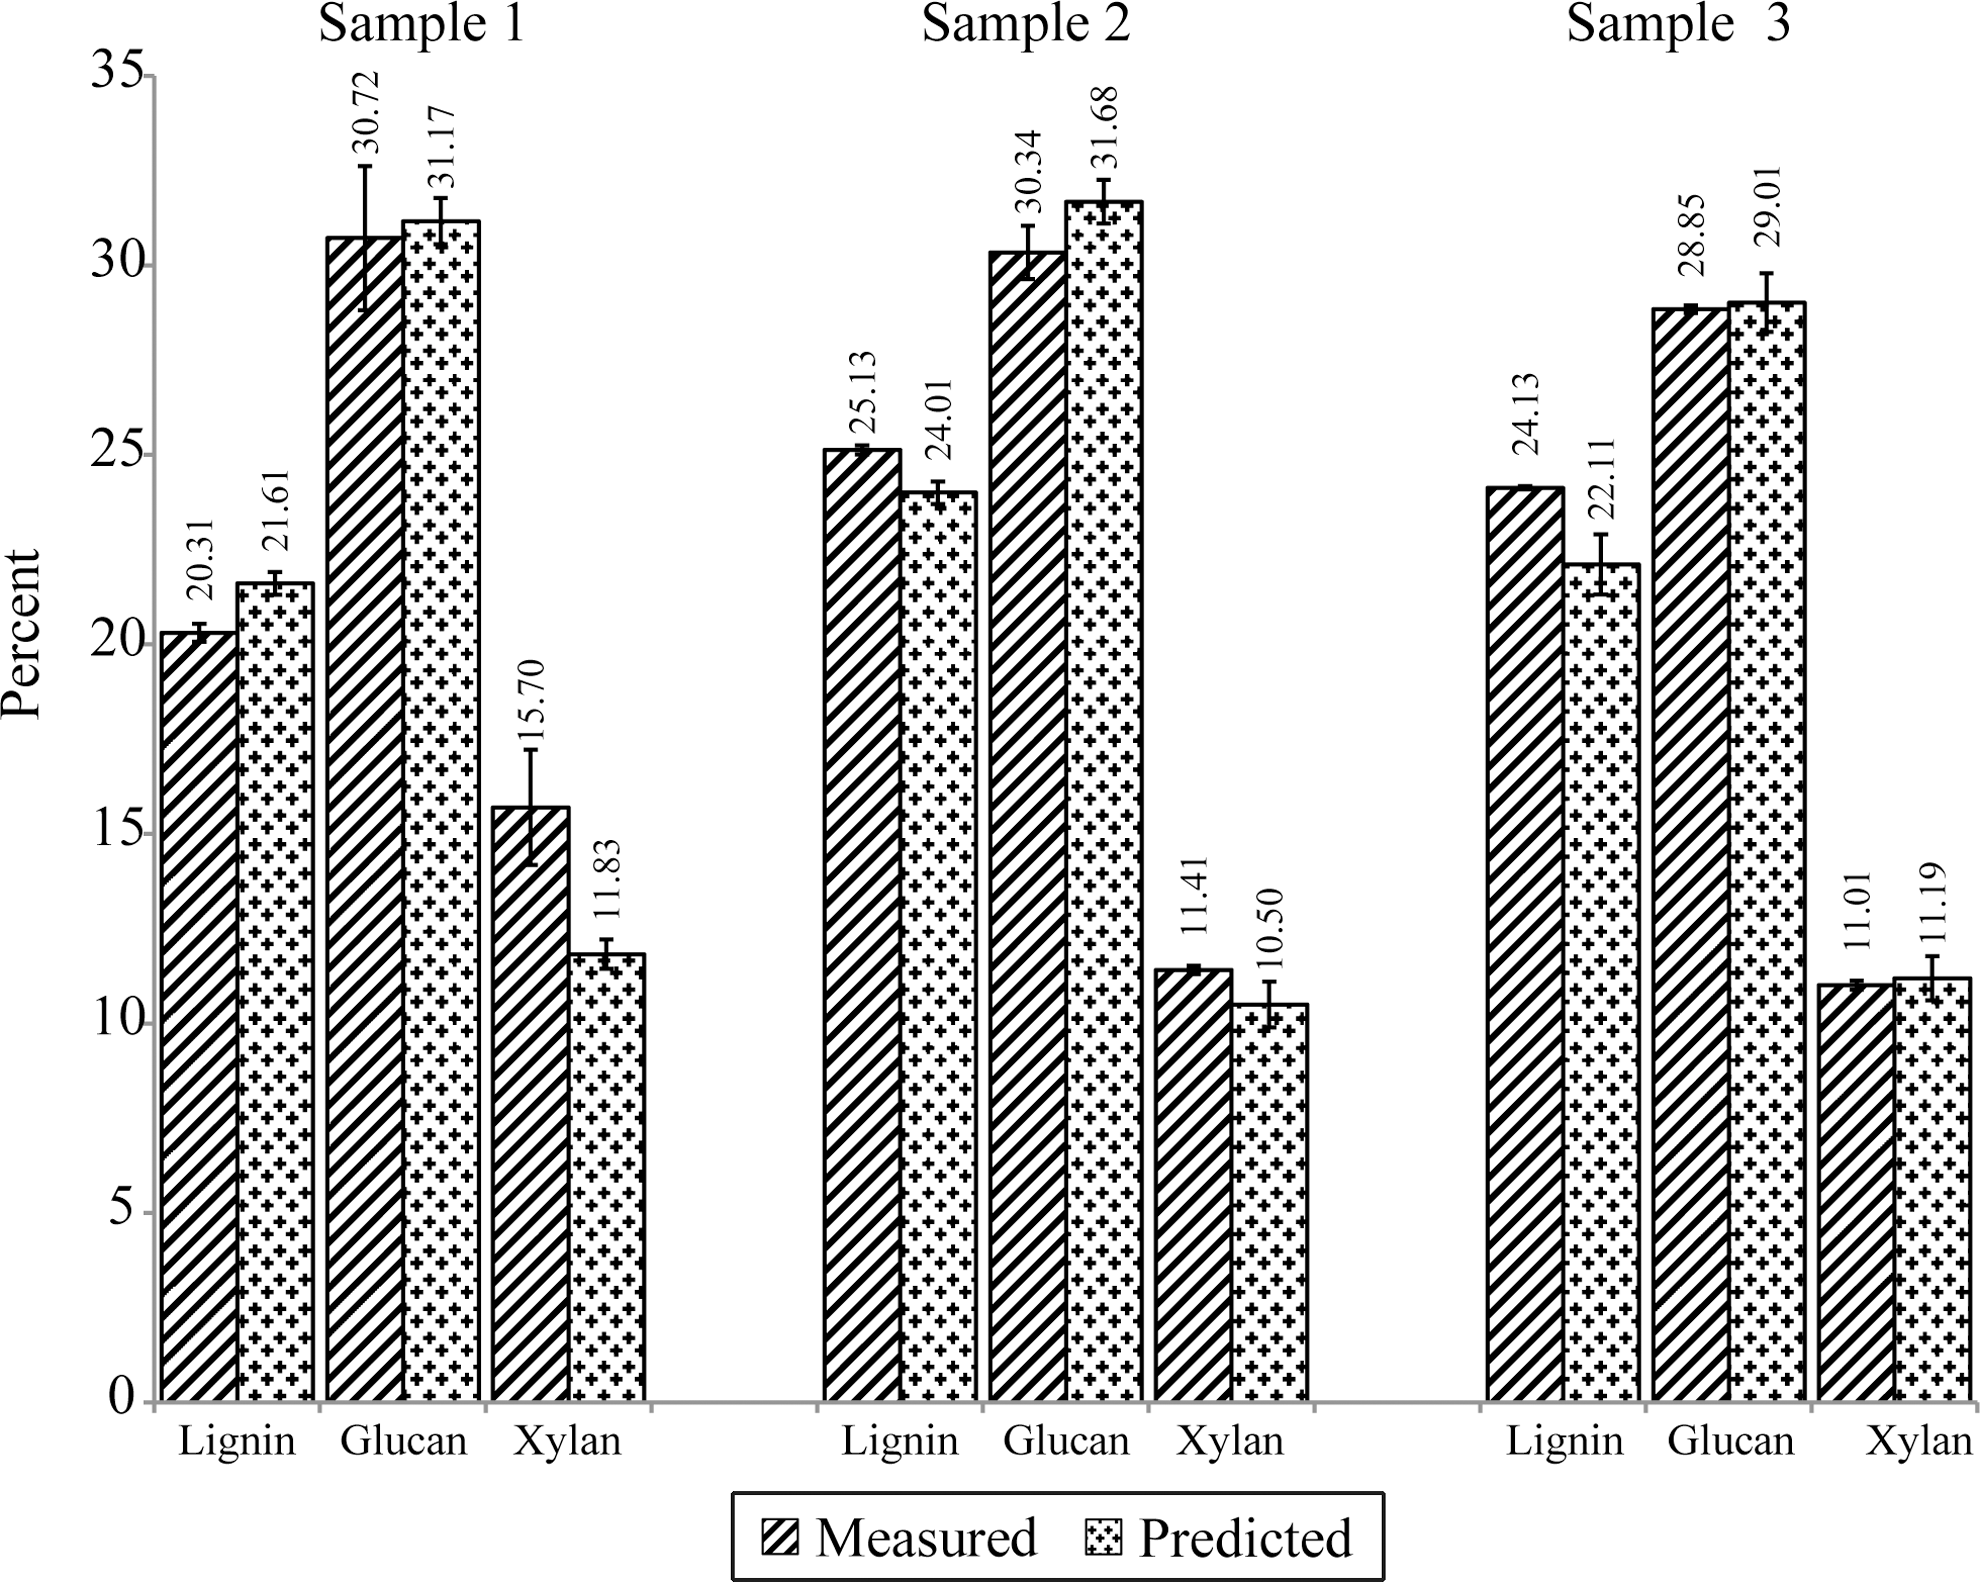
Comparison of NIR prediction and wet chemistry measurements of composition for three selected biomass samples; prediction was done 10 times daily. Sample 1: Haymaker IWG & Alkar TWG (Williston 2010); Sample 2: Dacotah SG stem only (Minot 2008); Sample 3: Sunburst SG (Streeter 2008). Error bars represent standard deviation.
Spectroscopic models were used to study prediction variability in terms of time and presentation. Tables 4 , 5 , and 6 summarize the results for predictions completed 10 times after every 30 minutes without repacking, 10 times on the same day with repacking, and 10 times daily with repacking, respectively. All of the CVs were less than 4%, except for the xylan content of sample 2 (6.15%) (Table 6). Based on guidelines for interpreting the CV, the repeatability of NIR prediction was good to exceptional. 25 As expected, the repeatability of NIR prediction without repacking (Table 4) was better than prediction done with repacking (Tables 5 and 6); however, repacking itself had a relatively small impact. Variations shown in Table 4 were all lower than those seen in Tables 5 and 6, except for the lignin content of sample 1. This shows that the NIR instrument is generally stable throughout the day.
NIR Prediction for Three Biomass Samples Done 10 Times after Every 30 Minutes without Repacking
Haymaker intermediate wheatgrass and Alkar tall wheatgrass (Williston 2010)
Dacotah switchgrass stem only (Minot 2008)
Sunburst switchgrass (Streeter 2008)
NIR Prediction for Three Biomass Samples Done 10 Times with Repacking on the Same Day
Haymaker intermediate wheatgrass and Alkar tall wheatgrass (Williston 2010)
Dacotah switchgrass stem only (Minot 2008)
Sunburst switchgrass (Streeter 2008)
NIR Prediction for Three Biomass Samples Done 10 Times Daily with Repacking
Haymaker intermediate wheatgrass and Alkar tall wheatgrass (Williston 2010)
Dacotah switchgrass stem only (Minot 2008)
Sunburst switchgrass (Streeter 2008)
Although it is recommended to leave the DA spectrometer running overnight, the stability of the instrument over a period of days rather than hours was also tested with powering off overnight (Table 6). Mean CV for the components was 2.9% (Table 6), only slightly higher than the mean CV of 2.7% from Table 5. These results show that variability due to presentation (repacking) alone was approximately the same as for instrument variability in predicting over time (hours and days).
Accuracy And Precision Of Wet Chemistry Versus Nir Data
The assumption used when developing and validating an NIR model is that data determined via wet chemistry methods are accurate values. However, data variability using NREL wet chemistry methods has been reported. 5 CVs of 1–3% in composition for glucan, xylan, lignin, and extractives were reported when the same biomass sample was analyzed several times by different analysts and in different laboratories. Confidence intervals (98%) of±1% for lignin and±1.5% for glucan and xylan for biomass composition have also been published. 4 A control sample of Alkar TWG (Williston 2009) was used in this study to compare uncertainty during compositional analysis. After eight replications of wet chemistry analysis on that sample, 95% confidence intervals for lignin, glucan, and xylan were 23.3±0.7%, 32.7±1.1%, and 13.2±1.7%, respectively. The ranges were 22.3–24.1%, 30.8–35.0%, and 10.7–15.8% for lignin, glucan, and xylan, respectively, indicating the potential for error when performing a single wet chemistry analysis. Increased confidence in wet chemistry analysis results requires several repetitions over a period of weeks.
Figure 5 shows a 95% confidence interval plot constructed with MINITAB 16 (Minitab, State College, PA) using the wet chemistry and NIR prediction data (eight times daily with repack) for the control sample. The confidence interval for lignin and xylan shown in Figure 5 were in the same range for both the wet chemistry analysis and NIR model prediction. The prediction interval for glucan using both methods showed slightly different ranges of values. However, the glucan model was not as good as models developed for lignin and xylan. For all constituents, the NIR predictions are more likely to be accurate because the models were developed with at least 45 biomass samples. Once an NIR model is developed, its precision is stronger than wet chemistry method. Williams and Norris also confirmed that NIR prediction is often superior to the wet chemistry method in terms of precision. 27 If wet chemistry analysis is done once, the probability of getting an inaccurate value is higher than if using NIR spectroscopy since errors can more easily occur in the labor-intensive wet chemistry process than with NIR spectroscopy.
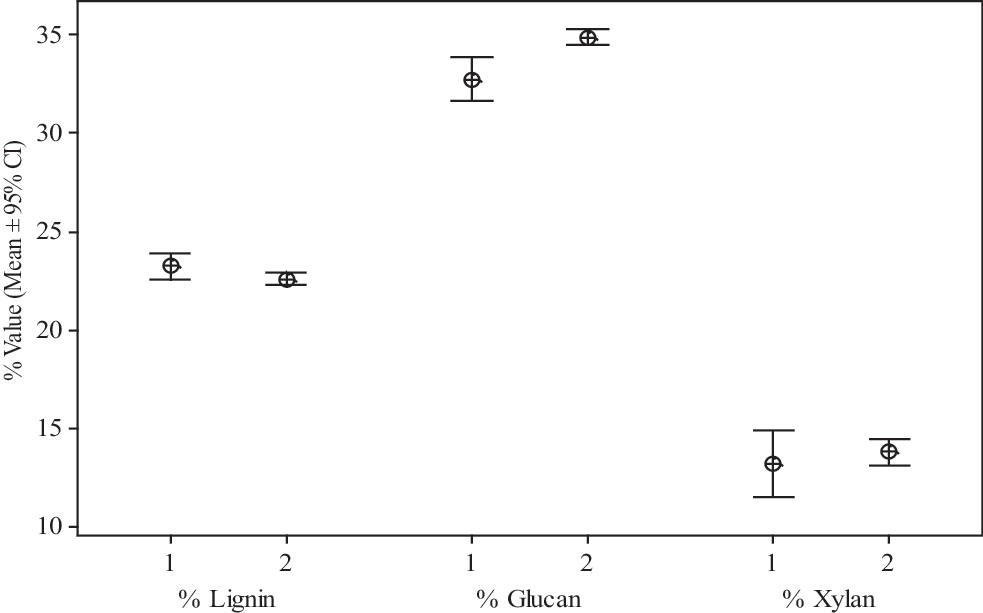
95% confidence interval plots for lignin, glucan, and xylan using wet chemistry
Conclusions
This study demonstrated that it is possible to develop an NIR calibration model for mixed perennial biomass species as the values of R2, RMSEP, and R/SEP were reasonable when compared to models developed for single feedstocks. The NIR instrument was stable over time (hours and days) in predicting the chemical constituents of perennial biomass as the CV was lowest without repacking. The variability due to repacking alone was approximately the same as the variability observed for the instrument over time. Variability, as measured by the CV, was generally lower for repeated NIR predictions than for wet chemistry analysis, whereas the means were generally in the same range. Factors affecting the variability of NIR calibration, such as particle size, ambient temperature, and moisture, are easily controllable; therefore, if reliable reference data are obtained, an accurate calibration model for mixed biomass species can be developed.
Further research to improve these models for mixed perennial biomass can be done by using an NIR instrument with a faster scan rate, better resolution, and spectra including wavelengths up to 2,500 nm. Increasing the number of samples would also further increase the performance of these models.
Footnotes
Acknowledgments
The authors would like to acknowledge help from Nurun Nahar and Bishnu Karki with biomass compositional analysis. This study was funded through grants from the North Dakota Natural Resources Trust and the US Department of Agriculture-National Institute of Food and Agriculture (USDA-NIFA, Agreement #2010-34622-20794).
Author Disclosure Statement
No competing financial interests exist.