




Abstract
The toxicity of silver nanoparticles to bacteria, while frequently demonstrated in laboratory settings, has not been well established within environmental media. This study investigates the effect of three different silver nanoparticles (35–60 nm, uncoated and coated with 0.3% polyvinylpyrrolidone) at various concentrations (1, 10, or 100 mg/L) on the microbial-facilitated soil denitrification process using native bacteria in a soil (Toccoa sandy loam) environment. The sorption of silver nanoparticles onto soil was observed through an isotherm study. It was found that silver nanoparticles exhibited much less toxicity to the denitrifying bacterial community than was expected. The toxicity was not correlated with either coatings or particle size; instead, only one type of larger silver nanoparticle (uncoated 50-nm silver particles) exhibited any toxicity, and only at a very high (100 mg/L) concentration. Toxicity was linked, however, to the silver nanoparticle affinity for soil surfaces (Kd), as determined through the isotherm study. The particle with the lowest Kd value was also the only toxic silver nanoparticle. This study is novel in its observation of silver nanoparticle toxicity to a bacterial community in a soil environment. The results of this study highlight the importance of environmental media in nanoparticle studies and the need for nanoparticle partitioning studies in terrestrial environments.
Introduction
One of major pathways for AgNPs to enter the terrestrial environment is via agricultural amendments of sewage sludge generated from wastewater treatment plants. Silver concentration in sewage sludge is highly variable, though concentrations have been documented as high as 960 mg/kg. 6 The EPA regulates the application of sewage sludge to agricultural lands based on the annual loading rate of specific heavy metals such as arsenic, cadmium, and mercury. However, total Ag applied to agricultural lands is not yet regulated. 7 A recent modeling scenario composed by Blaser et al., estimates that Ag is being applied to US agricultural fields via sewage sludge in the amount of 80–190 mg/yr. 8 It is possible that unexpectedly high levels of Ag in land application could be perturbing important microbially mediated processes in the soil such as nutrient cycles.
To assess the impact of AgNPs on the terrestrial environment, the soil denitrification process was chosen in this study because of the importance of global nitrogen biogeochemical cycles in removing excess nitrogen from anaerobic environments (e.g., anaerobic soils). Denitrification occurs by the bacterial transformation of nitrate into nitrite, and then into nitrogen gas and other gaseous forms of nitrogen (N2O(g), NO(g)). While denitrification supports the steady flux of gaseous nitrogen in the atmosphere, it is also essential to protect human and ecosystem health. Denitrification reduces surface and groundwater nitrate concentrations and will prevent eutrophication in surface waters, as well as reduce the risk of methemoglobinemia in infants. 9 Denitrification is also essential in removing excess nitrite (NO2 −) from agricultural soils to prevent NO2 − toxicity to plants. 10 To assess the effect of AgNPs on the denitrification process, batch biogeochemistry experiments were coupled with kinetic modeling.
Materials and Methods
Materials
The following three manufactured AgNPs were chosen for this study: uncapped 35 nm, uncapped ∼50 nm, and polyvinylpyrrolidone (PVP) capped ∼60 nm, abbreviated as uAg35, uAg50, and pAg60, respectively, and described in Table 1. These NPs were selected to investigate the effect of PVP capping agent on ∼50 nm AgNPs, and the effects of size in two uncapped AgNPs (35 nm vs. 50 nm). To verify the manufacturer's reported size of each AgNP, we conducted particle size analysis using high-resolution transmission electron microscopy (TEM) to examine more than 100 individual particles per AgNP type, following the method used by Ma and et al. 11 Sonified stock solutions of each AgNP were dispersed onto copper grids and allowed to dry for at least 24 hr prior to observation. A Student's t-test was used to determine whether the AgNP types were significantly different from each other in terms of size.
Characteristics of Silver Nanoparticles
Based on average particle size and/or abundance of capping agent.
Estimated from transmission electron microscopy analysis; density, and capping agent information obtained from the manufacturer.
uAg35 significantly smaller than uAg50 (p<0.01) and pAg60 (p<0.001).
uAg50 not significantly different in size than pAg60 (p>0.05).
A South Carolina Toccoa entisol (surface soil: top 10–30 cm, coarse-loamy, thermic typic Udifluvents) from a local certified organic farm was chosen for the denitrification experiments. Physicochemical characterization of the soil was carried out, including % organic matter, pH, mineralogy, texture, and cation exchange capacity. 12 –14 The moisture content of the soils was kept at the field capacity (volumetric water content=0.33 cm3/cm3) at ∼3±0.2°C prior to denitrification experiments.
Denitrification Kinetic Experiments
Approximately 50 g of moist soil (equivalent to 40.95 g oven dry soil) was placed into a 250-mL Nalgene polypropylene bottle for each denitrification batch. All bottles were kept in an argon-filled glove bag for the duration of the experiment to maintain an anaerobic environment. All batch denitrification experiments were conducted in duplicate. All reagents were prepared using distilled deionized water (18MΩ).
A total of 200 mL of solution was added to each test bottle. Within the 200 mL, nitrate was added as NaNO3 at a concentration of 50 mg/L as nitrogen. Our preliminary experiments suggested that this initial concentration of nitrate was sufficient to promote denitrification. To maintain appropriate ionic strength, the solution contained 0.005 mol/L Na2SO4. We chose a sulfate-based electrolyte because it does not cause any interference with the nitrate-specific ion selective electrode (ISE) used. Finally, the solution contained 1% glucose as a carbon source for the bacteria. A large amount of glucose ensures that electron acceptors, rather than carbon sources, will be the limiting factor in microbial growth. In addition, this high concentration will also act to speed up oxygen depletion by the facultative aerobic bacteria, decreasing the time needed for reducing environments to take over. The bottles were gently agitated daily, by hand, in the glove bag. Denitrification was allowed to occur by the native bacteria present in the soil for 2 to 8 days. Nitrate concentration was measured every 4 to 10 hours via 5 mL samples taken from each bottle, filtered at 0.45 μm using syringe filters, and tested for NO3 − using a nitrate ISE (detection limit of 0.4 mg/L NO3 −-N). During these sample times, pH and reduction Eh (reduction potential, mV) values were measured in the well-mixed soil suspensions using pH and redox potential electrodes, respectively.
Silver toxicity to native denitrifying bacteria was measured through the addition of various AgNPs listed in Table 1 to individual denitrification batches. A known volume of 20 g/L AgNP was added to compare antimicrobial effects at various [Ag]total (i.e., 1, 10, and 100 mg/L). The experiments with higher Ag concentrations were conducted because our preliminary experiments suggested that AgNPs were not toxic to denitrifying bacteria at lower concentrations.
The kinetic rate of nitrate depletion was evaluated using a zero-order kinetic reaction model. This is a common approach to modeling denitrification processes in soils and water systems due to the independence of the rate of nitrate depletion from the initial nitrate concentration.
10,15
–17
While alternate methods of nitrate consumption (i.e., as an electron acceptor during anaerobic ammonia or methane oxidation) have been observed in marine ecosystems, this has rarely been reported in uninoculated soil environments. If one assumed that such processes were occurring at the rates reported by Zhu et al., the contribution of total nitrate depletion by these alternate methods would be estimated to be <1% of the nitrate that we measured in our soil system.
18
Therefore, it is reasonable to infer that effectively all of the nitrate depletion under these conditions is the result of the denitrification process. The rate of denitrification kinetics can be determined using the following equation:
where N=nitrate concentration (mg/L), X=concentration of soil solids (mg/L), and k=the specific denitrification constant (mg NO3 −-N·mg solids−1·time−1). 17 Since these experiments were performed in batch systems, the concentration of soil solids, X, remains constant over time. The values for k were determined through linear best-fit analysis of graphs displaying nitrate concentration over time (Fig. 1). While denitrification experiments were conducted in duplicate, the k value for each sample was calculated individually and later averaged for both samples within the treatment. For this reason, only one replicate of each treatment is shown in Fig. 1. Initial measurements may be affected by lingering aerobic bacteria in the system. Under aerobic conditions, ammonia is easily oxidized to nitrite by common soil bacteria such as Nitrosomonas spp. This conversion is typically followed by the oxidation of nitrite to nitrate, performed by common soil bacteria of the genus Nitrobacter. 19 For this reason, the highest nitrate concentration measured may be>50 mg/L due to nitrification action by the native aerobic soil bacteria. In the linear equation fit analysis, the starting point was assigned to the highest measured nitrate concentration (range=50.0 to 64.7 mg/L NO3 −-N), and k calculation data conclude with 90% nitrate depletion. At that point, some anaerobic bacteria may begin to use sulfate as an electron acceptor, converting it to sulfide, as sulfate oxidation is the next most energy-rich electron acceptor after nitrate. Sulfide is a known cause of interference in our ISE, and for this reason, 90% nitrate depletion was chosen as the endpoint in this study.
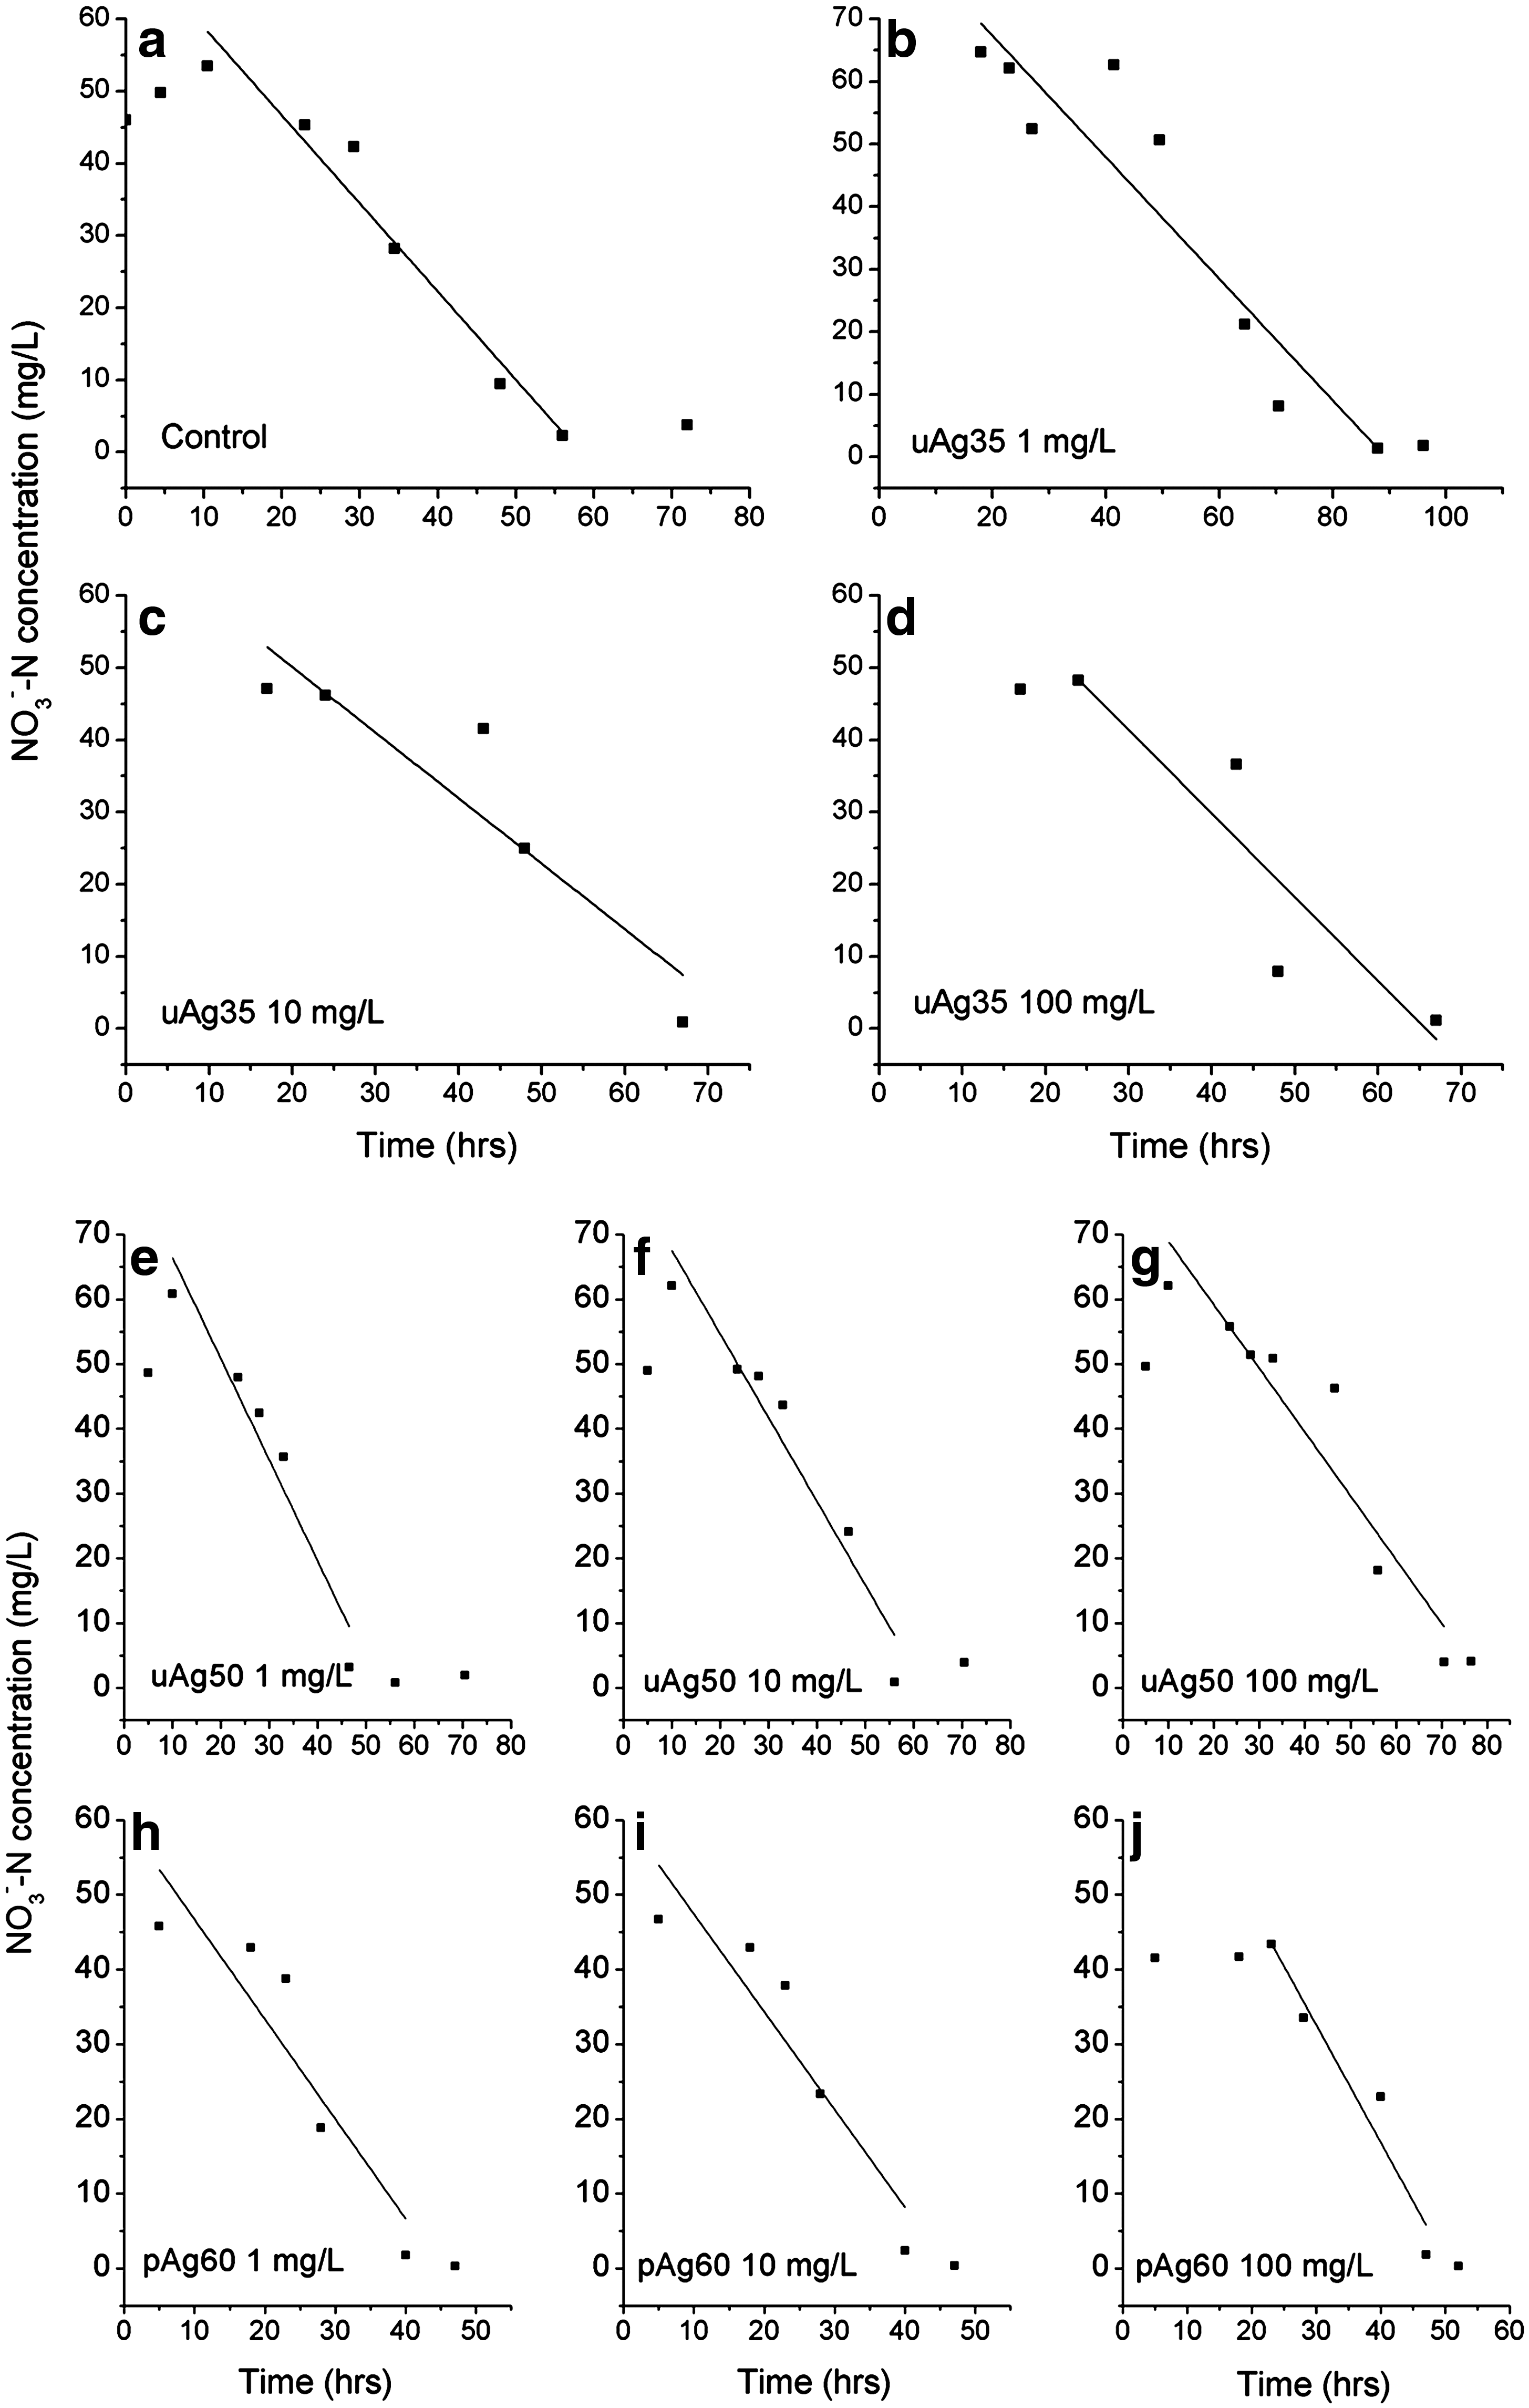
Denitrification kinetics displayed as nitrate depletion over time for one individual batch reaction vessel per treatment condition. Denitrification occurred via native soil bacteria in an anaerobic environment. Line represents zero-order kinetic modeling and corresponds to values listed in Table 2. Each graph represents a different reaction condition: a) control; b) through d) uAg35 at 1, 10, and 100 mg/L, respectively; e) through g) uAg50 at 1, 10, and 100 mg/L, respectively; and h) through j) pAg60 at 1, 10, and 100 mg/L, respectively.
Texture, Physicochemical Properties, Organic Matter, and Clay Mineralogy of Toccoa Sandy Loam Surface Soil
K=kaolinite, HIV=hydroxyl interlayer vermiculite, H=hematite, G=goethite.
OM=organic material.
cmolc/kg; K=potassium, Ca=calcium, Mg=magnesium.
Sorption Isotherm Experiments
To assess the affinity of AgNPs for soils during the denitrification experiments, AgNP sorption isotherm experiments in soils were conducted (soil suspension density, 33 g/L; ionic strength, 0.005 mol/L=Na2SO4). The experiments were carried out to determine the overall distribution coefficient, or Kd , which provides a ratio of sorbed to unsorbed concentrations. Adequate amounts of AgNP stock suspensions (20 g [Ag]total/L), which were freshly prepared for each batch, were sonified and then added to soil solutions to make the [Ag]total concentrations of 10 to 500 mg/L. Samples in 50-mL Oak Ridge polycarbonate centrifuge tubes were agitated on an end-over-end shaker at 12 rpm for 48 hours. To separate the unreacted NPs from soils no filtration techniques were used for any AgNP samples due to the affinity of PVP-capped AgNPs for the carbon comprising the filter paper. Instead, an adapted version of Stokes' law was used to separate AgNP-associated soils from unsorbed AgNPs. 20 The uAg35, uAg50, and pAg60 samples were spun at approximately 16,000 × g for 18 minutes (uAg35 samples) or 10 minutes (uAg50 and pAg60) on a Marathon 21K high speed centrifuge (Fischer Scientific, Inc., Pittsburgh, PA). This centrifugation method was validated via digestion of aliquot collected from preliminary low-speed centrifugation experiments. The aliquot was removed and acidified in 7 M HNO3 for 7 days. Samples were then analyzed for dissolved Ag using inductively coupled plasma atomic emission spectroscopy (ICP-AES). All treatments were conducted in duplicate.
Total Ag sorbed onto soil surfaces was calculated through a mass balance calculation using the initial [Ag]total concentrations, along with equilibrium concentration obtained via ICP-AES. Following the creation of sorption isotherms, the Freundlich equation was used to obtain Kd values for each AgNP, by plotting the log10-scale sorbed and equilibrium concentrations. This model is appropriate for AgNPs due to its implication that sorption is independent of surface coverage. 21
Results and Discussion
Soil Characterization
The results of the physiochemical characterization of the soil are summarized in Table 2. It has a sandy loam texture and cation-exchange capacity (CEC) of 7.4 cmolc/kg. The moderately acidic pH of the soil (5.2±0.2) is attributed to ∼70% acid saturation. Calcium was a dominant exchangeable cation. Quartz was predominant in sand and silt fractions, and kaolinite, hydroxyl interlayer vermiculite, gibbsite, hematite, and goethite were identified in the clay fraction. Organic matter content was 1.53%.
AgNP Characterization
Particle size analysis via TEM revealed large standard deviations in particle size for each of the three AgNPs studied (Table 1), indicating a polydisperse distribution. The results of the t-test showed that while uAg35 was significantly smaller than both uAg50 and pAg60, the two larger AgNPs (uAg50 and pAg60) were not significantly different from each other in size.
Denitrification Kinetic Experiments
Fig. 1 displays the denitrification data as nitrate depletion over time for one repetition of each treatment condition. Another set of data is not shown but was used in the statistical analysis discussed below. pH values varied somewhat from soil pH (5.5±0.5). All redox measurements were strongly oxidizing at t=0 (∼+250 mV). Once denitrification began, redox measurements progressed from neutral (∼0 mV) to strongly reducing (∼−450 mV). All conditions were consistent in that at the onset of denitrification (initial drop in [NO3 −]), the soils experienced a rapid decrease in Eh potential. This transition occurred later under conditions that exhibited any toxicity to the bacterial community.
The kinetic rate (k value) of nitrate depletion was calculated from the negative slope of the linear best-fit line of each sample. These values, along with the R 2 value for each regression line, are displayed in Table 3. A t-test was performed on each slope value, determining its goodness of fit. All of the t-test results were significant (p<0.05), indicating that a zero-order kinetic model fitted to the designated region (highest [NO3 −] to 90% depletion) is appropriate for these data. The average k value was obtained for each treatment, and a separate t-test was performed to compare the kinetic rate of each treatment to that of the control. These results are also listed in Table 3.
Denitrification Kinetics Performed by Native Soil Bacteria in an Anaerobic Environment
Each item under the condition column describes the type of AgNPs (e.g,. uAg50), followed by the concentration of total Ag in mg/L (i.e., 1, 10, 100).
Kinetic rate (k) values were calculated from linear fits of zero-order kinetic model.
R2 values correspond to goodness of fit for these models.
Repetition used for graphs in Fig. 1 displaying fit lines.
Indicates significant difference, p<0.1.
The control condition displayed a relatively rapid depletion of nitrate, achieving 90% NO3 − depletion in 49 hr (±4 hr) on average (Fig. 1a). The average k value is 1.486±0.289 (Table 3). The uAg35 AgNP (Figs. 1b-1d) did not display an average kinetic rate (Table 3) significantly different from the control condition at any concentration (1–100 mg/L), which indicates that this AgNP may not be bioavailable under these concentrations in a reducing soil environment. The next AgNP, uAg50 (Figs. 1e-1g), did not have k values significantly different from the control condition at [Ag]total=1 or 10 mg/L. At [Ag]total=100 mg/L, however, the k value for nitrate depletion is significantly lower than the control at 0.939±0.063 (Table 3). All k values within the uAg50 condition were significantly different from each other. There are also differences in the time needed to achieve end point (>90% [NO3 −] depletion) for uAg50. The uAg50 conditions at [Ag]total=1, 10, and 100 mg/L took 47 hr±1 hr, 56 hr±1 hr, and 71 hr±1 hr, respectively, to achieve 90% NO3 − depletion. This indicates a concentration dependence of toxicity in the reaction rate and the pseudo-equilibrium end point.
The final AgNP, pAg60 (Figs. 1h–1j), showed no significant difference from the control in terms of kinetic rate (Table 3) or pseudo-equilibrium endpoint at any concentration (1 to 100 mg/L). In addition, no [AgTotal] within pAg60 was significantly different from any other.
Sorption Isotherm Experiments
To compare sorption behaviors between treatment conditions, the data were modeled using Freundlich equation:
22
Table 4 shows the parameter values for each AgNP, including: Kd , the distribution coefficient; n, the adsorbent constant, the slope of the linear regression line of the Freundlich model (equivalent to 1/n, shown in Figs. 2b, 2d, and 2f); and R2, the coefficient of determination of the linear regression line. Both q, the total Ag sorbed, and C, the equilibrium concentration of Ag, are plotted in Figs. 2a, 2c, and 2e. In general, AgNPs showed a strong affinity for soil surfaces (Fig. 2). All three AgNPs showed nearly 100% sorption onto soil surfaces at all Ag concentrations (10–500 mg/L). Figs. 2b, 2d, and 2f show the sorption isotherm data plotted in log scale and fitted to a linear regression line of the Freundlich isotherm model. The distribution coefficient, Kd , was calculated from the log of the intercept of the linear regression line. The Kd values for each AgNP are displayed in Table 4, along with correction factor values, n. As mentioned above, the reactivity of AgNPs in soils is particle-specific. In these soils, it appears that uAg35 experiences the strongest sorption. The Freundlich isotherm parameter (Kd value) for uAg35 is 61,070, while for uAg50 it is 20,450 and for pAg60 it is 24,060.
Freundlich Equation Isotherm Parameters
Kd is the distribution constant for the adsorbant, calculated from the inverse log of the intercept.
n is the correction factor, calculated from the inverse of the slope.
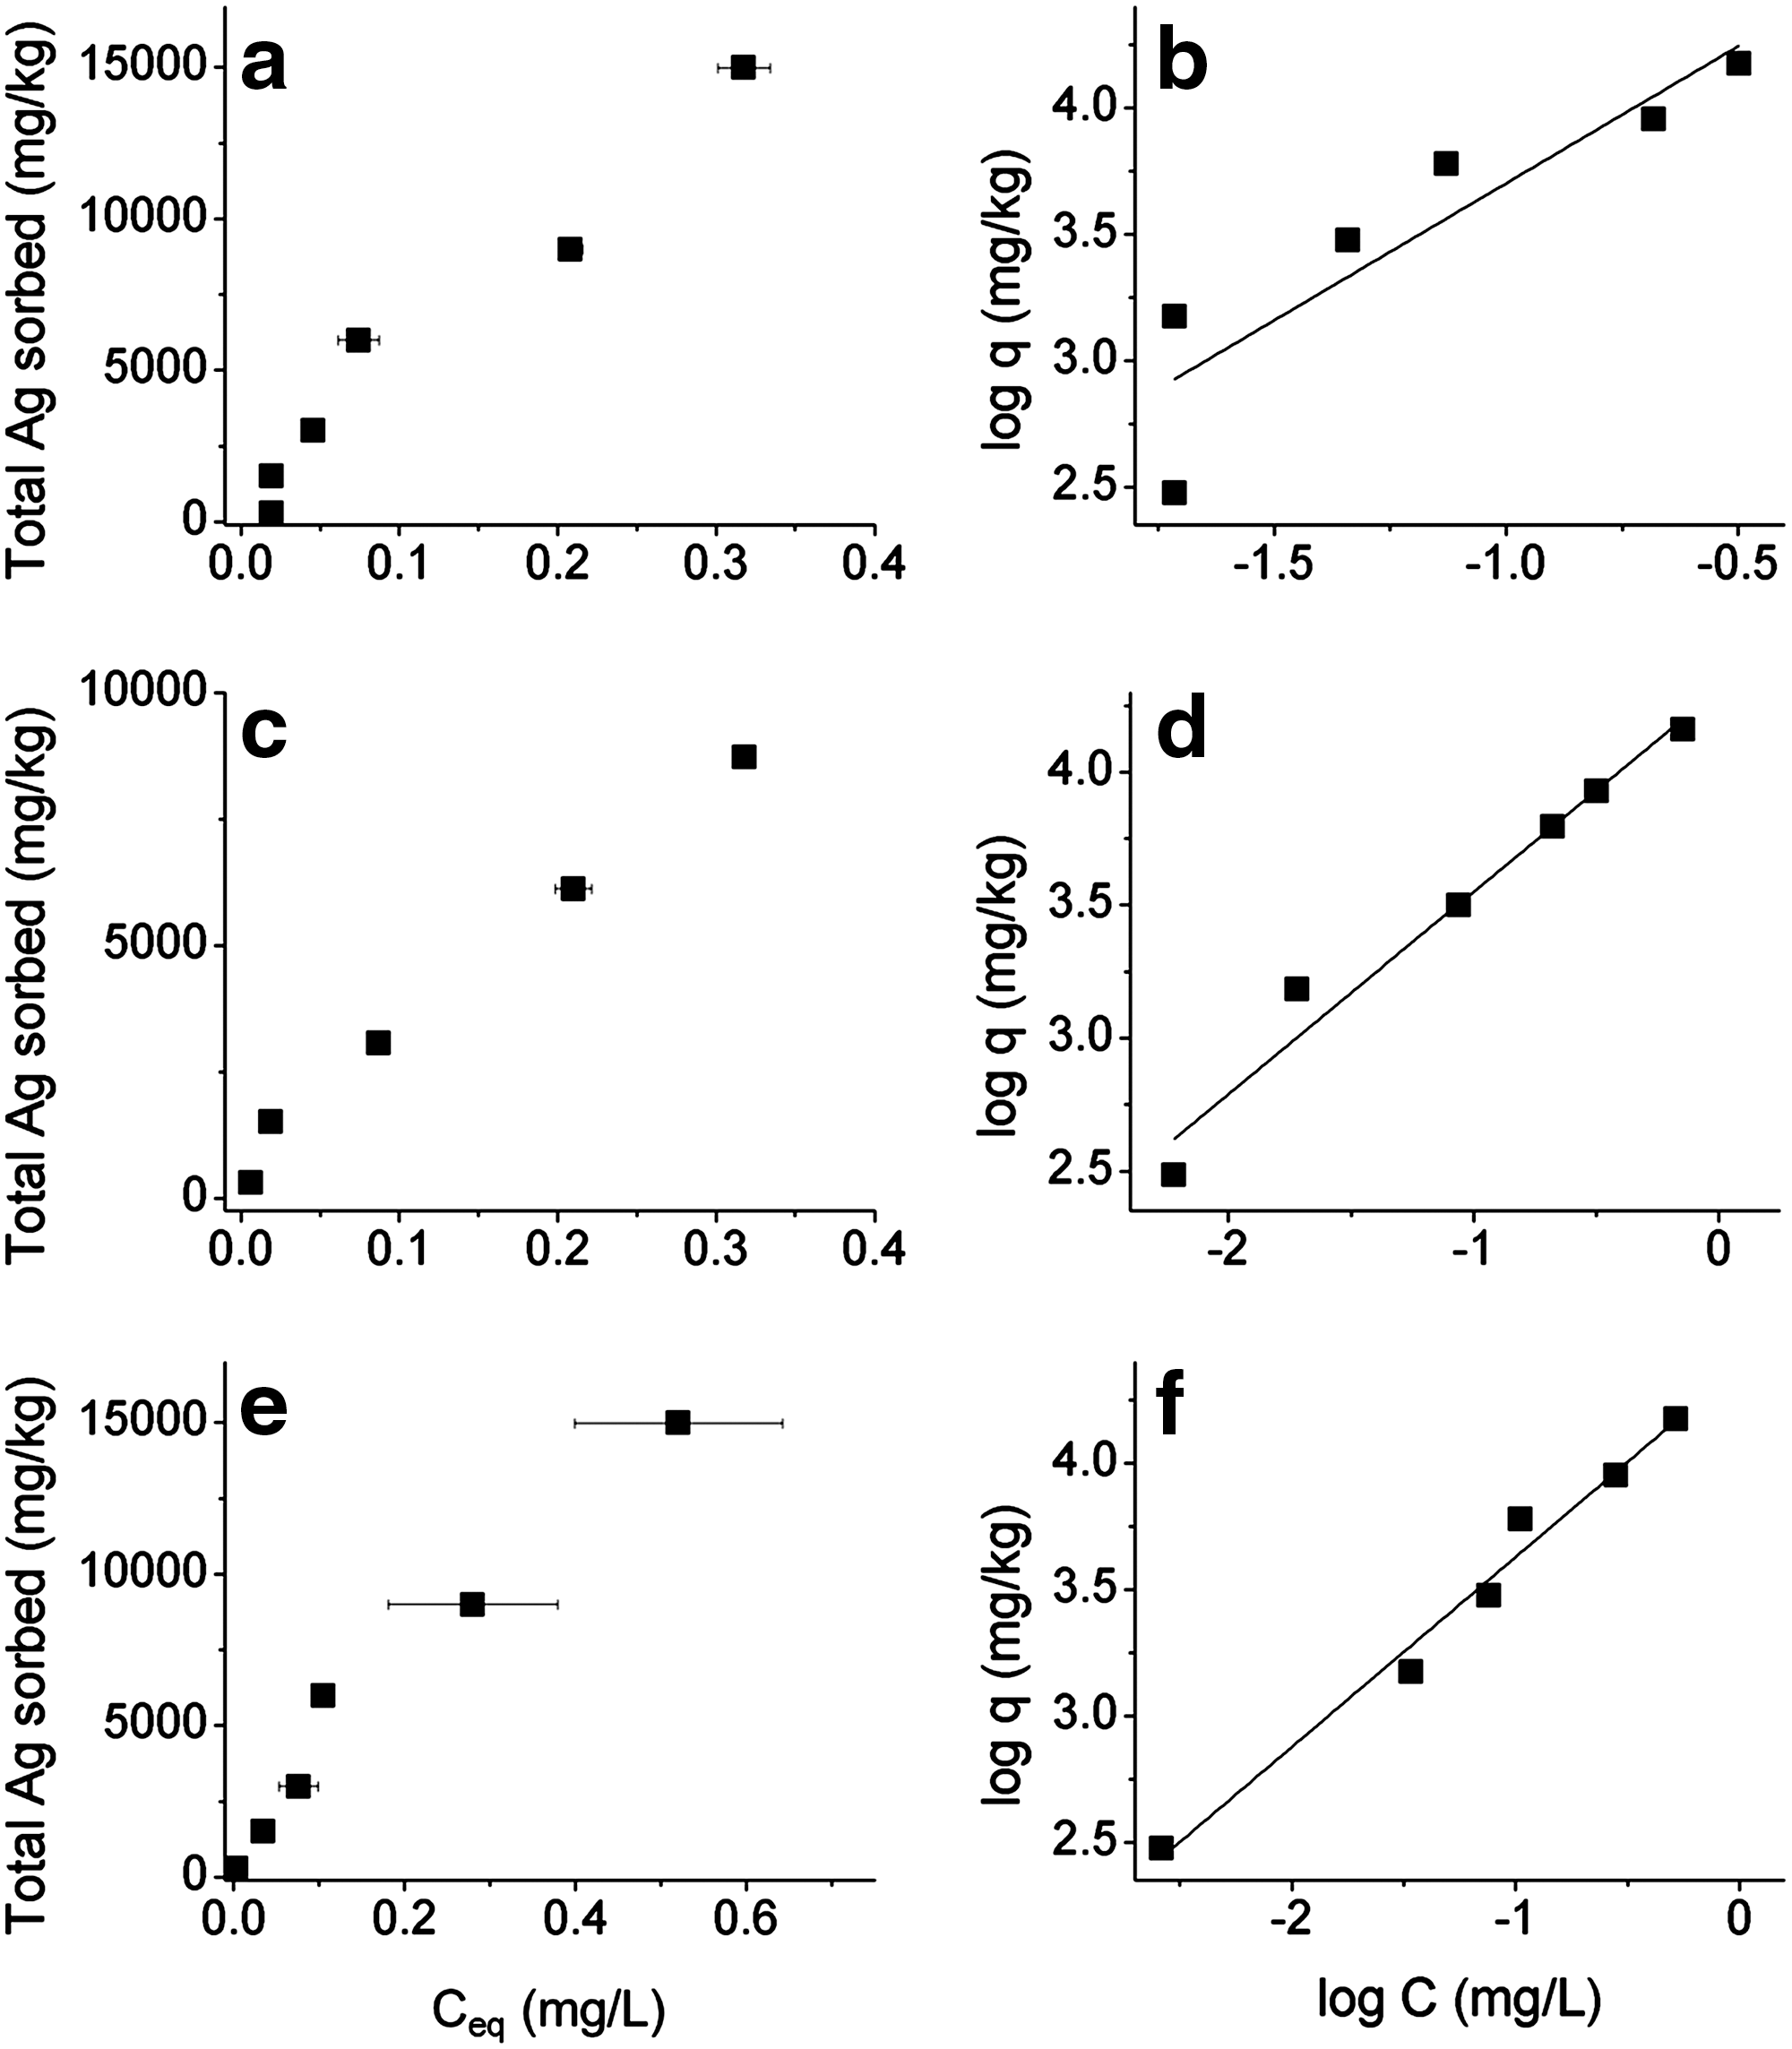
Adsorption isotherms of silver nanoparticles (AgNPs) in Toccoa sandy loam. Isotherm data for uAg35, uAg50, and pAg60 are shown in a), c), and e), respectively. Freundlich isotherm models for uAg35, uAg50, and pAg60 are shown in b), d), and f), respectively. Error bars on adsorption isotherm graphs indicate one standard deviation around marker.
Discussion
Only one of the AgNPs we tested showed any toxicity. The toxic AgNP, uAg50, was larger (∼50 nm) and uncoated. The toxicity of AgNPs has been frequently reported in pure culture studies, but studies rarely include environmental media. 23 –27 Other studies have shown that smaller AgNPs are more toxic than larger AgNPs, and that PVP-coated AgNPs exhibit stronger toxicity than uncoated AgNPs. 28 –30 These studies were not, however, conducted in the presence of soil. A study by Bradford and coworkers on marine estuarine sediments with the addition of up to 1 mg/L AgNP found no effect on native bacterial diversity or abundance, while a pure-culture study by Pal and coworkers showed a complete halt to microbial growth at 0.5 mg/L. 29,31 The discrepancy in toxicity could be at least partially due to the presence of sorptive surfaces and/or ligands in the natural setting. Soils have a large amount of sorptive surfaces, supporting our findings that the presence of a soil environment severely decreases AgNP toxicity.
It has been shown that AgNP toxicity is primarily due to the Ag(I) ions released from the AgNPs. 32 Ionic silver primarily exhibits toxicity through binding to S-containing ligands within microbial cells, especially the thiol group on cysteine. 33 This antimicrobial effect can have prolonged inhibitory action to Eschericia coli organisms. 34 Humic acids, such as those present in soil organic matter, have been shown to decrease Ag(I) release by Ag(0) mineral species. 35 This could contribue to the lack of toxicity shown by uAg35 and pAg60. In addition, Choi et al., showed that the addition of sulfide to a AgNP media greatly decreased AgNP toxicity to bacteria, demonstrating that sulfide-AgNP complexes will form. 36 The organic matter naturally present in surface soils contains sulfide groups, providing potential binding locations for Ag(I), as well as AgNPs. The study by Choi et al., however, did not investigate AgNP binding to intracellular S groups.
Sorption isotherm experiments displayed in Fig. 2 show the great affinity all AgNPs we studied have for soil surfaces. Even at the lower suspension density sorption isotherm experiments (Fig. 2), all AgNPs achieved near 100% sorption onto soil surfaces. Therefore, some toxicity to soil bacteria (i.e., the uAg50 condition) must be occurring at the mineral-water interface. It has been shown that cysteine-bound Ag(I) can still pose toxicity to Ceriodaphnia and may still be at least somewhat bioavailable. 37 As mentioned above, it is likely that under the reducing soil environment in this study, the limiting factor to AgNP toxicity is Ag(I) bioavailability to bacteria. The only toxic AgNP in our study, uAg50, displayed the lowest Kd value (Table 4) from the Freundlich isotherm, indicating that it exhibits the least sorption onto soil particles. The smallest AgNP we studied, uAg35, however, had the largest Kd value, i.e., the greatest affinity for soil surfaces. The results of the Freundlich isotherm support our toxicity findings in that the particle with the least affinity for soil surfaces also exhibited the only measureable toxicity. This study of AgNP-induced toxicity to model soil microbial community displays novel data on the impact of AgNPs in terrestrial environments.
Conclusions
It is inevitable that the release of AgNPs to aquatic and terrestrial environments will increase as the industrial and commercial use of AgNP products increase, and it is likely that these AgNPs will be deposited into agricultural lands via sewage amendments. While the size and capping agent dominated antimicrobial effects of AgNPs in pure culture systems have been documented in the literature, this study demonstrated a new aspect of AgNP toxicity to bacteria in the environment: partitioning of AgNPs in soils. 28 –30,38 The degree of denitrification was not greatly affected by size and capping agent of AgNPs. The sole AgNP that displayed toxicity to bacteria only did so at a very high concentration (i.e., 100 mg/L). Contrary to our initial predictions, it was a larger (50 nm) uncoated AgNP that produced bacterial toxicity, while the smaller (35 nm) and PVP-coated AgNPs did not. However, sorption isotherm experiments revealed that the only toxic AgNP also had the lowest Kd .
To better assess the risk of AgNPs in the environment, it would be useful to understand the fate of AgNPs in heterogeneous media. Soils are complex environments that contain numerous mineral and/or organic components with which AgNPs may interact. In-depth understanding of partitioning processes of AgNP in soils might be a critical aspect in predicting the fate of AgNPs in the environment.
Footnotes
Acknowledgments
This research was funded by the 2011 Agriculture and Food Research Initiative Competitive Grants Program, Nanotechnology for Agriculture and Food Systems (#2011-03580).
Author Disclosure Statement
No competing financial interests exist.