
Abstract
The use of nanotechnology in food and agriculture is expected to revolutionize these two industries through consumer health benefits and increased product yield. Nanoparticles (NPs) can be used to deliver specific bioactives with foods for improved health or to deliver herbicides or insecticides to plants in a controlled manner for improved yield. However, as nanotechnology makes its way into the food and agriculture industries, consumer safety becomes a concern. The first step in assessing nanoparticle toxicity is to determine relative nanoparticle biodistribution in vivo as a function of time following administration of the NP. It is the goal of this review to report on time profiles of NP uptake in major organs of rats and mice. The results are based on 10 papers focused on the study of the biodistribution of poly(lactic-co-glycolic) acid (PLGA) NPs, two of which report on orally delivered NP systems and the other eight on intravenous delivery. The concentrations of NPs in various organs—liver, spleen, kidney, lung, heart, and brain—are tracked over 24 hours following single dose administration as a starting point for risk assessment. It was evident that most organs studied showed decreasing particle concentrations over time after administration of a single dose. Over all four time frames studied—0.5–1 h, 1.5–3 h, 4–6 h, and 24 h—the brain and heart showed little to no uptake of particles in both animal models.
Introduction
Poly(lactic-co-glycolic) acid (PLGA) nanoparticles (NPs) are of special interest for delivery of therapeutics. PLGA is a polymer that is known to be biocompatible, biodegradable, and able to sustain drug release, and hence it has become the most extensively studied commercially available polymer approved by the FDA for biomedical use. 1 PLGA has been successfully used in drug delivery systems such as implants, scaffolds, microparticles, and NPs. 2 PLGA nanoparticles in particular have been shown to enhance delivery of drugs ranging from small molecules to proteins, vaccines, and plasmid DNA. 3
Nanoparticles made of biodegradable polymers such as PLGA exhibit physicochemical properties vastly different from their bulk counterparts; these NPs have an increased surface area and increased ability to translocate cell membranes. 4 Adverse effects of polymeric NPs due to their size and ability to be endocytosed have not been extensively studied, and limited NP exposure risk assessment studies have been conducted. 5 Knowledge on biodistribution of NPs will aid in the design of safe NPs that can offer tremendous advantages, exceeding those of other drug delivery systems, while posing no health threats to the host. 6
Application of nanotechnology for delivery of active ingredients in the food and agricultural industry is not as developed as drug delivery, yet it exhibits great potential. It has been proposed that nanotechnology may be a successful tool for designing smart delivery systems for food and agricultural use; engineered or natural NPs are capable of enhancing solubility, improving bioavailability, aiding in controlled release, and protecting stability of micronutrients in food products or active agents for agriculture. 5,7 Nanotechnology in food covers a range of applications including food contact materials designed to interact with food and its surrounding environment to improve quality; food ingredients altered to form nanostructures that enhance characteristics such as taste, texture, and consistency of food products; and nanosized ingredients including additives, colorants, and preservatives. Delivery of agrochemicals, including fertilizers and pesticides, is another exciting application of nanodelivery systems. 8 Agricultural uses of nanoparticles show much potential in overcoming problems related to chemical stability, solubility, and photodegradation of agrochemicals.
Biodegradable polymeric NPs such as PLGA NPs are not considered to be Generally Regarded as Safe (GRAS) for food applications, but the risk assessment associated with these NPs may be relevant for other NPs made out of materials accepted as GRAS for food products. 9 Because of the broad potential application of NPs in the food industry and agriculture, it is critical to understand the safety of NPs in the event of purposeful exposure through nanofoods or accidental exposure through retained NPs in agricultural products.
Numerous studies on PLGA biodistribution over a 24-h period following a single dose administration were conducted and reported in the literature. Of these studies, only a few quantified NP presence in % dose or % dose/g tissue. Biodistribution of particles administered orally was studied in some papers, while others focused on administered nanoparticles via intravenous (IV) delivery. Different sizes of PLGA particle systems were studied, and particles were detected by different methods; indicators were physically entrapped in some NPs and covalently linked to others. Two different animal models were used in these studies—mice and rats. Based on the studies available on biodistribution of PLGA nanoparticles, the goal of this review was to quantify and analyze available results on PLGA biodistribution measured over 24 h post-administration (IV and oral) in rats and mice. The data were compared over four different blocks of time within 24 h to determine if particles were cleared from the system during this time frame.
Methodology
Electronic databases including Science Direct and Web of Science were consulted to locate publications on biodistribution of PLGA nanoparticles in mice and rats. Search terms included PLGA, biodistribution, polymeric nanoparticles, mice, and rats. Using these search criteria, 3,600 articles were found, but only 10 were used. The references chosen for the review were limited to studies using IV or oral administration that reported data in terms of NP uptake in major organs: liver, kidney, spleen, lung, heart, or brain, either in % dose or as % dose/g tissue, as a function of time. Once the references were selected, all data were converted to % dose NPs/g organ with respect to time, and the data were represented in terms of particle uptake in each organ during four different time frames within a 24-h period following administration.
Results and Discussion
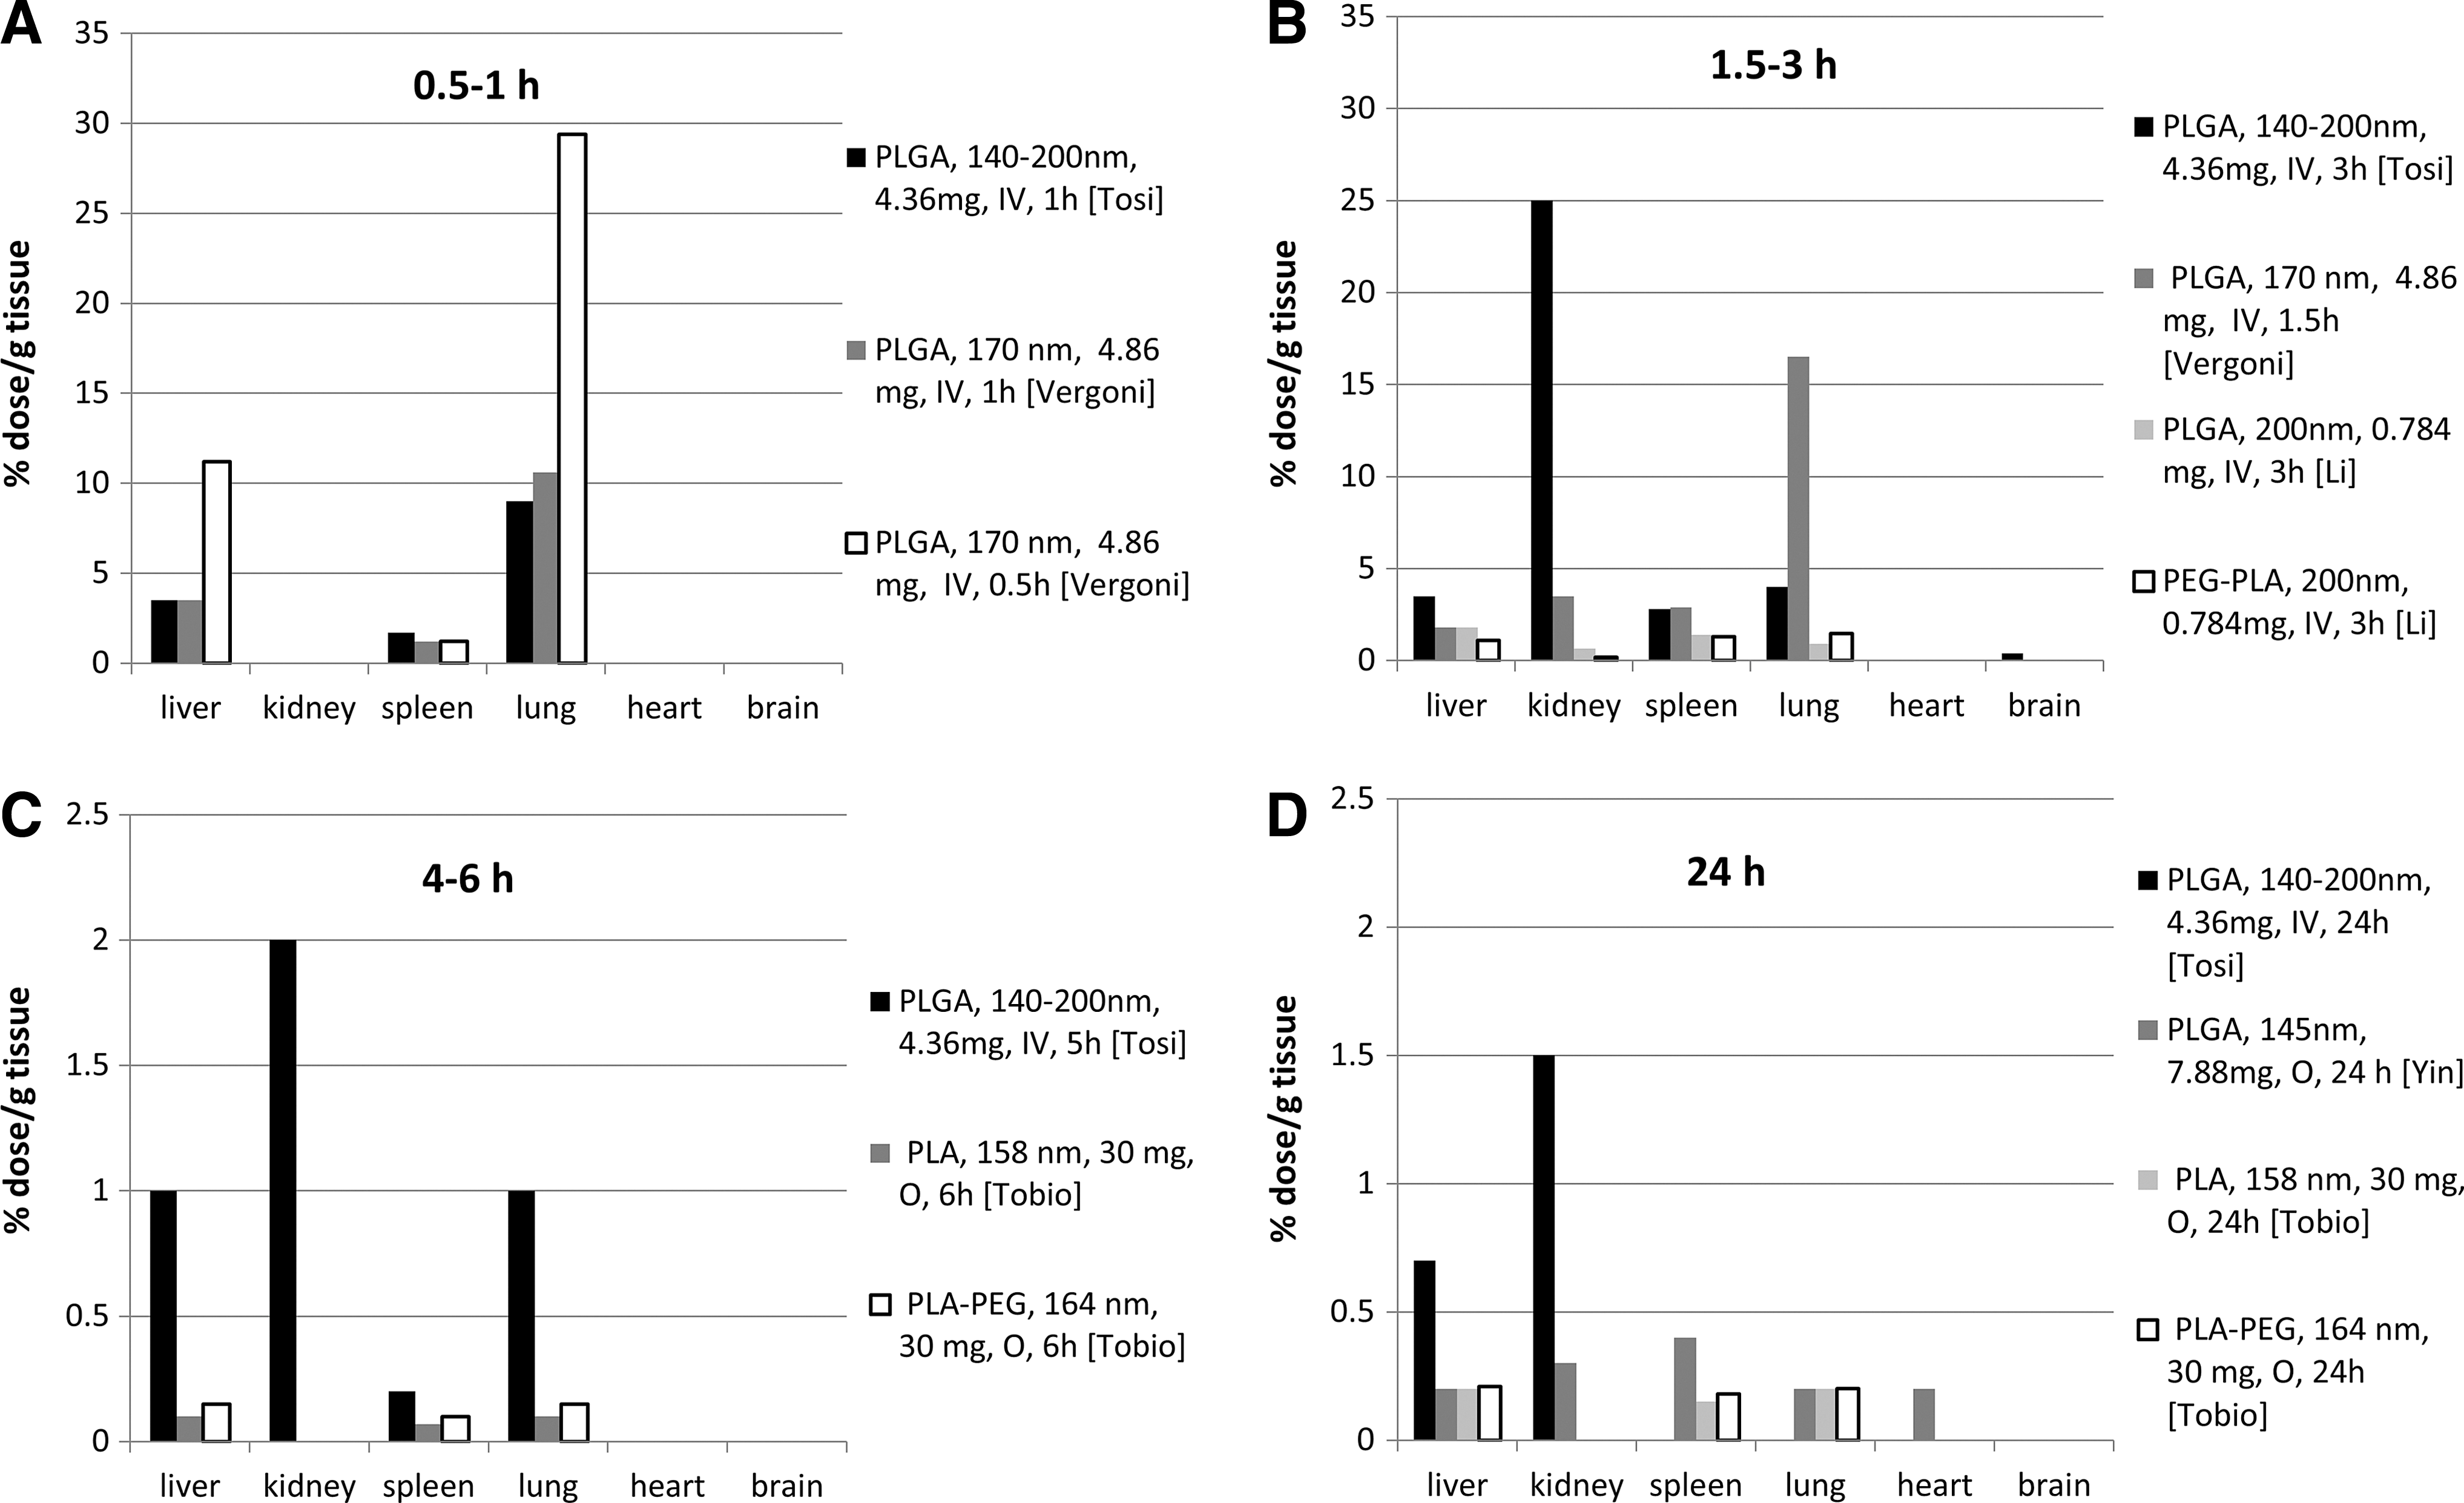
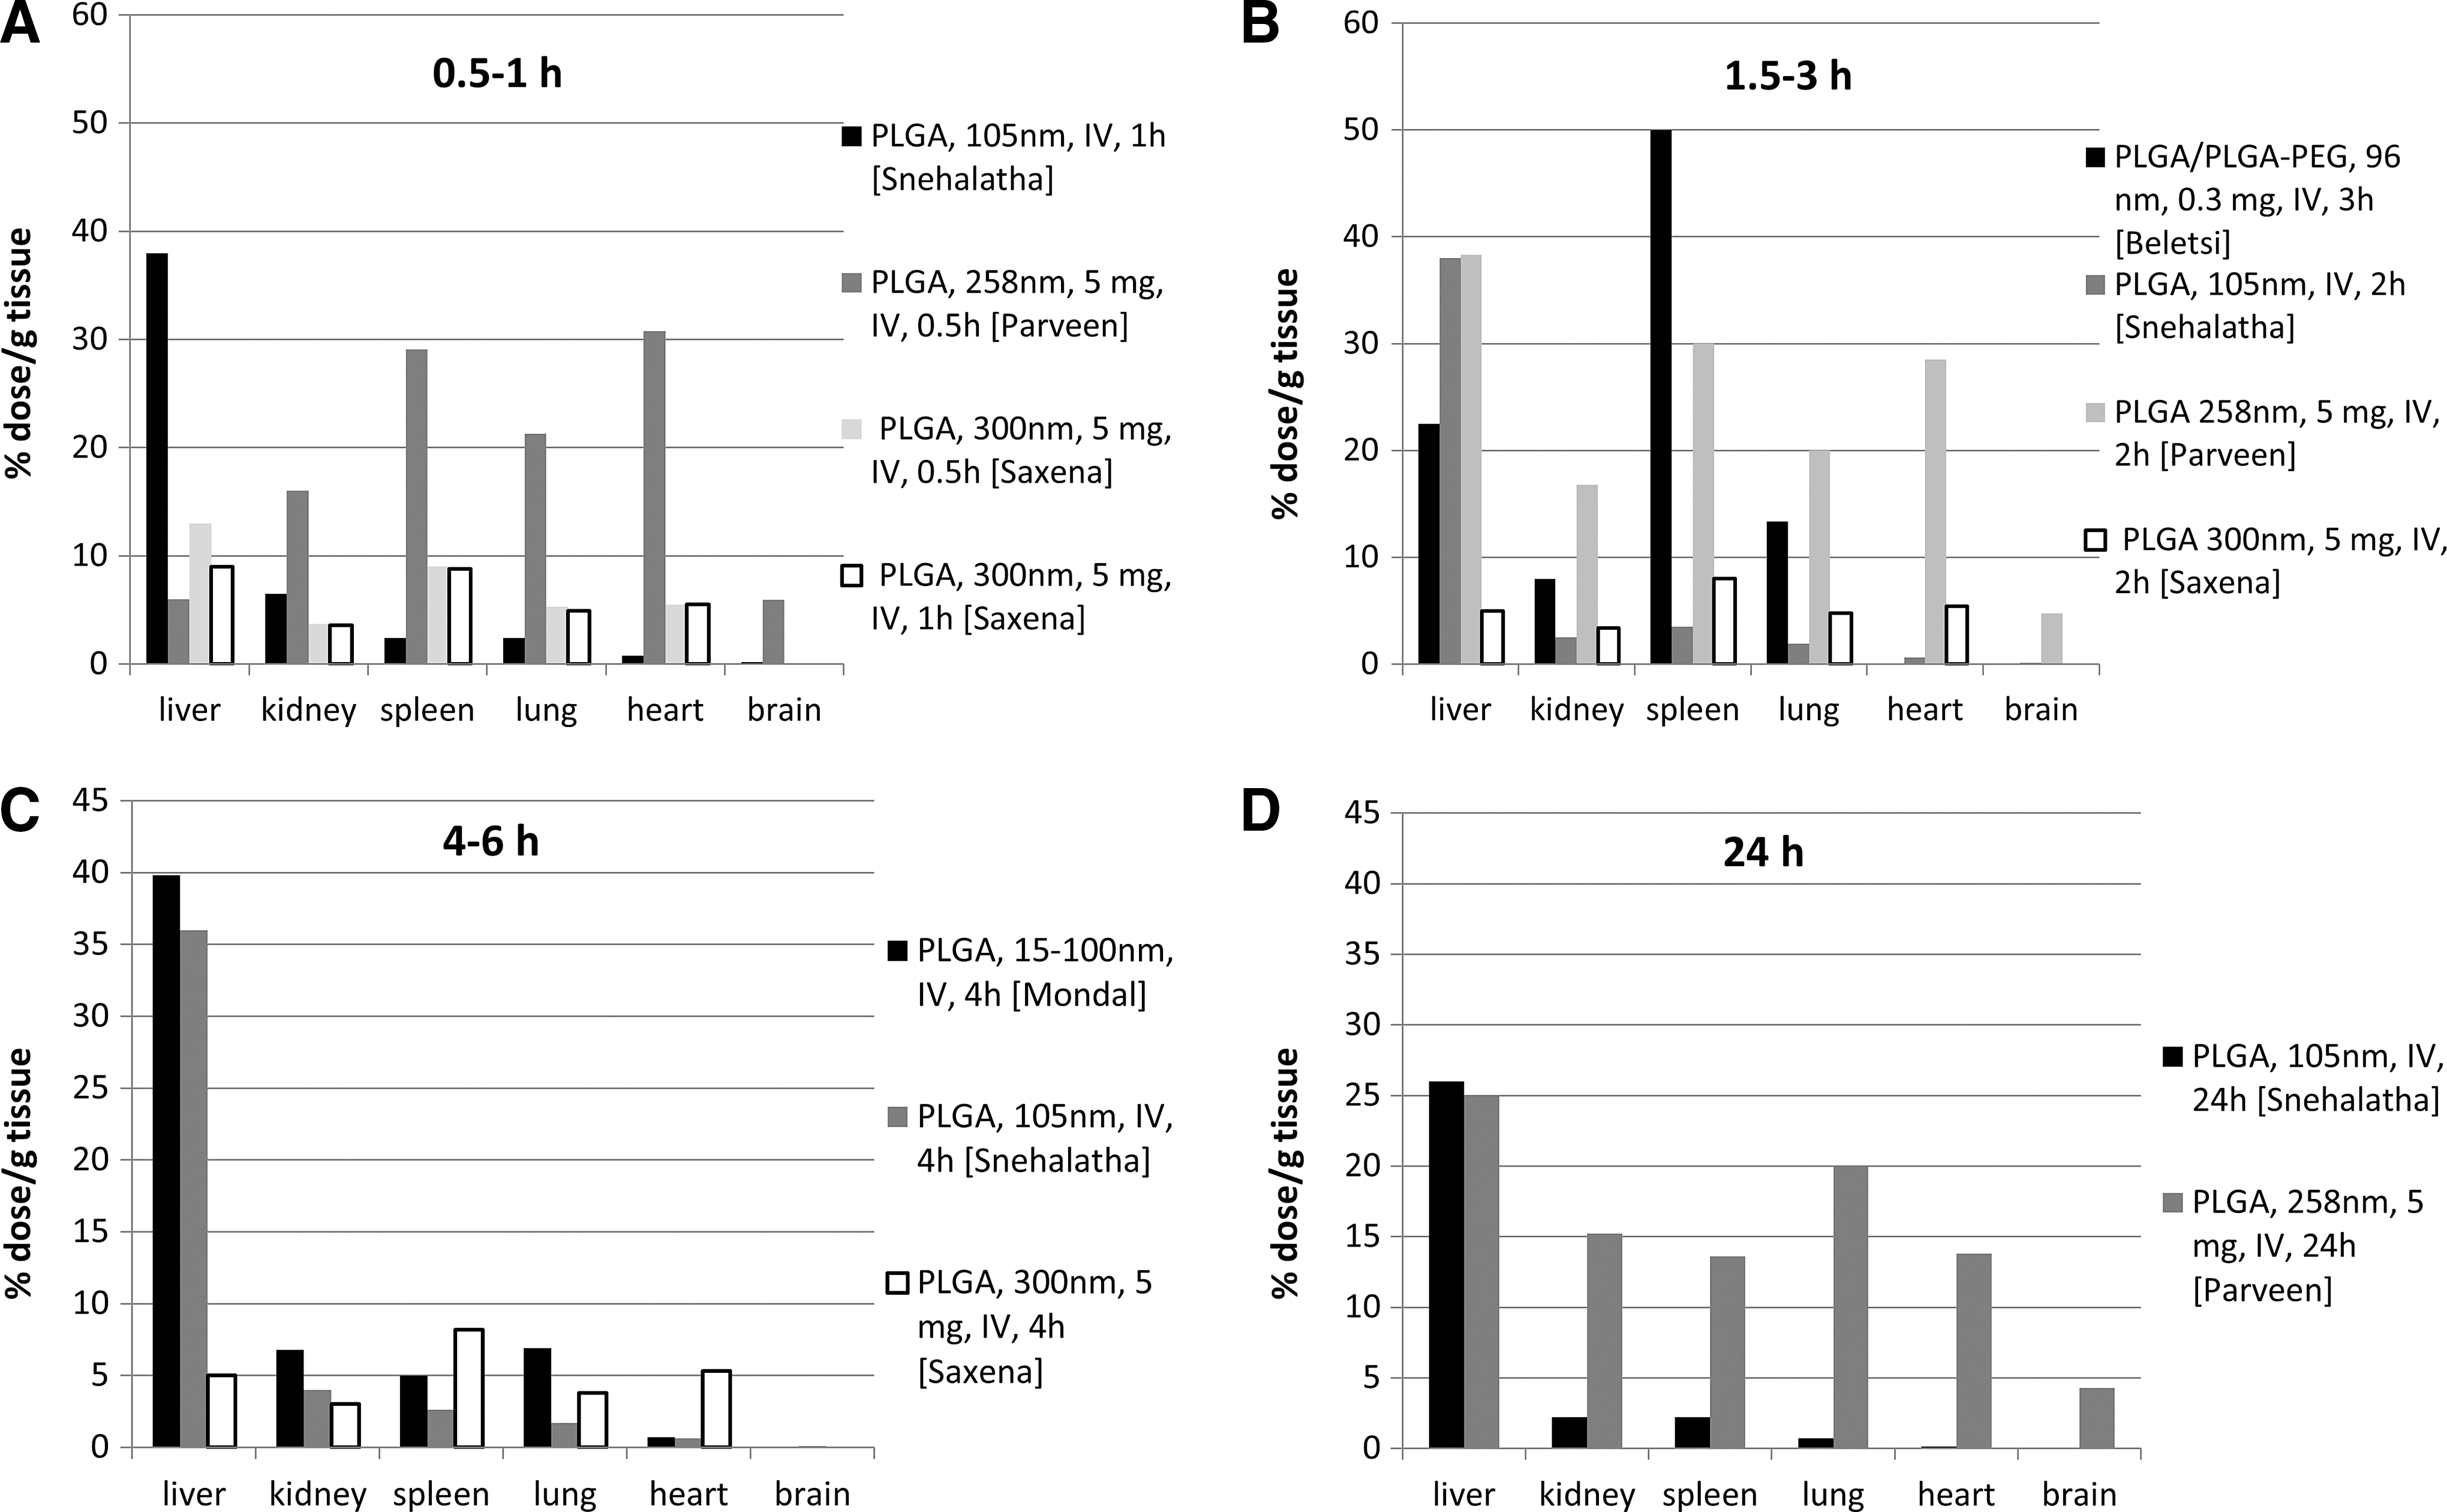
The change in particle presence in the main organs—liver, kidney, spleen, lung, heart, and brain—over time provides an excellent perspective of biodistribution and clearing of PLGA NPs. The relationship between tissue uptake of NPs not only across tissues, but also across time, aids in understanding NP safety. PLGA NPs are assumed safe on the basis of the biocompatibility of the polymer; clearing of the NPs over time would support this concept. Biodistribution of polymeric NPs is tracked over time in this paper by comparing the uptake of NPs following a single-dose administration at four time intervals in rats (Fig. 1) and in mice (Fig. 2): 0.5–1 hour (Figs. 1A and 2A), 1.5–3 h (Figs. 1B and 2B), 4–6 h (Figs. 1C and 2C), and 24 h (Figs. 1D and 2D). These time frames were chosen based on the available data in the papers referenced in this review.
Nanoparticle (NP) presence in the liver, kidney, spleen, lung, heart, and brain of rats 0.5–1 h
Nanoparticle (NP) presence in the liver, kidney, spleen, lung, heart, and brain of mice 0.5–1 h
Nanoparticle Biodistribution 0.5–1 H after Administration
Particles of 100–300 nm delivered intravenously in rats were detected in different tissues between 0–29% dose/g tissue (Fig. 1A) within the first hour following administration. 10,11 Trends represented in Fig. 1A showed highest uptake of particles in the liver and the lung with respect to the four other tissues in the first hour following administration in rats. The particles found in the liver ranged from 3.5–11% dose/g tissue, whereas the particles in the lung ranged from 9–29.4% dose/g tissue. Three of the six tissues studied—kidney, heart, and brain—showed particle systems with no detection in the first hour following administration in rats, whereas the spleen showed a minimum uptake shortly (0.5–1 h) after nanoparticle administration (Fig. 1A).
In mice, 0–30% dose/g tissue were found 0.5–1h after administration (Fig. 2A). With the exception of one study, mice showed the highest uptake of particles in the liver, followed by similar amounts (3–7% dose/g tissue) in spleen, kidney, heart, and lung (Fig. 2A). 12 Particle concentrations in the liver ranged from 6–38% dose/g tissue. In the kidney, particles were found up to 16% dose/g tissue, and the spleen had concentrations reaching almost 30% dose/g tissue (Fig. 2A).
In general, it is expected that values of % dose/g organ should be higher in mice than in rats for the same administered dose due to the larger organs of the rats. For example, a rat liver is approximately 8.5 g, while a mouse liver is only 1.2 g, so when the same dose of particles is administered to both animals, the concentration of the particles in the mouse liver will be higher than in the rat liver when reported relative to the organ weight. This is generally true according to the reported data. For example, the liver uptake of particles in the first hour following administration ranged from 4–11% dose/g in rats (Fig. 1A) and from 6–38% dose/g in mice (Fig. 2A).
Nanoparticle Biodistribution 1.5–3 H after Administration
Uptake of 96–300-nm particles administered to rats and mice 1.5–3 h following IV administration are reported across seven different studies. 10 –16 Particles were detected between 0–25% dose/g in rats (Fig. 1B) and 0–50% dose/g in mice (Fig. 2B) depending on the tissue. All particle concentrations were below 40% dose/g, except for particles of 96 nm detected in mouse spleen at a high 50% dose/g after IV delivery (Fig. 2B). 15
After 1.5 h, the majority of systems showed little change in particle concentration in rats (Fig. 1B) with respect to the particle concentrations in the previous time frame (Fig. 1A). All four particle systems reported as present in the rat liver showed concentrations below 4% dose/g (Fig. 1B) in the 1.5–3 h time frame; two of the three systems reported 3.5% dose/g liver in rats (Fig. 1A). 10,11 Particles of 140–200 nm delivered via IV administration in rats were detected at 9% dose/g tissue in the lung 1 h after administration (Fig. 1A). 10 Three hours after administration, these same particles were found at 4% dose/g lung (Fig. 1B). NPs detected in the spleen were found at values below 3% dose/g tissue; no particles were found in the brain in this time frame (Fig. 1B).
Particle concentrations in mice tissues showed minimal change after 1.5 h post-administration, similar to rats. The brain showed the lowest presence of particles in the mice as well, with only 5% dose/g detected (Fig. 2B).The heart showed the next lowest amount of particles, with all but one NP system below 5.4% dose/g heart (Fig. 2B). 12 Particles were detected at values of 4–50% dose/g spleen in mice (Fig. 2B), possibly an increase from the previous time frame (Fig. 2A). Particle uptake in the kidney showed similar values compared to the remaining tissues at the same time point. The averages in kidney uptake in mice stayed consistent 1.5 h following administration, with an average of 7.6% dose/g tissue determined at 1.5–3 h following administration (Fig. 2B).
Nanoparticle Biodistribution 4–6 H after Administration
Data from 4–6 h post-administration were retrieved from six NP delivery systems, shown in Figs. 1C and 2C, for rats and mice, respectively. Four of the six NP systems used IV delivery, and the remaining two used oral delivery via gavage in rats (Fig. 1C). 10,13,14,17,18 The amount of particles able to be detected from all systems decreased significantly 4 h following administration (Fig. 1C) compared to the previous two time frames (Figs. 1A and 1B). The orally delivered NPs showed nearly undetectable levels across all tissues (Fig. 1C), and the brain showed undetectable levels of all particles measured during this time frame (Figs. 1C and 2C). With the exception of particles found in the mice livers, no tissue showed a presence of particles higher than 10% dose/g tissue (Figs. 1C and 2C). Smaller particles of 105 nm and 58 nm delivered by IV in mice were found in the liver at high doses—36% dose/g and 39% dose/g, respectively, at 4–6 h after administration (Fig. 2C). 13,18
Nanoparticle Distribution 24 H after Administration
NP systems were delivered to rats (Fig. 1D) and to mice (Fig. 2D), and values were reported 24 h post-administration. Three of the six NP systems were delivered orally to rats (Fig. 1D). 17,19 Almost all particles were cleared from the tissues after 24 h; NPs that were administered via oral delivery to rats were detected at low levels in all tissue except for the brain, where no particles were detected (Fig. 1D). The largest concentration of particles came from the 258-nm particles delivered by IV in mice, showing 25% dose/g tissue in the liver (Fig. 2D). 12 These particles contained an entrapped indicator, and detection of these particles may be misleading in that the detection is only of the probe itself, not the particles. Small amounts of the 140–200-nm particles delivered by IV in rats were still identified in the kidney (Fig. 1D), and particles of 105 nm administered by IV in mice were also found in the liver, kidney, and spleen (Fig. 2D) 24 h after administration. 10,13
Observations on time Progression of Nanoparticle Uptake
Studying NP uptake by major organs of mice and rats over four different time frames aids in understanding particle clearance of tissues after IV or oral delivery. Between 0.5 and 3 h, most particle systems showed little change in concentrations in all tissues, ranging from 0–29% dose/g in rats (Figs. 1A and 1B) and 0–50% dose/g in mice (Figs. 2A and 2B) depending on the tissue. On the other hand, data representing particle uptake after 4 h showed a significant decrease in organ concentration of particles in rats compared to that from earlier times following administration; less than 2% dose/g of particles was found between 4 and 24 h following delivery (Figs. 1C and 1D). Similarly, most particle systems delivered in mice were detected under 10% dose/g from 4–24 h following administration in all tissue with the exception of the liver (Figs. 2C and 2D). It is evident that particles in the brain are detected at a maximum of 5% dose/g over all time periods in mice (Fig. 2). In most cases, particles in the brain showed a presence of less than 1% dose/g tissue. Particle uptake in the liver was consistently high over all time frames analyzed, but the highest concentration of particles was seen 4 hours after administration, at 39.8% dose/g in mice (Fig. 2C). The heart showed very little particle uptake during the first 24 h following administration. The kidney, spleen, and lung showed comparable amounts in mice over all four time periods (Fig. 2).
Since NPs may be able to reach certain tissues in which their bulk counterparts are unable to reach, safety/toxicity evaluation of NPs is critical, and it is plausible that biokinetic profiles of NPs in different organs may help predict target organ toxicity. 6
The data represented in Figs. 1 and 2 indicate several trends regarding NP clearance from tissues during the 24 h time frame after administration. The most apparent trend is the lack of particle uptake by the brain across all time points. Based on the reviewed studies, unmodified PLGA NPs are unable to cross the blood brain barrier under the circumstances studied. Another evident trend is the small amount of particles taken up by the organs after oral delivery of PLGA NPs. Also, regardless of delivery method (IV vs. oral), as time following administration progresses, particle concentration in tissues decreased significantly. In terms of organ-by-organ uptake analysis, the liver shows the highest retention of NPs over time—up to 25% dose/g particles still present at 24 h in mice. Overall, particle clearance from the tissue is quite apparent from these studies and shown to occur as quickly as 24 h following nanoparticle administration.
The route of delivery is important when comparing biodistribution of NPs. With oral delivery, particles must pass through the gut while resisting degradation from the gastrointestinal environment, and particles must also avoid first-pass metabolism. In first-pass metabolism, drugs can be rendered inactive by the liver following absorption from the gut. 20 If particles administered via IV delivery are able to bypass these barriers and directly enter into the circulatory system, they may be detected and cleared by the macrophages. 20 The method of delivery, therefore, significantly influences biodistribution profiles of PLGA NPs. It is apparent from the reviewed studies that orally delivered NPs reach major organs in small amounts compared to IV-administered NPs. For example, particles delivered orally to rats only reached 0.15% dose/g liver, whereas particles delivered by IV administration reached 1% dose/g liver during the same time frame (Fig. 1C). Because toxicity levels of NPs are of high importance, knowledge of NP residence in tissues after oral delivery is critical. Small uptake of orally delivered NPs and rapid organ clearance of NPs may indicate limited harmful effects.
Conclusions
This review was conducted to determine relative NP clearance from organs in mice and rats. By determining clearance of NPs from tissues over 24 h following administration, researchers can conduct a risk assessment beginning with NP exposure time and location in vivo. Safety of nanodelivery systems for food and agriculture relies on this type of assessment. Together, the papers in this review suggest several trends. First, 96–300-nm PLGA NPs show a significant decrease in concentration in all tissues over 24 h. Second, these particles are present in almost undetectable amounts in the brain and heart over all time periods following administration. Orally delivered NPs were present in small quantities in each organ in comparison to IV delivered particles.
Analyzing NP clearance from major tissues after a single exposure is the first step towards identifying toxicity associated with administration of NPs. The extensive application of NPs in the food and agriculture industries can only reach its potential with confidence in the safety of the nanodelivery systems for the consumer exposed directly or accidentally to the nanoparticles.
Footnotes
Acknowledgments
This work was supported by the Increasing Scientific Data on the Fate, Transport and Behavior of Engineered Nanomaterials in Selected Environmental and Biological Matrices funding program administered jointly by the Environmental Protection Agency (EPA), National Science Foundation (NSF), and US Department of Agriculture (USDA). EPA-G2010-STAR-N2 Food Matrices Award # 2010-05269.
Author Disclosure Statement
No competing financial interests exist.