




Abstract
The enzymatic hydrolysis of cellulose is still considered a main limiting step in the biological production of biofuel from lignocellulosic biomass. This step involves the action of at least three types of cellulose-degrading enzymes—endoglucanases, cellobiohydrolases, and β-glucosidases—acting in a synergistic way. This enzymatic cocktail, usually secreted by Trichoderma reesei at industrial scale, has already been well studied, and modeling of the hydrolysis kinetics widely investigated. However, most of these models are empirical and few of them distinguish the kinetic activity of each enzyme. This article provides a new way to design a functional kinetic model that dissociates the activity of β-glucosidases as a final homogeneous reaction, and the hydrolysis of cellulose by cellobiohydrolases in a heterogeneous phase. The predictive model combines a Michaelis-Menten (M-M) approach for the β-glucosidase action and a methodology based on Langmuir assumptions to describe the processive activity on solid substrate performed by cellobiohydrolases. We assess the influences of temperature, enzyme, and substrate concentration, as well as high glucose content. The suggested kinetic model allows for good prediction of all the experimental data.
Introduction
The biological production of ethanol from lignocellulosic biomass could be a sustainable alternative to liquid fossil fuels. However, the cost of cellulase enzymes used in the hydrolysis step is one of the greatest technical barriers to cost-effective production of ethanol from biomass. This step involves the action of at least three types of glycoside hydrolases acting in a synergistic way. 1 Endoglucanases (EC 3.2.1.4) randomly cleave β-1,4 glycosidic linkages of cellulose; cellobiohydrolases (EC 3.2.1.91) attack cellulose chain ends to produce cellobiose, the constitutive unit of cellulose; and β-glucosidases (BGL; EC 3.2.1.21) hydrolyze cellobiose into two molecules of glucose. The enzymatic cocktail secreted by Trichoderma reesei is widely applied in industrial processes and is often supplemented by BGL. 2 –4
Modeling enzymatic hydrolysis is useful to understand the mechanisms involved during the hydrolysis step, to predict the action of cellulases, and to design optimized process reactors and equipment. Zhang and Lynd, and, more recently, Bansal et al. and Sousa et al. reviewed the different kinetic models reported in the literature. 5 –7 Only a few of these models actually take into account the characteristics of each enzyme family and most directly model the enzymatic cocktail without considering the occurrence, during hydrolysis, of a heterogeneous phase (endo-/exocellulases activity) and a homogeneous phase (BGL activity). The evolution of the substrate morphology is also often neglected.
Among the numerous mathematical models available, Griggs et al. proposed a full mechanistic model integrating the description of the enzymatic reactions, the occurrence of insoluble and soluble substrates, and the distribution of cellulose chain lengths. 8,9 However, more detailed calculations, including a parametric study and comparisons to experimental results, are needed to validate the proposed model. Levine et al. developed a model for the design of optimal cellulase mixtures, but the proposed mathematical model requires a set of parameters related to adsorption, kinetic, and other physical parameters. 10 The results of the model did not agree with all the experimental data and failed to integrate the synergistic effects between enzymes. Finally, Zhou et al. correlated the hydrolysis rate to the mesoscopic structure of cellulose, which is difficult to determine experimentally. 11,12 Moreover, this model considers neither enzyme inactivation nor product inhibitions, which are key parameters of the slow-down of the rate of hydrolysis.
The action of BGL from both T. reesei and Aspergillus niger has already been modeled. 13 –18 Classical Michaelis-Menten (M-M) equations with competitive inhibition by glucose have been used to fit experimental data and to determine kinetic parameters. Adsorption and kinetic properties of the two cellobiohydrolase (CBH) enzymes of T. reesei—i.e., CBHI (Cel7a) and CBHII (Cel6a)—have also been widely described. 19,20 They are characterized by a modular organization containing a catalytic domain and a carbohydrate binding domain linked by a hyperglycosylated peptide linker. Kinetic studies revealed a predominance of the production of cellobiose, but glucose and cellotriose were also observed. 21 An M-M model has often been used to predict sugar production by cellobiohydrolases, but it does not take into account the enzyme adsorption onto the substrate. 22 –25 Models based on adsorption assumptions are more relevant and many exist. 7,21 The end-product inhibition on cellulases has also been determined, but these studies often neglect to distinguish the specificity of each enzyme. 22 –26
The present manuscript reports on the development of a kinetic model that integrates the respective properties of each enzyme along with their synergies. The uniqueness of the model comes from the combination of Langmuir assumptions for the action of CBH enzymes, accompanied by a M-M treatment of the kinetics of BGL. CBHI and CBHII from T. reesei and BGL from T. reesei were used to determine the adsorption and catalytic constants needed to build the integrative model, taking into account factors such as temperature, inhibitor concentrations, and substrate accessibility.
Materials and Methods
Microcrystalline cellulose (Avicel PH101), cellobiose, p-nitrophenol, and p-nitrophenyl-β-D-glucopyranoside (pNPG) were purchased from Sigma-Aldrich (Lyon, France). Glucose was obtained from Prolabo (Fontenay-sous-Bois, France). Cellotriose, cellotetraose, cellopentaose, and cellohexaose were purchased from Seikagaku (Seikagaku, Japan). All buffer components and salts were reagent-grade and purchased from Sigma-Aldrich and GE Healthcare (Saclay, France). Pure enzymes from T. reesei were obtained from a crude enzyme preparation using the hyper-cellulolytic mutant strain CL847, as described by Herpoel-Gimbert. 26,27 CBHI and CBHII were purified by fast protein liquid chromatography (FPLC) using a protocol based on Markov et al., and modified as described previously. 28,29 β-glucosidases from T. reesei and A. niger (SP188; Novozymes, Bagsvaerd, Denmark) were purified or desalted, respectively, using an FPLC protocol described by Chauve et al. 18
Kinetic and Adsorption Studies
β-glucosidase kinetic tests measured the amount of glucose and p-nitrophenol released, respectively, from cellobiose and pNPG. The experimental conditions were described previously. 18 Adsorption and activity tests on the cellobiohydrolases were performed using the microcrystalline cellulose Avicel PH101 as a substrate.
Adsorption tests were performed under magnetic agitation (400 rpm) in a 50-mM citrate buffer (pH 4.8) at 4°C and 50°C; 10 g/L of Avicel and 0.3–4.3 μM of CBHI or CBHII enzymatic solutions were incubated for 30 to 90 min. For BGL, enzymatic concentrations between 10 and 20 mg/L were incubated for 90 min in tubes containing either 10 g/L of Avicel or no cellulose. Avicel with bound enzymes was separated from the supernatant by centrifugation, and free concentrations of CBHI, CBHII, and BGL were determined using the spectrofluorescent method.
For kinetic tests, the same pH, agitation rate, and enzyme and substrate concentrations were used, but assays were carried out in duplicate with a time interval of 5 min, for a total period of 30 min. The sample was then divided into two parts. One part was heated at 95°C for 5 min to stop the reaction, then cooled, filtered (0.2-μm nylon acrodisc 13 mm), and used to determine the amount of sugar released. The other part was centrifuged and the supernatant was used to determine the amount of non-absorbed enzymes. The temperature influence (30°C to 55°C) and the glucose inhibition (0 g/L to 120 g/L) were also investigated using 10 g/L of Avicel, 0.63 μM of CBHI, or 1.06 μM of CBHII.
Finally, additional experiments were performed with CBHI using substrate concentrations of 5 g/L and 20 g/L and various amounts of CBHI. Each test was done in duplicate.
Protein Measurement
Protein concentration was measured according to the Lowry method using bovine serum albumin as the protein standard (DC Protein assay, BioRad, Hercules, CA). 30 Fluorescence measurements were used in the experiments containing low protein concentration. Each sample was placed in a quartz cell, excited at 280 nm, and the emission spectra recorded in the range of 280 and 500 nm using the Varian Cary Eclipse spectrophotometer (Agilent Technologies, Santa Clara, CA) containing a photomultiplier detector. The surface area between 290 nm and 450 nm was then correlated to the enzyme concentration determined with the Lowry method. The linearity between the area and the enzyme concentration was checked.
Sugar Analysis
For BGL tests, glucose concentration was determined by high performance liquid chromatography (HPLC) using the methods previously described, and p-nitrophenol was quantified by spectrophotometry at 405 nm (Multiskan Ascent Scanner, Thermo Labsystem, Milford, MA) using 96-well plates. 18 A range of p-nitrophenol solutions from 0–0.3 mM was used for calibration. For tests of cellobiohydrolases, glucose along with cellooligosaccharides up to degree of polymerization (DP)=6 were analyzed by HPLC. 31 These analyses were performed on ICS3000 (Dionex, Jouy en Josas, France) equipped with an amperometric detector and a CarboPac PA1 column. Eluent 1, 2, and 3 were 150 mM NaOH, 500 mM CH3COONa– 150 mM NaOH, and deionized water, respectively. A solution containing glucose, cellobiose, cellotriose, cellotetraose, cellopentaose, and cellohexaose at 10 mg/L was used as an external standard.
Model Description
Kinetic model for β-glucosidases
An M-M model integrating competitive inhibition by glucose has been developed to describe the β-glucosidase activity:
18
where E is the enzyme, S is the substrate (cellobiose or p-nitrophenol), ES is the enzyme-substrate complex, and P is the product. Under the pseudo steady-state hypothesis, the expression of the initial rate is given by Equation 3:
where [S]0 is the initial substrate concentration (mM), [P]0 is the initial product concentration (mM), [E]0 is the initial enzyme concentration (mM), Km is the M-M constant (mM), Kp is the inhibition constant (mM), kcat is the first order kinetic constant (per min), and rini is the initial rate of hydrolysis (mM/min).
Adsorption model for cellobiohydrolases
As proposed by Zhang and Lynd, cellulose is described as a glucose polymer containing i molecules of glucose (i corresponds to the degree of polymerization of cellulose). The Langmuir model is often used to describe the adsorption process.
1,32
This model assumes adsorption on uniform binding sites and formation of a monolayer without interaction between adsorbing molecules. The adsorption mechanism can be represented as:
The amount of adsorbed enzymes is given by Equation 5:
where [EGi] is the amount of enzyme-substrate complex per mass of solid (μmol/g), [Gi*]tot is the amount of accessible sites, i.e., the amount of cellulose chain ends accessible to cellobiohydrolases per mass of solid (μmol/g); [E] is the free enzyme molar concentration (μmol/L); and Kads is the adsorption constant (μM).
In their study, Zhang and Lynd defined Fa
as the fraction of bonds accessible to cellulases.
33
Considering that cellobiohydrolases I and II attack the reducing and nonreducing chain ends, respectively, there is only one adsorption site per chain of cellulose. It is therefore possible to calculate N, the number of moles of adsorption sites per gram of cellulose, if one knows the degree of polymerization i:
where M0 is the molecular mass of the monomer C6H10O5 (162.1 g/mol) and MH2O is the molecular mass of water (18 g/mol).
The fraction of cellulose chain ends accessible to cellobiohydrolases (Fa
) is then given by:
Kinetic model for cellobiohydrolases
The proposed mechanism, a modified version of the HCH-1 model developed by Holtzapple et al., is detailed below 34 :
 (Equation 8)
In this equation, [E] is the free enzyme molar concentration (μmol/L), [G1] is the glucose molar concentration (μmol/L), [EG1] is the molar concentration of glucose-enzyme complex (μmol/L), [Gi*] is the amount of free accessible sites per mass of solid (μmol/g), [EGi] is the amount of enzyme-substrate complex per mass of cellulose (μmol/g), [EGiG1] is the amount of glucose-enzyme-substrate complex per mass of cellulose (μmol/g) and [S] is the mass concentration of cellulose (g/L).
This model consists of two steps: the adsorption of free enzymes onto cellulose, described using Langmuir assumptions; and the hydrolysis of cellulose macromolecules into cellobiose. A noncompetitive inhibition model was chosen to describe glucose and cellobiose inhibition. It is assumed that the glucose-binding constant (Kp) is the same for all species and that the adsorption constant is not affected by glucose.
The cellobiose processive production rate is assumed to be first order relative to the concentration of bound enzymes. The adsorption process is considered to be fast compared to the kinetic process, and it is postulated that only bound enzymes can have a hydrolytic action.
33
Our experiments do not allow us to measure the initial production corresponding to the first 5 minutes of the reaction. Indeed, the operating conditions (temperature, mixing) are not homogenous at the very beginning of the hydrolysis. At this point in time, the hydrolytic conditions are representative of the dynamic that occurred along the whole enzymatic hydrolysis. For the model, we have added a constant called “fixation rate” that corresponds to the rate of sugar production occurring during the enzyme adsorption. Thus, the initial production rate can be calculated as follows:
Using the definition of the adsorption constant, the equation can be written:
To develop this equation, an enzyme material balance was performed, based on the assumption that the total concentration of enzymes is equal to the concentration of the free enzymes, of the bound enzymes, of the glucose-enzyme complex, and of the glucose-enzyme complex bound to the cellulose:
where [E]tot is the total enzyme concentration introduced for the reaction.
A substrate site balance was then performed based on the assumption that the total sites concentration is equal to the sum of the free and occupied sites concentration:
Equations 11–12
lead to a second-order equation:
where A=Kads; B=1+Kads·([E]tot −Fa·N); and C=−Fa·N.
The free binding sites concentration can be calculated by taking the positive solution of Equation 13. The free enzyme concentration can then be determined using Equation 11. Finally, the initial apparent rate can be calculated from Equation 10. The constants have been determined using the least-square minimization method.
A full kinetic model has to incorporate the influence of the temperature on the enzyme activity. Hydrolysis was performed between 30°C and 55°C to determine the pre-exponential factor and the activation energy using Arrhenius equation:
where A is the pre-exponential factor (per min), Ea is the activation energy (J/mol), R is the universal gas constant (8.314 J/mol/K), and T is the temperature (K).
We assumed that the activation energy of the fixation rate is the same as that of the processive rate and, consequently, the influence of the temperature on the fixation rate is given by the following equation:
where Afix is the pre-exponential factor for the fixation rate.
Results and Discussion
Kinetic Parameters and Adsorption Capacity of β-Glucosidases
The kinetic parameters of β-glucosidases—already determined for cellobiose and pNPG—can be obtained by numerical integration of Equation 3 using the least-square minimization method. 13 The lower apparent M-M constant for pNPG shows a higher affinity of enzymes for the synthetic substrate, and the ratio Km/Kp reveals the strong influence of glucose as a competitive inhibitor. Values of Km, kcat, KP and the activation energy corresponding to the industrial SP188 preparation from A. niger and the native β-glucosidase from T. reesei were used in the M-M model for the prediction of the β-glucosidase activity.
Recent publications compared the overall structure of several GH3 fungal β-glucosidases closely related to β-glucosidase of T. reesei. 35 β-glucosidase GH3B from Thermotoga neapolitana belongs to this GH3 family and possesses a thermostable domain that could bind to insoluble cellulose. 35 High affinity of this β-glucosidase for insoluble substrate could interfere with the hydrolysis of cellulose by cellobiohydrolases and endoglucanases. Therefore, the capacity of a purified preparation of the β-glucosidase of T. reesei CL847 to bind cellulose was evaluated on Avicel. Following incubation for 90 min at 50°C, in order to reach adsorption equilibrium, the proportion of unbound enzymes was directly determined using the Lowry method. Almost 80% of the total protein initially added remained in the supernatant, thereby demonstrating a relative low-binding capacity of this β-glucosidase to cellulose. Moreover, in the case of a cellulolytic cocktail, the affinity for cellulose of each enzyme is undoubtedly in favor of cellulases, which contain a carbohydrate binding module specifically dedicated to cellulose. As a consequence, the adsorption of β-glucosidases on cellulose is neglected in our model.
Adsorption Isotherms For Cellobiohydrolases
A fast comparison of the binding of CBHI and CBHII to the catalytic action was performed. Only 5 min were necessary to reach 90% of the final amount of enzyme bound to the substrate, and between 79–90% of the enzymes remained bound at equilibrium. Adsorption isotherms were plotted after 30 min of incubation at 4°C and at 50°C for CBHI and CBHII (Fig. 1 ). A comparative analysis of isotherms revealed that both enzymes are adsorbed to a higher extent at 4°C than at 50°C due to the turnover occurring during hydrolysis. This dynamic process is likely to allow processive hydrolysis or relocation of the enzymes to a new enzymatic site. 36 The maximum sites concentration and the adsorption constant can be calculated from the numerical integration of Equation 5; the determined parameters are presented in Table 1. As stated in the literature, at both temperatures CBHI binding capacity is higher than that of CBHII, and the adsorption constant is higher for CBHII, indicating a stronger binding of CBHII. 19,20
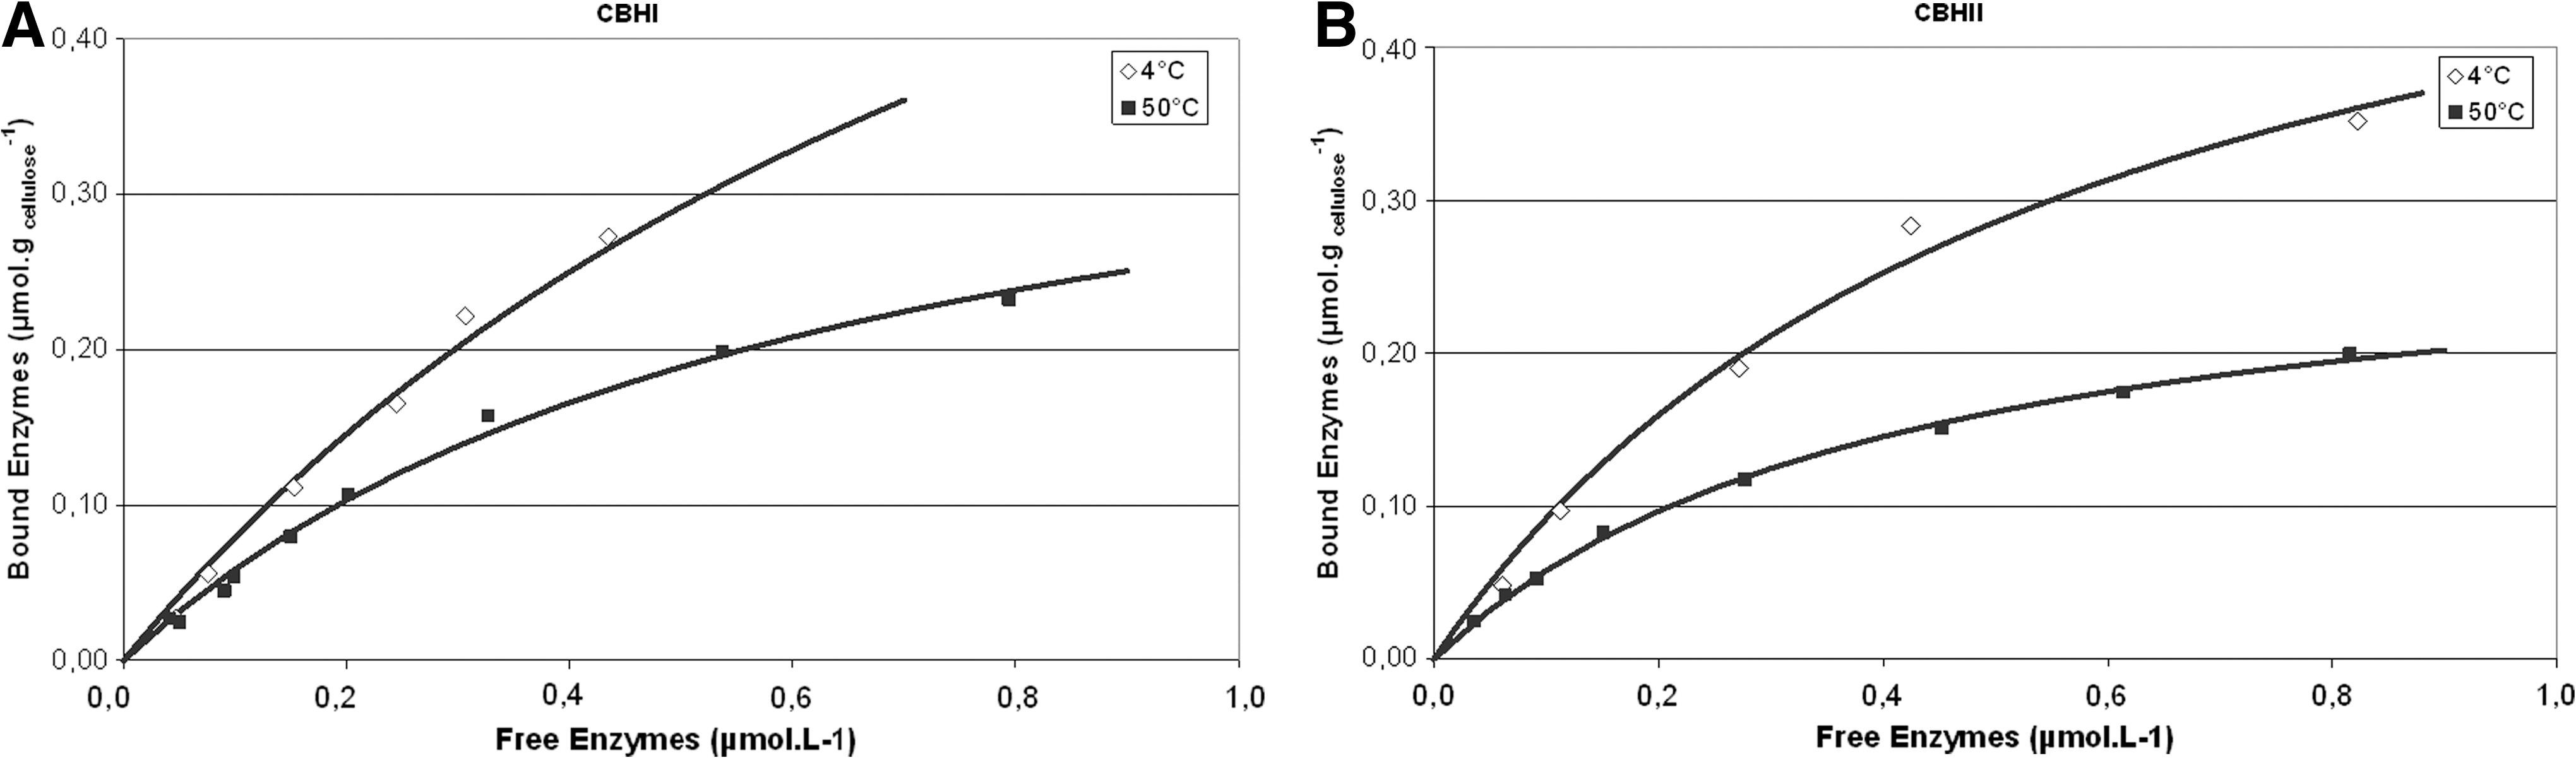
Adsorption isotherms for CBHI and CBHII.
Determination of the cellulosic fraction (Fa ) accessible to cellobiohydrolases (Table 1) shows that only 1.8% and 1.5% of the total chain ends are available to CBHI and CBHII, respectively. This value represents the maximum percentage of accessible sites and can be compared to the value proposed by Zhang and Lynd, who found that for Avicel only 0.6% of the chain ends are accessible. 5
Apparent Binding Parameters from Langmuir Model for Adsorption of CBHI and CBHII on Avicel
CBH, cellobiohydrolase; T, temperature; [Gi *]tot, amount of cellulose chain ends accessible to cellobiohydrolases per mass of solid; Kads, adsorption constant; Fa, fraction of cellulose chain ends accessible to cellobiohydrolases.
Kinetic Parameters For Cellobiohydrolases
As expected, hydrolysis of cellulose by cellobiohydrolases produces mainly cellobiose, but production of glucose and cellotriose was also detected. For each test, the amount of cellobiose produced increases significantly whereas the amount of glucose or cellotriose increases slightly or remains constant. For CBHI, the proportions of each product after 5 and 30 min were, respectively, 6.5±0.1% and 8.8±0.2% for glucose; 82.8±2% and 85.2±2.5% for cellobiose; and 9.7±0.3% and 6.0±0.2% for cellotriose. The same trend was observed for CBHII, with slightly less cellotriose and more cellobiose. All these results are close to those obtained by Medve et al. 21 Nidetzky et al. suggested that the first attack by cellobiohydrolases may release glucose or cellotriose as well as cellobiose and may be correlated to “false initial attack.” 37
Initial apparent rates of cellobiose production have been determined, and the relationship between these rates and the amount of bound cellulases is presented in Fig. 2. While investigating the hydrolysis of soluble cellooligosaccharides, Nidetzky et al. found that there exists a linear relationship between the hydrolysis rate and the amount of bound enzymes for CBHI, but not for CBHII. 37 They observed very low activities for low absorbed enzymes concentrations, and they proposed that nonproductive binding induced by the carbohydrate binding domain of CBHII is responsible for the nonlinear relationship. However, in our study, a linear relationship between the hydrolysis rate on cellulose and the bound enzymes concentration was observed for both cellobiohydrolases from 0.02 to 0.2 μmol/gcellulose. This indicates that our experimental setup does not allow for assessment of the initial rate of sugar production that occurs during the first period of hydrolysis, which is referred to as the fixation rate (rfix). It precedes the main hydrolytic period corresponding to the processive action of the cellobiohydrolases on the cellulose and is strictly proportional to the amount of bound enzymes.
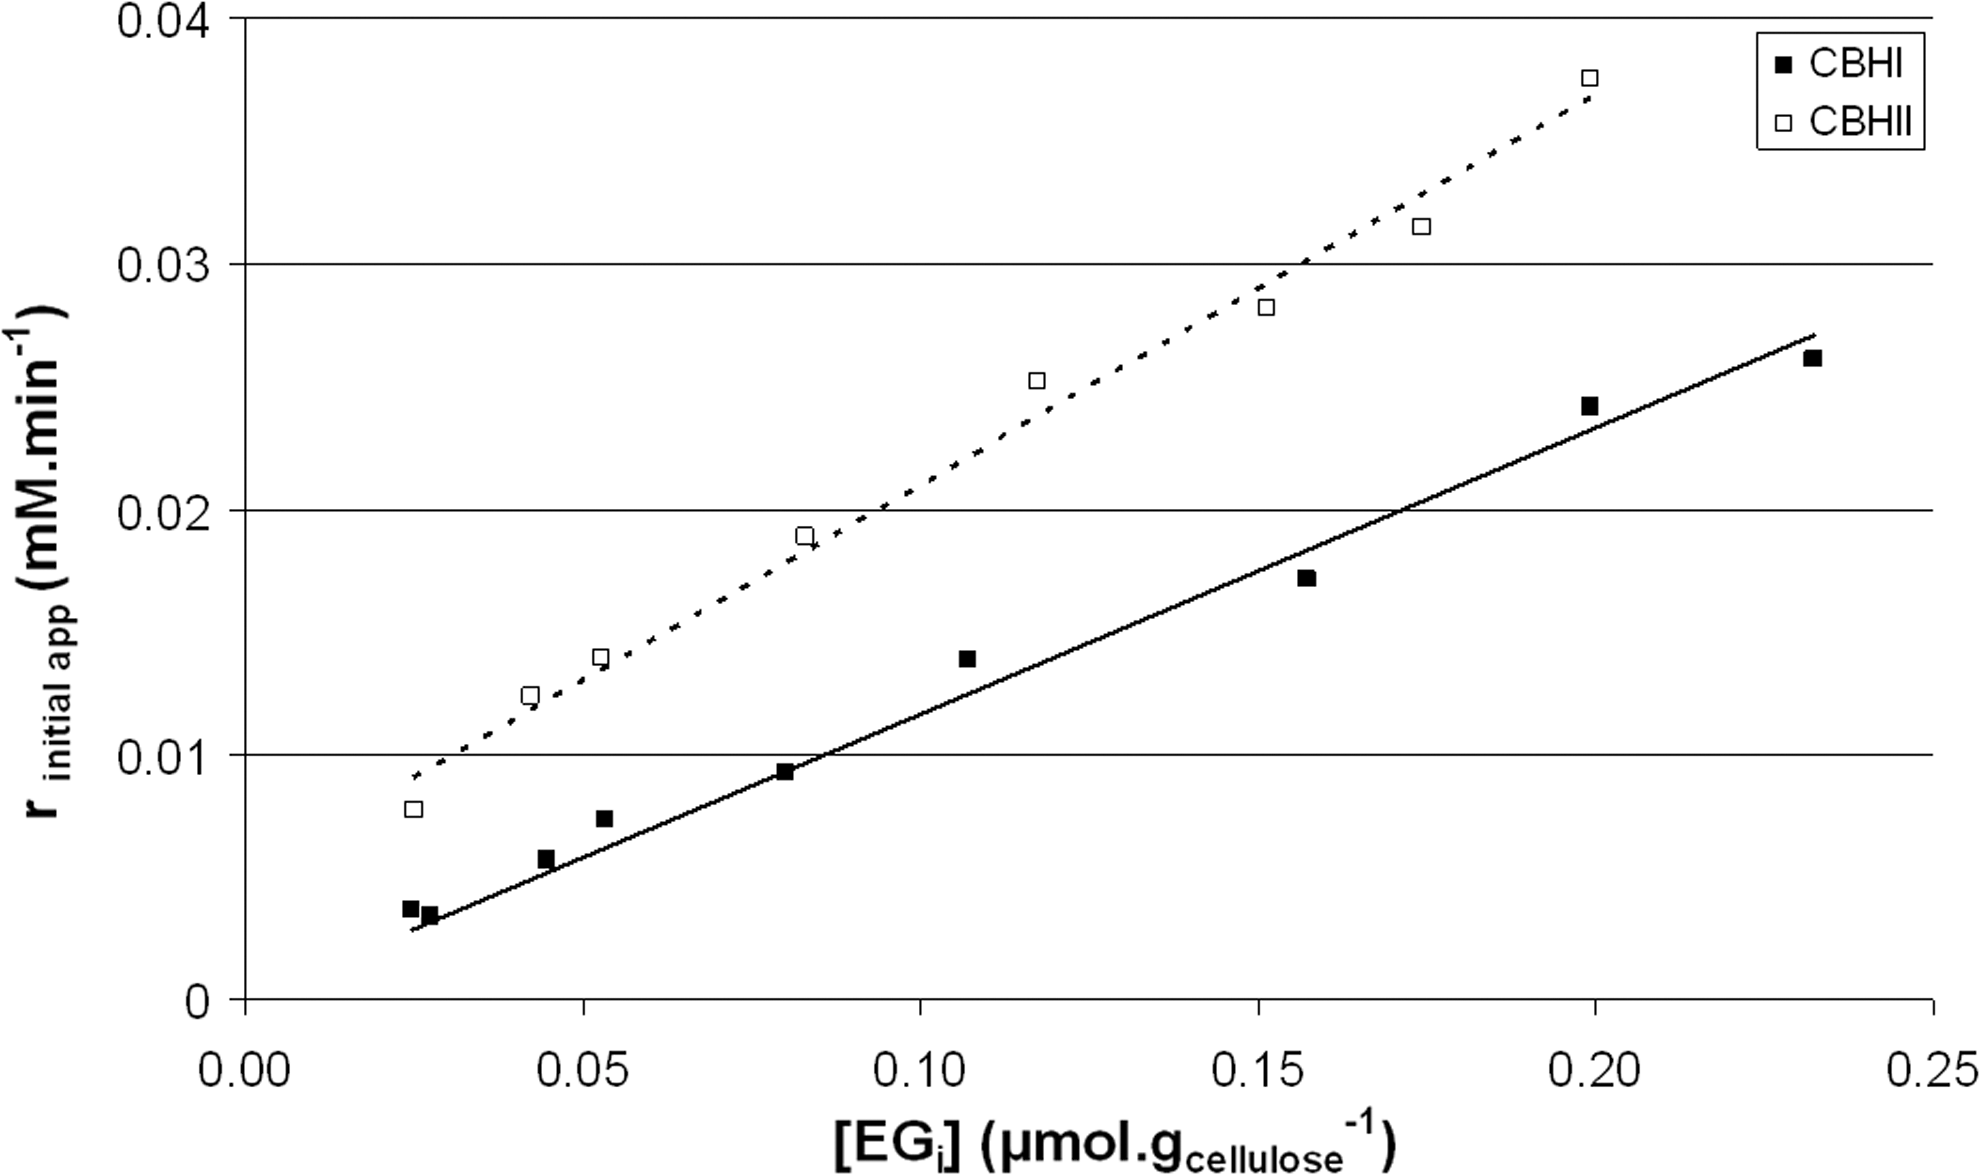
Cellobiose production rate versus the amount of enzymes bound on cellulose.
Kinetic parameters for CBHI and CBHII (Table 2 ) were determined as previously described. By comparing the first order kinetic constant of both enzymes, CBHII seems to have better hydrolytic activity due to a stronger affinity for cellulose and a more efficient catalytic action. The influence of temperature was also investigated, and we observed that CBHI is slightly more sensitive to temperature than is CBHII.
Apparent Kinetic Constants of CBHI and CBHII for the Hydrolysis of Avicel PH101
CBH, cellobiohydrolase; kcat 50°C, the number of substrate molecules turned over per enzyme molecule per second at 50°C; Ea, activation energy; A, adsorption constant, vfix, fixation rate; Afix , pre-exponential factor for the fixation rate; Kp , glucose-binding constant.
Glucose Inhibition of Cellobiohydrolases
The hydrolysis step involves an enzymatic cocktail enriched in β-glucosidases in order to maximize the conversion of cellulose to glucose. Moreover, the industrial saccharification of the lignocellulosic biomass is likely to be performed under high dry matter. To integrate these parameters, glucose inhibition was investigated in a large range of glucose concentrations. Figure 3 presents the effect of glucose on the catalytic activity and binding of CBHI and CBHII, respectively. The impact of the presence of glucose is drastically different for the two enzymes. Whereas CBHI is weakly affected, CBHII loses 50% of its activity in the presence of 120 g/L of glucose. In the case of CBHII, this loss of activity cannot be explained by a decrease of the amount of adsorbed enzymes, which remains almost constant. The noncompetitive inhibition mechanism was then used to take into account the specific glucose inhibition for CBHII, and an inhibition constant was also integrated (Table 2). The results are consistent with those described by Xiao et al. 38 However, our study allows us to distinguish between CBHII, which is affected by glucose, and CBHI, which is not sensitive to glucose inhibition.
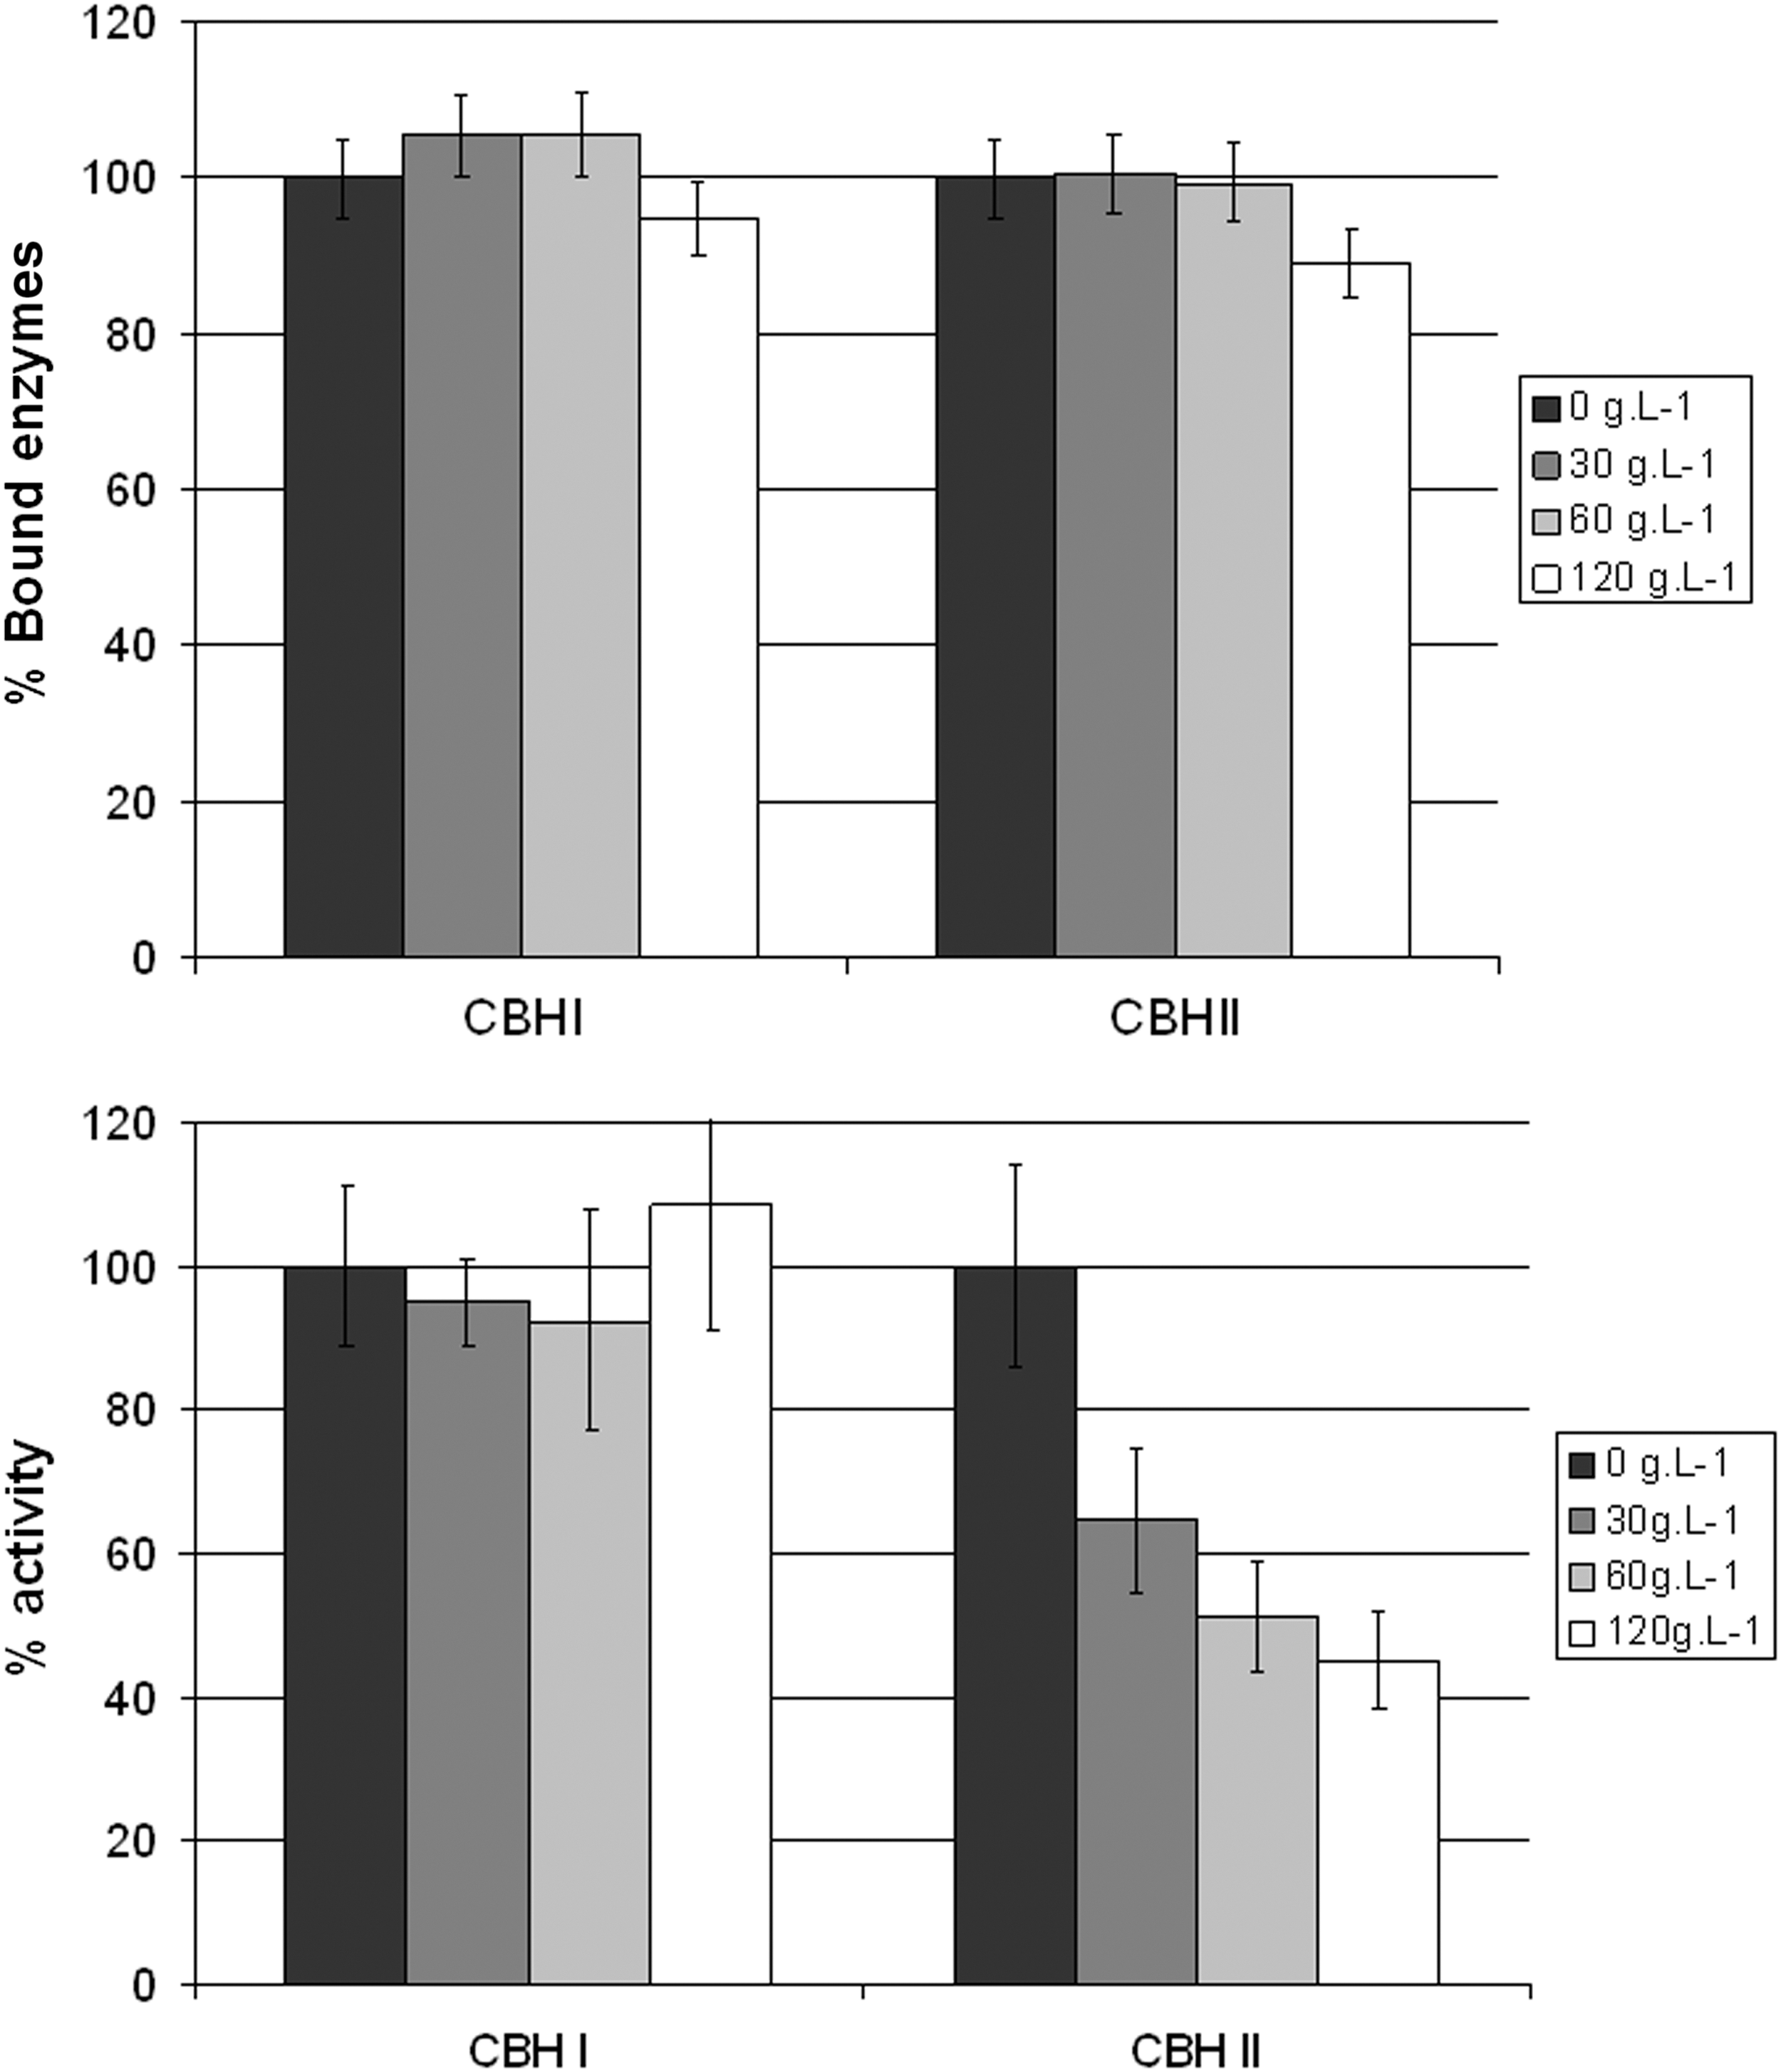
Influence of glucose on hydrolysis activity and enzyme adsorption.
Conclusions
This work contributes to the development of a reliable kinetic model by determining the intrinsic kinetic parameters of each enzyme involved in the hydrolytic process. An M-M model with competitive inhibition by glucose was previously developed to describe the activity of β-glucosidases from T. reesei and A. niger. 18 This model was used to predict the β-glucosidase activity in the classic T. reesei cocktail as well as the cocktail supplemented with commercial β-glucosidases (SP188).
A model taking into account the adsorption of the enzymes on cellulose and the kinetic activity has been developed to predict the activity of both CBHI and CBHII from T. reesei. This model, which is based on Langmuir assumptions, has allowed the comparison of both enzymes and led to several conclusions: adsorptive capacity of CBHI is higher than for CBHII; CBHII binding is stronger than for CBHI; CBHII has better hydrolysis activity and its reaction rate is linear with the amount of bound enzymes due to the introduction of a fixation rate; unlike CBHI, CBHII is sensitive to glucose inhibition, and the non-competitive model allows a good description of the inhibition mechanism involved; and the amount of chain ends accessible for hydrolysis by cellobiohydrolases is about 1.8% for CBHI and 1.5% for CBHII, which means that very few chains are accessible. However, cellobiose inhibition cannot be tested in our experimental conditions, and this parameter has to be further investigated to complete the kinetic model.
The present model was developed for purified cellulases (BGL, CBHI, and CBHII) and represents the first step in the development of a full mechanistic model to predict enzymatic hydrolysis of cellulose. This model can be used for both the supplemented and non-supplemented cocktail and, in further work, will be extended to take into account the morphology of the cellulose and the synergistic action of endoglucanases.
Footnotes
Acknowledgments
The authors would like to acknowledge the financial support of Agence de l'Environnement et de la Maîtrise de l'Energie (ADEME) with its doctoral fellowship. The authors are also grateful to Hugues Mathis and Sandra Menir for technical assistance and to Antoine Margeot and Frédéric Monot for helpful discussions.
Author Disclosure Statement
No competing financial interests exist.