
Abstract
Trichoderma reesei is a key fungus for industrial production of lignocellulolytic enzymes. The genome sequences of the T. reesei hyper-cellulolytic strain RUT-C30 and its parental strain QM6a were compared at the nucleotide level. Approximately 97% of the 87 genomic-sequence scaffolds of T. reesei QM6a (33Mb) were found to have the corresponding nucleotide in the 182 genome-sequence scaffolds of RUT-C30 (32Mb). There are 455 loci within the QM6 sequence not detected in the RUT-C30 sequence. Regions at the termini of QM6a scaffolds as well as 14 small scaffolds do not have corresponding regions in RUT-C30 genomic scaffolds. Seventy-eight protein-encoding genes are included within these regions. Mutated nucleotide(s) in 2,371 positions, including short insertion/deletions (indels), were detected in the aligned regions. The predicted protein-coding regions of 97 gene models contain mutations, 34 of which were not previously described. Twenty-seven out of 34 newly discovered genes were found to have mutations in the peptide amino acid sequence. This is in addition to 63 genes described in a previous study based on low coverage sequencing of RUT-C30. These newly identified proteins are involved in signal transduction, transcription, RNA processing and modification, and post-translational modification according to their annotations. Similar distributions of eukaryotic orthologous group (KOG) categories between the mutated and all other proteins suggest random mutation. The roles of the mutated genes and potential regulatory regions in the observed phenotype of RUT-C30 remain to be explored in a targeted fashion.
Introduction
Trichoderma reesei (teleomorph Hypocrea jecorina) is a soft-rot ascomycete fungus that has been used as an industrial production host for cellulytic and hemicellulolytic enzymes. The wild type strain QM6a was collected in the Solomon Islands during World War II and is the parent of a number of high enzyme-secreting strains derived by classical mutagenesis. Because it is the origin of several hyper-cellulolytic mutants, it is well regarded as a model in industrial fungal biotechnology.
A wide variety of filamentous fungi, including T. reesei, are used as production hosts for a multitude of proteins. 1,2 Strains of T. reesei are reported to produce a complex mix of cellulolytic enzymes in excess of 100 g/L. 3 The amount of the secreted enzymes is significant as it is not only elevated for cellulase production, but also more generally for protein secretion.
The majority of T. reesei mutants used in industry have been generated from the wild type QM6a strain. Because RUT-C30 and other T. reesei strains were generated by traditional mutagenesis and screening, the nature of the mutations is not fully characterized. 4 Knowledge of the genetic factors responsible for the cellulase hyper-producing phenotype is important for improving biomass saccharification as well as for enhancing the expression of heterologous proteins. Genome-wide analysis of the mutations in RUT-C30 lays a genetic foundation that may be translated into more economical production of enzymes needed for renewable bioenergy applications.
Prior to the genome-wide mutation analysis using massively parallel DNA sequencing, three mutations in T. reesei RUT-C30 were known: a truncation of the cre1 gene (tre120117), which is a key regulator in carbon catabolite repression; a frameshift mutation in the glucosidase II alpha subunit gene gls2 (tre121351) involved in protein glycosylation; and an 85-kb deletion that eliminated 29 genes. 5 –8 However, the mutant RUT-C30 has been known to differ from wild type in its growth morphology, as well as its hyper-cellulase-producing and catabolite-repressing phenotypes. There are likely to be multiple genes that, when mutated, account for these phenotypes.
The genome of the wild type strain QM6a was sequenced by the conventional method in 2008. 9 The comparison of genome sequences between the hyper-cellulose-producing mutant RUT-C30 and the wild type QM6a has been intriguing, with two studies published so far. 5,10 Vitikainen et al. used the array comparative genomic hybridization method to analyze the genome with 45–85 nucleotide probes and a mean tiling distance of ∼15 bp. 10 They found five rearrangement break points and 126 positions mutated in RUT-C30. Le Crom et al. mapped read sequences generated from massively parallel sequencing of the wild type QM6a genome, They identified 223 single nucleotide variations between the two strains, and found that 42 proteins were affected by the mutation. 5 In this study, we generated a de novo genomic assembly and a set of gene models for RUT-C30 to show the results of comparative genomic analysis between this strain and the wild type T. reesei strain QM6a.
Materials and Methods
Genome Assembly
The T. reesei RUT-C30 genome was sequenced using the Illumina (San Diego, CA) platform (2×150 0.2kb ill-std-pe IlluminaGAIIx, 2×76 4kb ill-pe-crelox IlluminaGAIIx, 2×76 16kb ill-pe-jmp IlluminaGAIIx) (Table 1). All general aspects of library construction and sequencing can be found at the Department of Energy Joint Genome Institute (JGI) website. 11 Each fastq file was filtered for artifact/process contamination and subsequently assembled with AllPathsLG release version R36892 (Broad Institute, Cambridge, MA). 12 This resulted in a 208x coverage assembly with 182 scaffolds, 1,015 kb scaffold N50, 3,2689,233 bp total scaffold, 623 contigs, 111.8 kb contig N50, and 3,2495,743 bp total contig. No expressed sequence tag (EST) data were available for analysis.
Library Coverage
n_reads, number of reads in input; %_used, % of reads assembled; scov, sequence coverage; n_pairs, number of valid pairs assembled; pcov, physical coverage.
Genome Annotation
The genome was annotated using the JGI annotation pipeline, which combines several gene prediction and annotation methods and integrates the annotated genome into MycoCosm, a web-based fungal resource for comparative genomics. 13,14
Before gene prediction, assembly scaffolds were masked using RepeatMasker, RepBase library, and most frequent (>150 times) repeats recognized by RepeatScout. 15 –17 The following combination of gene predictors was run on the masked assembly: ab initio Fgenesh and GeneMark; homology-based Fgenesh+ and Genewise seeded by BLASTx alignments against National Center for Biotechnology Information (NCBI) non-redundant (NR) database; and transcriptome-based CombEST. 18 –21 In addition to protein-coding genes, tRNAs were predicted using tRNAscan-SE. 22 All predicted proteins were functionally annotated using SignalP for signal sequences, TMHMM for transmembrane domains, InterProScan for integrated collection of functional and structural protein domains, protein alignments to NCBI NR, SwissProt, KEGG for metabolic pathways, and KOG for eukaryotic clusters of orthologs. 23 –29 Interpro and SwissProt hits were used to map gene ontology terms. 30 For each genomic locus, the best representative gene model was selected based on a combination of protein homology and EST support, which resulted in the final set of 6,903 gene models used for further analysis.
Comparative Genomic Analysis
Genomic scaffold sequences of QM6a were aligned against those of RUT-C30 using BLAST+ version 2.2.27 (NCBI) with default parameters and without using a mask of sequences. 31 Subsequently, aligned pair-wise sequences with significant homologies were identified; only aligned regions with significant similarity (E-value <1e-10 and mutation <0.01%) were included, and overlaps of these regions were eliminated manually. Unaligned regions were submitted for further homology search using the same programs, and 96.8% of the scaffold sequences were detected to have corresponding regions in RUT-C30. In the final round of analysis, regions with homology (mutation <0.1%) were included. The relation of the scaffold regions was verified with the alignment analysis of the reverse relation (RUT-C30 sequences were aligned against QM6a sequence) and the alignments derived by MUMmer 3.0. 32
The dot plots were generated by MUMmer 3.0 and some breakpoints were detected by the plot. The positions and sequences of mutations were extracted using our own script from the alignments derived from Blastn analysis with the b-top option. The positions of mutations/deletions relating to exons and introns were checked using the gtf information derived from the JGI's Genome Portal. 33 The nucleotide mutations were translated to the amino acid sequence and checked manually to determine if the mutation affected the amino acid sequences. Mutations and deletions in non-coding regions upstream 1,000 bp and downstream 1,000 bp were also detected.
Eukaryotic orthologous groups (KOG), protein domain, and signal sequence information were derived from the Genome Portal. The “best hits” against Saccharomyces cerevisiae coding sequences (CDSs) were detected by Blastp with the cutoff of E-value 1e-5. The annotation of the yeast CDSs was derived from the Saccharomyces Genome Database. 34
Results and Discussion
Comparative Genomic Analysis
A variety of methods has been used to shed light on the biology of enhanced enzyme secretion in T. reesei RUT-C30 (Table 2). 4,6,7,35 –39 Different morphologies for the endoplasmic reticulum and Golgi apparatus have been described in mutant strains, but it is difficult to associate these phenotypes with specific genetic mutations. Some genetically engineered mutants with altered production of enzymes have been reported. 40,41 It is interesting to consider the ways in which the morphological and secretion phenotypes of the RUT-C30 are due to alterations in the production level of the enzymes.
Phenotypes of RUT-C30 and Comparison with QM6a
The genome of the wild type strain QM6a was sequenced by the Sanger method. 9 The genome of T. reesei was generated by shotgun sequencing to approximately 9× from three libraries differing by insert size. These data were combined with more than 6,000 bacterial artificial chromosome (BAC)-end sequences, and a high-quality draft assembly was created using the JGI shotgun assembler Jazz. The number of scaffolds is 87, and the total length of the scaffold sequences is approximately 32.7 Mb (Table 3). These scaffold sequences are maintained in the JGI Genome Portal site. 33
Statistics of Genome Sequencing of the Two Strains
Le Crom et al. mapped read sequences generated from massively parallel sequencing to the wild type QM6a genome sequence. 5 In this study, the genome of the RUT-C30 was determined using the same massively parallel sequencing method as was used in the mapping study by Le Crom et al., while the coverage of the genome by the sequencing read was higher (208x). Thus, a more detailed comparison at the single nucleotide base level is expected.
Due to the short read length (∼100 bp) in the sequencing, we expected that the average scaffold length would be shorter and the number of scaffolds greater than those typically associated with Sanger sequencing (∼800 bp). The number of scaffolds of the RUT-C30 genome (182) is more than that of QM6a (87), and the L50 value of the RUT-C30 genome (1.02 Mb) is less than that of QM6a (1.22 Mb). However, the cumulative lengths of the largest 10 scaffolds are nearly the same for RUT-C30 (17.1 Mb) and QM6a (17.9 Mb). Though the sequencing methods applied to the two genomes were different, and the length of the massively parallel sequencing is shorter than the conventional Sanger method, quality of the de novo assembled genome sequence of the RUT-C30 strain is high and sufficient for comparison to that of QM6a.
We performed an alignment of the assembled scaffolds with the reference genome sequence using the Blastn program with default settings to detect the difference between the two strains. Based on the output, we picked up aligned regions that are 1,000 bp or longer with mutation of less than 0.1% of the region. From the mapping comparison of the two genomes, we calculated a mutation rate of 6.56×10⁻⁶ per whole genome.
5
Thus, an aligned region with mutation of more than 0.1% (1×10⁻³) is not expected in the mutation process. In fact, we were able to map QM6a scaffolds to RUTC30 scaffolds one-to-one at a single base level except for the two base pairs at a rearrangement point. Using this mapping method, 32,460,861 bp of the QM6a genome sequence (97.0%) were covered, indicating that nearly all of the mutations were scattered randomly. Data are included in the Supplementary Materials section, Supplementary Table S1. (Supplementary Materials are available online at
Fourteen scaffolds of QM6a do not have counterparts in RUT-C30: QM6a scaffold numbers 65, 66, 67, 71, 75, 76, 79, 80, 81, 82, 83, 84, 85, and 86. On the other hand, 23 scaffolds of RUT-C30 do not have counterparts: RUT-C30 scaffold numbers 91, 99, 101, 103, 106, 114, 117, 119, 120, 121, 122, 124, 126, 132, 134, 136, 137, 142, 145, 147, 161, 176, and 181. Only a few RUT-C30 scaffolds have weak homology with terminus of QM6a scaffolds (Supplementary Table S2), and nearly all the termini of QM6a scaffolds have no counterpart in RUT-C30.
Rearrangement
Rearrangements generated from multiple rounds of mutagenesis were detected as breakpoints in dot-plot comparisons to QM6a scaffolds with significant alignment (Fig. 1). The detailed breakpoints were analyzed from the list of scaffolds matched between the two strains (Supplementary Table S3). If a single scaffold of RUT-C30 had more than two counterpart QM6a scaffolds, it was considered to be indicative of a rearrangement. We identified 11 potential rearrangement points. At least some of these may be due to an assembly error, although three were previously identified by Vitikainen et al. using the array comparative genome hybridization method. 10 An example of the complicated relationship of breakpoint and connections of scaffolds is shown in (Supplementary Fig. S1). 10
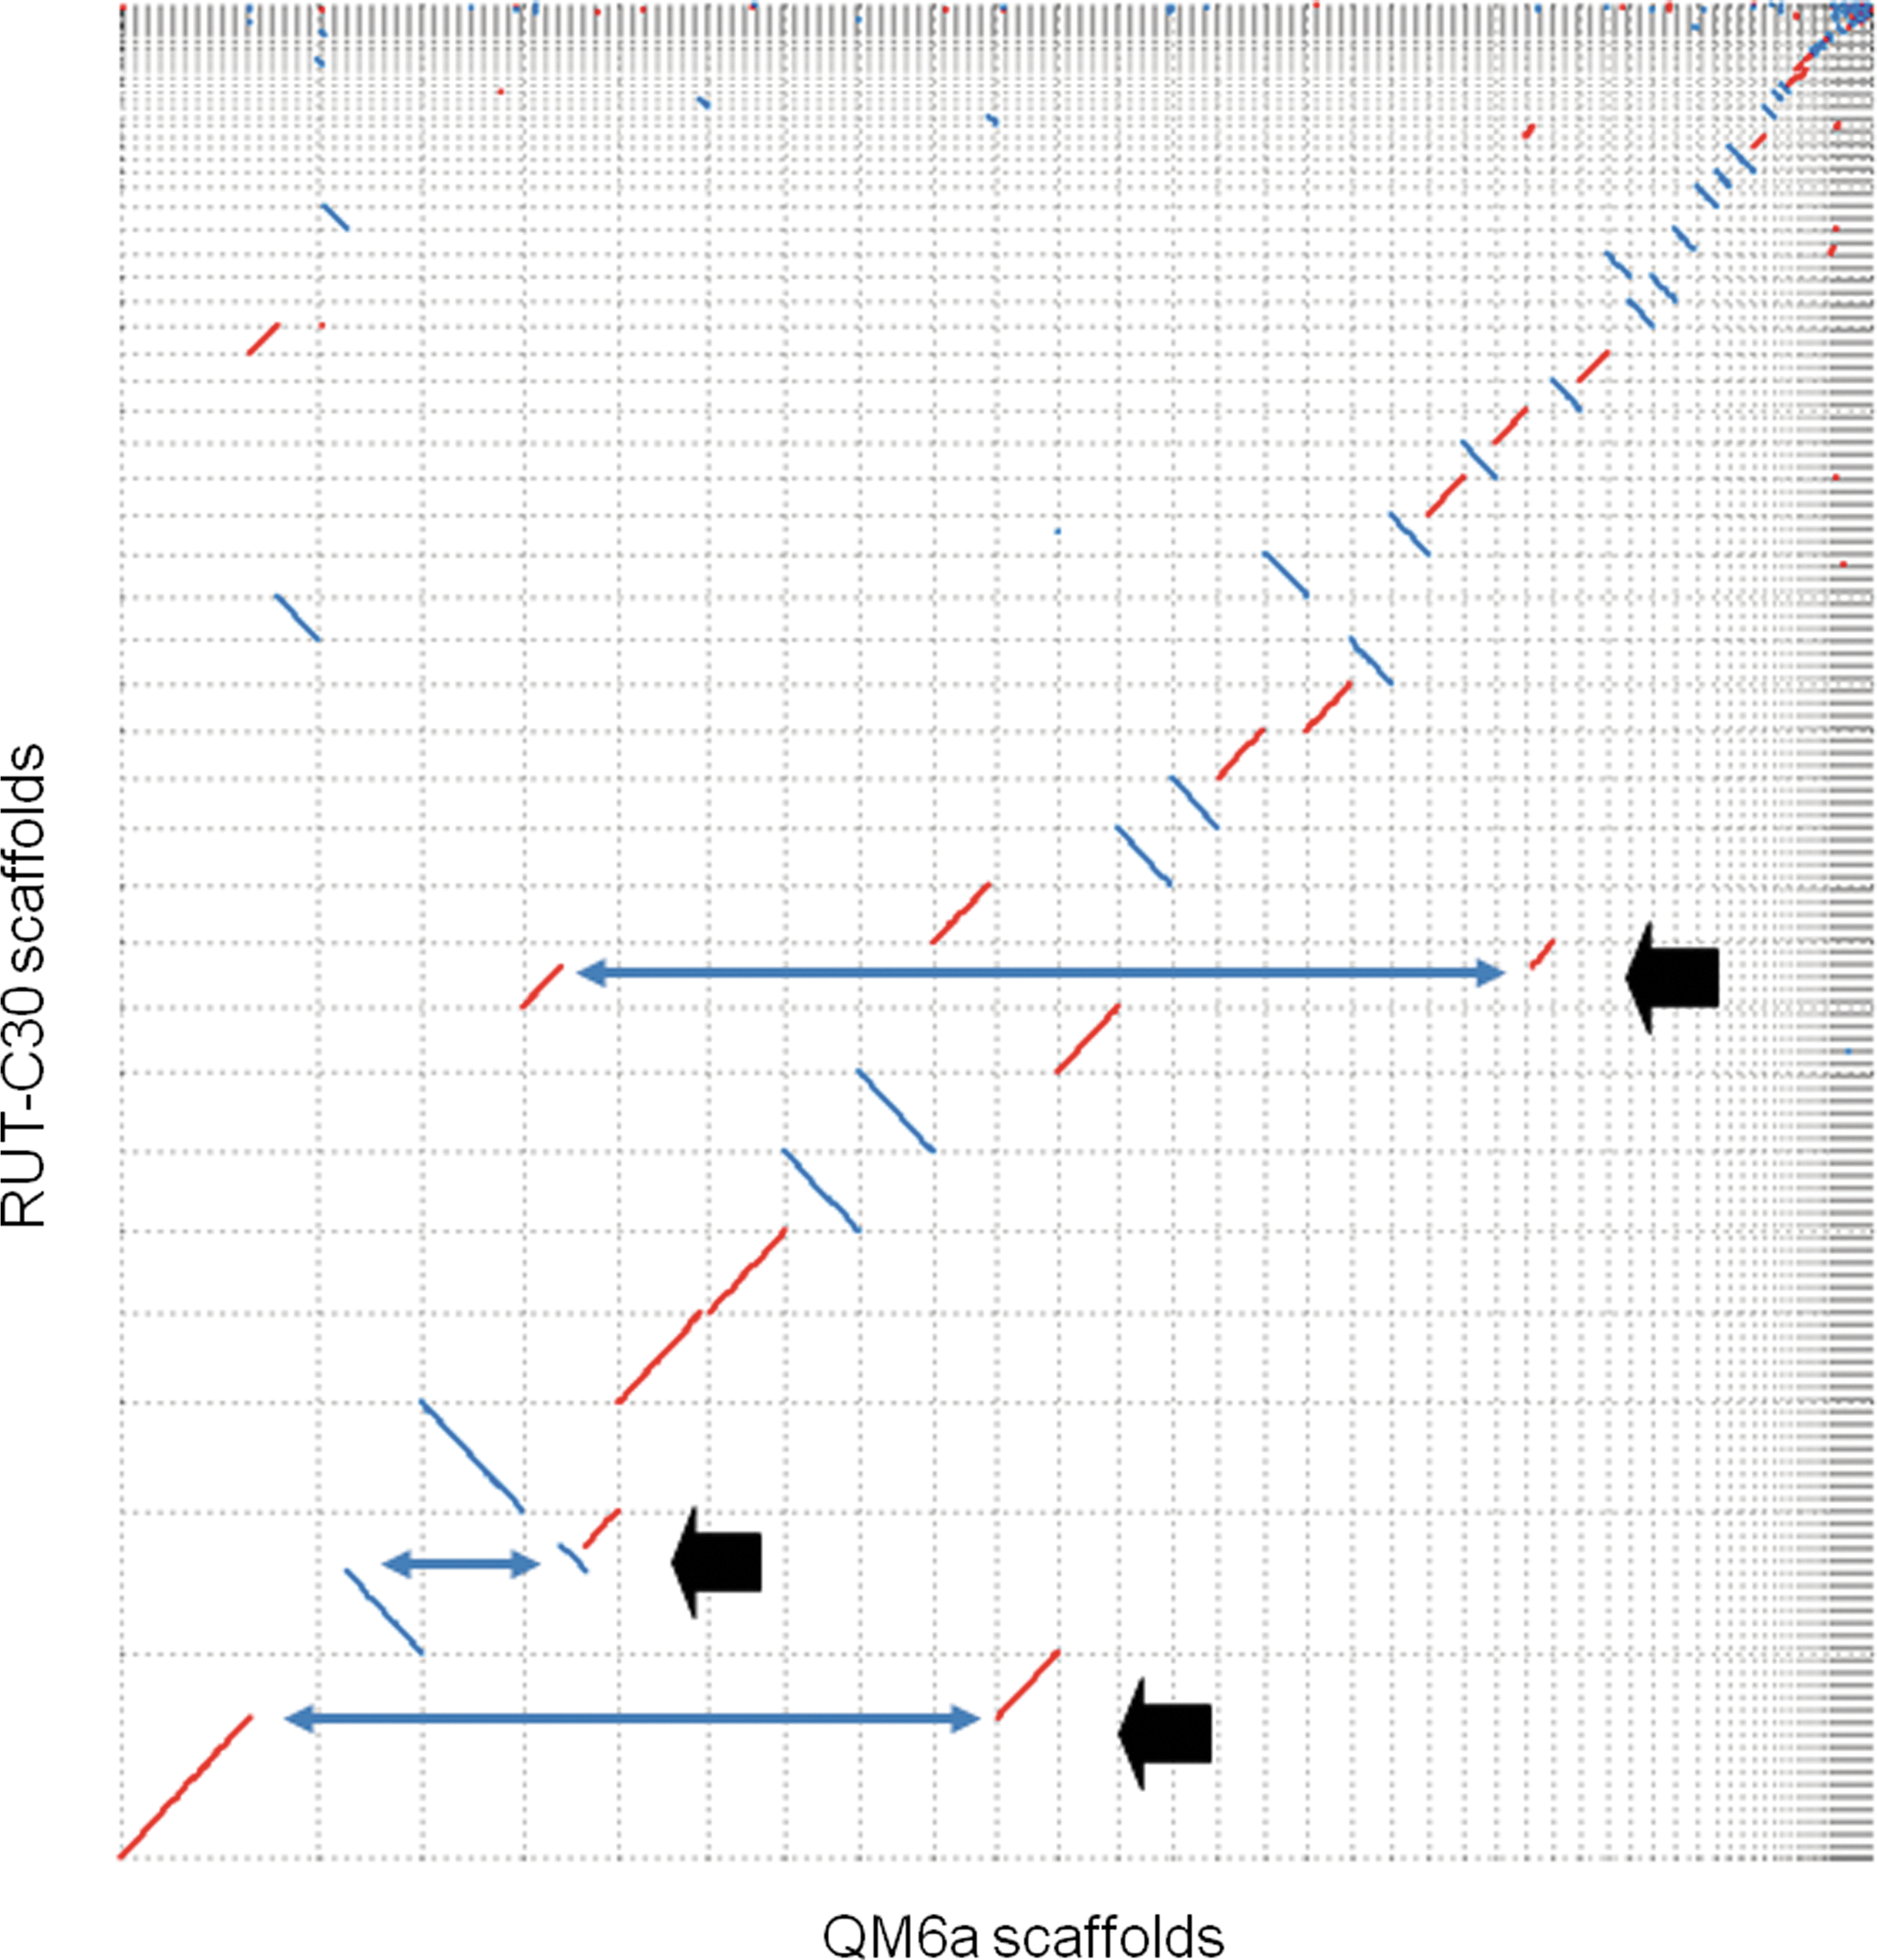
Dot plot of the scaffolds of the two T. reesei strains. Scaffolds were sorted by their size. Three breakpoints (arrows) indicate where chromosomal rearrangements might occur.
With the advent of electrophoretic karyotyping, researchers are able to use contour-clamped homogeneous electric field gel electrophoresis to compare the genomes of QM6a, RUT-C30, and other hyper-cellulolytic strains. 42,43 Prior to genome analysis by the comparative genomic array hybridization method, some rearrangements had been predicted by electrophoretic karyotyping. 10 Carter et al., reported that seven DNA bands were seen for both QM6a and RUT-C30, but the separation between chromosome V and VI was less in RUT-C30 than the wild type, indicating the chromosomal rearrangement in RUT-C30. 43 They reported the genome sizes of 32.5 Mbp and 34.7 Mbp for QM6a and RUT-C30, respectively. Interestingly, the cumulative size of scaffolds of RUT-C30 (32 Mb) is less than that of QM6a (33 Mb) in this study.
Mutation and Deletion
By aligning RUT-C30 and QM6a scaffold sequences at the single base level, we identified 2,371 sites with differences in sequence (Supplementary Table S4). Many are contiguous sequences of a single nucleotide (e.g., CCCCC). Ninety-seven of the 2,371 sites are inside protein-coding regions. It is interesting that the ratio 97/2,371 (4.1%) is much less than the ratio of coding region in the whole genome sequence (40.40%), indicating that most mutations took place in the intergenic regions. 9 Sixty-three out of the 97 protein genes were detected in the previous analysis by mapping. 5 Of the 34 newly identified mutated genes, 27 are predicted to harbor nonsynonymous mutations.
There are 455 loci for which no homologous region was detected by the alignment in the RUT-C30 scaffolds, indicating the possibility of deletion (Supplementary Table S5). In some cases, the “missing” sequence of the RUT-C30 scaffold is a contiguous sequence of N, while in other cases, the length of the correspondent scaffold is significantly different and no alignment was constructed. We note that the mutation ratio is much higher than that reported by Le Crom et al. (6.56×10⁻⁶). 5 A few thousand bases of every terminus of QM6a scaffolds were missing. There are 65 potential deletions of loci that contain protein-coding regions of 78 genes, excluding the known large deletion of 85 kb and cre1. Twenty of the 78 genes have partial sequences in RUT-C30 scaffolds.
List Of Genes Affected
A list containing all of the affected genes is shown in Table 4, including silent mutations. 5 –8,10 The list also contains mutated and deleted genes described previously. In total, 108 genes have been found to have deleted sequences, including cre1 and 29 genes in an 85-kb deletion discovered previously. 8 While several affected genes were found in the previous analysis to be related to the phenotype of the strain, we found a similar tendency in the annotation descriptions of silent mutation genes. 5 We found the distributions of mutated genes by the KOG categories to be similar to those of all the genes in the genome (Supplementary Table S6), indicating the mutagenesis event took place randomly over the whole genome.
Proteins Affected by Mutation/Deletion Between the Two Strains
Sorting signal was detected by SignalP program.
Gene has partial sequences homologous to the corresponding QM6a gene.
Many genes are thought to be relevant to the high cellulolytic enzyme secretion phenotype of Trichoderma, and many were found to have mutations or deletions in the RUT-C30 sequence (Supplementary Table S7). Four of the 228 CAZy genes have deletions, and three genes have mutations in their exons. 44 Four genes having deletions and two genes having point mutations are regulated by Lae1. 45 Several listed genes have deletions upstream or downstream of the genes and could be affected at the level of expression (Supplementary Table S7). 44 It is interesting to note that a Ras GTPase (tre120150), which is reported to modulate morphogenesis, sporulation, and cellulase gene expression in another strain (QM9414), has mutation in its upstream region. 46
Conclusions
Comparative genomic analysis of two strains of T. ressei has revealed several different mutations between the strains. From these mutations we hope to find the genetic factors that underlie their differences in phenotypes.
Traditionally the function of a gene is tested by disruption using gene-targeting techniques and is verified by a complementation test that involves introducing wild type gene(s) into the mutant. It is possible to test the function of the all of the mutated genes by introducing QM6a genes into RUT-C30 and observing whether the phenotype of RUT-C30 changes to that of QM6a. The function of the cre1 deletion of RUT-C30 was tested using this method. 6 Several tools of genetic engineering have been established for this fungus. 47,48 The comparative genomic analysis of the two strains shows mutations in 2,371 loci and deletions in 455 loci, including the 178 affected protein genes. While the relatively modest size of the T. reesei research community may prevent the generation of a genome-wide knockout collection, it would be feasible to generate a collection of knock-out strains for the 178 genes of the two strains. 49 Moreover, the discovery of genetic crossing using QM6a enables the combination of different properties of strains by sexual crossing and makes a forward genetic strategy based on identifying genes associated with hyperproduction of cellulolytic enzymes a possibility. 48,50
Genome-wide, high-throughput analysis of additional types of omics analysis data may help to narrow down the possible candidates. Studies focused on the proteomic analysis of cellulolytic enzymes for direct comparison between T. reesei RUT-C30 and QM6a were performed. Herpoel-Gimbert et al. analyzed the proteins secreted by another efficient cellulolytic T. reesei strain, CL847, using two-dimensional electrophoresis (2DE) and matrix-assisted laser desorption-ionization time-of-flight mass spectrometry (MALDI-TOF) or liquid chromatography-tandem mass spectrometry (LC-MS/MS). 51 They identified a total of 22 protein species, and based on the identified spots on 2DE, they compared the secreted proteins between RUT-C30 and CL847 produced on lactose as the only carbon source. They found that the 2DE profiles of the two strains were very different in terms of both spot numbers and protein composition. 51 It is interesting that differences in protein spots representing a higher percentage of the total spot volume are due to the presence of several Cel7A isoforms for CL847, while a single and bigger spot is visible for RUT-C30. They also found that trypsin was absent in RUT-C30 and hypothesized that the presence of the protease resulted in the presence of degraded forms of proteins in CL847 and a much higher number of spots.
The production of cellulolytic enzymes is tightly regulated by a variety of transcription factors and other proteins such as Lae1. 45 Transcriptional regulation plays a key role in determining the cellulolytic phenotypes, and it is likely that there are differences in transcriptional regulation between strains. Moving forward, direct RNA-seq-based comparisons of the gene-expression differences between QM6a and RUT-C30 will deepen our understanding of the known genetic differences reported between these two strains.
Arvas et al., found that in certain gene clusters, expression of all of the genes expressed, had significant positive/negative correlation to protein secretion. 52 One such gene cluster is located very near to the rearrangement point on scaffold 1 (data not shown), though other clusters are not explained by the rearrangements. It is interesting to note that genes whose expression was regulated by Lae1 have mutations or deletions in exons as well as upstream and/or downstream regions. 45
The genome assembly and annotations described here can be interactively accessed through the JGI fungal genome portal MycoCosm. 53,54
Because of its high secretion level of cellulases and hemicellulases, T. reesei has become a model research system for fungal biotechnology, especially with regard to protein production. 55 The amount of cellulolytic enzymes produced by T. reesei is significantly high, not only for cellulase production in fungi but also for protein production by microorganisms in general. Much research has been conducted to reveal the biology that underlies its high protein production and secretion mechanisms. Studies involving functional genomic analysis of T. reesei have continued to increase since the genome sequence of wild type QM6a was reported. 9 It is interesting that several hyper-cellulolytic mutants have been derived from the wild type by classical mutagenesis methods; knowledge and understanding of the genetic factors responsible for the differences between the wild type and hyper-cellulolytic mutants will continue to be especially valuable. Among the mutants, RUT-C30 is one of the most productive. Comparative genomic analysis between RUT-C30 and QM6a has revealed a significant list of mutations for the whole genome and tools to explore these genes in greater detail, so their relationship to phenotypes of high interest can be established. 49 Using a combination of cellular and molecular biology tools set against a robust genomics landscape, the genetic factors responsible for the hyper-cellulolytic phenotype are expected to be elucidated.
Footnotes
Acknowledgments
A portion of this research was performed at Environmental Molecular Sciences Laboratory (ESML; Richland, WA), a national scientific user facility sponsored by the Department of Energy's (DOE) Office of Biological and Environmental Research and located at Pacific Northwest National Laboratory (PNNL). PNNL is a multiprogram national laboratory operated by Battelle Memorial Institute for the DOE under Contract DE-AC05-76RLO 1830. Hideaki Koike is an EMSL Wiley Visiting Scientist and is also supported by the grant-in-aid of the Ministry of Economy, Trade, and Industry, Japan. The work conducted by the US DOE JGI is supported by the Office of Science of the US Department of Energy under Contract No. DE-AC02-05CH11231. The authors thank Mark Butcher for editorial assistance.
Author Disclosure Statement
No competing financial interests exist.