
Abstract
The economic performance of cellulosic ethanol production from forest resources was contrasted with that of other bioenergy options: biopower, combined heat and power, wood pellets, and Fischer-Tropsch liquids (biomass-to-liquids). Techno-economic models were designed for each conversion facility and a trucking model was used to determine delivered feedstock cost in central British Columbia, Canada. Facilities and processes were analyzed for their sensitivity to feedstock type (sawdust/shavings, whole logs, pulp chips, harvest residues, and hog fuel), scale (0.05–4 million bone dry tonnes per year), and product revenue volatility (based on historical volatility of proxy fossil fuels). Internal rate of return (IRR) was used as the primary metric for economic performance comparison. Under the base case scenario, with 0.2 million bone dry tonnes per year in the form of whole logs (roundwood), all facilities had a negative IRR, indicating that dedicated bioenergy harvest may be economically challenging at current market prices. However, all bioenergy options, and in particular wood pellets, were more attractive when the feedstock was switched to mill or harvest residues. Despite a higher cost for feedstock delivery, IRR increased for all technologies except for wood pellets as facility scale increased. The revenue required for a 15% IRR highlighted the structural market and policy differences between ethanol, electricity, and pellets, which may make it difficult for cellulosic ethanol producers to compete for forest feedstocks and investment under the current regime.
Introduction
Forest biomass can be used to produce a variety of forms of energy, including electricity, high-efficiency heat, and liquid transportation fuels, all of which can be integrated into the existing fossil fuel-dominated energy infrastructure. Biomass combined heat and power (CHP) and wood pellet production stand out as successful bioenergy industries due to both the increasingly large number of commercial facilities that exist and the overall rapid rate of growth in production. 1,2 However, substantial investment in research and development could lead to the successful and profitable production of liquid biofuels, including cellulosic ethanol and Fischer-Tropsch (FT) liquids, from lignocellulosic forest biomass. The multiple bioenergy product options for forest feedstocks create competition for these raw materials. This paper focuses on the question of whether cellulosic ethanol will be able to compete with other bioenergy options for forest feedstock and which feedstock technology and product chains will be the most profitable relative to risk.
Biomass Conversion and Competition
Biopower and CHP
Global biopower generation was estimated to be 350 terawatt hours (TWh) in 2012. 3 In North America, biomass is one of the largest sources of renewable power, providing 8.2 TWh in Canada and 55 TWh in the United States each year. 4,5 As a contributor to electricity supply, however, these figures are small, representing approximately 1.3% of total production in both countries. The vast majority of biopower generation in the US and Canada comes from the forestry sector, with 80% of the wood-to-energy sourced from indirect sources such as the burning of black liquor (a lignin-dominated by-product of wood pulp production) and sawmill residues. 6
Boilers, in which the heat of combustion is used to produce high-pressure steam that drives a turbine generator, are the most widely utilized technology for electricity generation. The two primary technologies for combustion of biomass are grates and fluidized beds, with both options providing significant flexibility in biomass feedstock properties and the ability to cofire with coal. 1 The four main types of grates are stationary sloping, travelling, reciprocating, and vibrating—with progressively higher carbon burnout efficiency and combustion control in that order. 7 Fluidized beds are typically used for larger facilities, e.g., those that produce more than 10 MegaWatts electrical (MWe), and are available in three main types: bubbling, circulating, and entrained-flow, with the last requiring very fine particles. 1,8 While production of biopower at a scale smaller than 2 MWe is technically feasible using steam generation, large economies of scale and regulations regarding operating personnel—such as a power engineer to be onsite at all times—make it not economically viable in many jurisdictions. Options for biopower generation at scales less than 2 MWe include Organic Rankine Cycle and gasification combined with an internal combustion engine. 9
Electricity produced from biomass must be competitive with fossil fuel-based generation (e.g., coal-fired, natural gas), nuclear power, and renewables (e.g., wind, solar photovoltaics, solar thermal, geothermal, hydroelectric). Modern biomass powered generation facilities typically range in net efficiency from 20–35%. 10,11 To increase overall plant efficiency, CHP systems capable of capturing heat as well as electricity can be employed, provided that a use for the heat can be found. 1 Biomass competes with coal, peat, and natural gas in fuel-flexible power and CHP applications, while also competing in the heating market with natural gas in gas-grid connected areas and oil, propane, and electrical heat in off-grid areas.
Wood pellets
Wood pellets are one of the most common biomass-based fuels and an internationally traded commodity utilized for residential and district heating, fuel for CHP units, cofiring with coal in power plants, and, potentially, as a feedstock for lignocellulosic liquid biofuels. Wood pellets are typically produced from sawdust and shavings generated during lumber production or from low-grade timber that has been chipped and ground. Particles are dried to <10% moisture content and reduced in size using a hammer mill. Pellets are traditionally 6–8 mm in diameter and less than 38 mm long, and are formed using heat and extrusion through a circular pellet die. 12 Pellets produced from woody biomass require no additional binders to retain their structural integrity because of the melting and rehardening of lignin, which functions as the pellet binder, during production. 2 All pellet production equipment, including hammer and pellet mills, dryers, and coolers, are off-the-shelf, with several manufacturers competing in the marketplace. 2 Wood pellets can be fired in coal power plants at rates of 10–100%, depending on the boiler technology employed. 13 Potential for growth is huge; a worldwide 10% cofiring rate, based on about 8,200 TWh of generation and assuming 30% conversion efficiency and 17 gigajoules/tonne (GJ/t) pellets, would require 579 million tonnes of wood pellets—significantly more than the 22.4 million tonnes of wood pellets produced in 2012. 14
Transportation biofuels
Advanced liquid transportation biofuels produced from lignocellulosic biomass have received significant investment, particularly in the US where an emphasis on transportation fuel energy security has driven government support. The US Department of Energy announced investments of up to $365 million in six commercial biorefineries in 2006; $200 million in seven small-scale facilities in 2008; and $564 million in 14 pilot-scale and four demonstration-scale projects in 2009. 15,16 The first commercial lignocellulosic biofuel facilities utilizing agricultural residues were completed in 2012 and are currently ramping up production.
Two primary platforms for conversion of solid biomass to liquid biofuels are the biochemical and thermochemical approaches. Biochemical conversion requires pretreatment (e.g., steam, organosolv, or ammonia fiber explosion) that enhances fractionation and recovery of the hemicellulose and lignin streams and increases accessibility of the cellulase enzymes to the cellulosic component of the biomass. This is followed by hydrolysis, carried out by either acid or by cellulase enzymes sourced from microorganisms such as Trichoderma reesei, which cleave the β-1-4 glycosidic bonds of cellulose to release individual glucose monomers. The glucose, and potentially the other 5- and 6-carbon sugars of hemicellulose, including xylose, galactose, mannose, and arabinose, can be fermented to ethanol or to other alcohols such as butanol using organisms such as yeasts (e.g., Saccharomyces cerevisiae) or bacteria (e.g., Zymomonas mobilis). 17 Biochemical conversion is projected to produce 300–340 L ethanol per bone dry tonne (bdt) of feedstock, equivalent to approximately 7.2 GJ/bdt. 18 Yield is strongly influenced by feedstock type and properties.
Several competing technologies and process pathways exist for thermochemical conversion of biomass to liquid biofuels, including pyrolysis with bio-oil stabilization and upgrading and gasification of biomass with catalytic synthesis. In the latter pathway, solid biomass is partially oxidized to syngas composed of carbon monoxide and hydrogen. 19 Syngas of high purity, often achieved through filtration and scrubbing processes following gasification, can be used to produce synthetic fuels using the FT synthesis reaction. This reaction is catalyzed by Group VIII transition metal oxides—with cobalt and iron dominating previous experience—supported by large surface area bases such as zeolites. The reaction temperature (150–300°C), pressure, and catalyst used strongly affect the chain length and type of chemical synthesized; lower temperatures favor desirable longer-chain alkanes but with a lower yield and reaction rate, while high pressure promotes longer-chain alkanes with a higher yield and reaction rate. 20,21 In addition to alkanes, catalytic syngas processes can be used to produce ethanol and mixed alcohols. 22 Thermochemical conversion could deliver liquid fuels at a yield of 180–300 L/bdt of feedstock, with a liquid fuel energy output value as high as 7.2 GJ/bdt. 23,24
Relative Value
Given the limited quantities of biomass available in any given region, choices must be made about which product and conversion technology will yield the greatest economic benefit. Historical pricing on fossil fuel equivalents can be used to determine the attractiveness of various markets and assess the competitiveness of biomass relative to other fuels and energy sources. A comparison of fossil fuel pricing in the US on an energy unit (GJ) basis from 1976–2010 highlights the differences in both relative pricing and volatility of coal, natural gas, and oil (Fig. 1). 25 –27 Coal is priced free-on-board (FOB), natural gas is priced at the wellhead, and oil is a composite refiner acquisition cost (including domestic and imports).
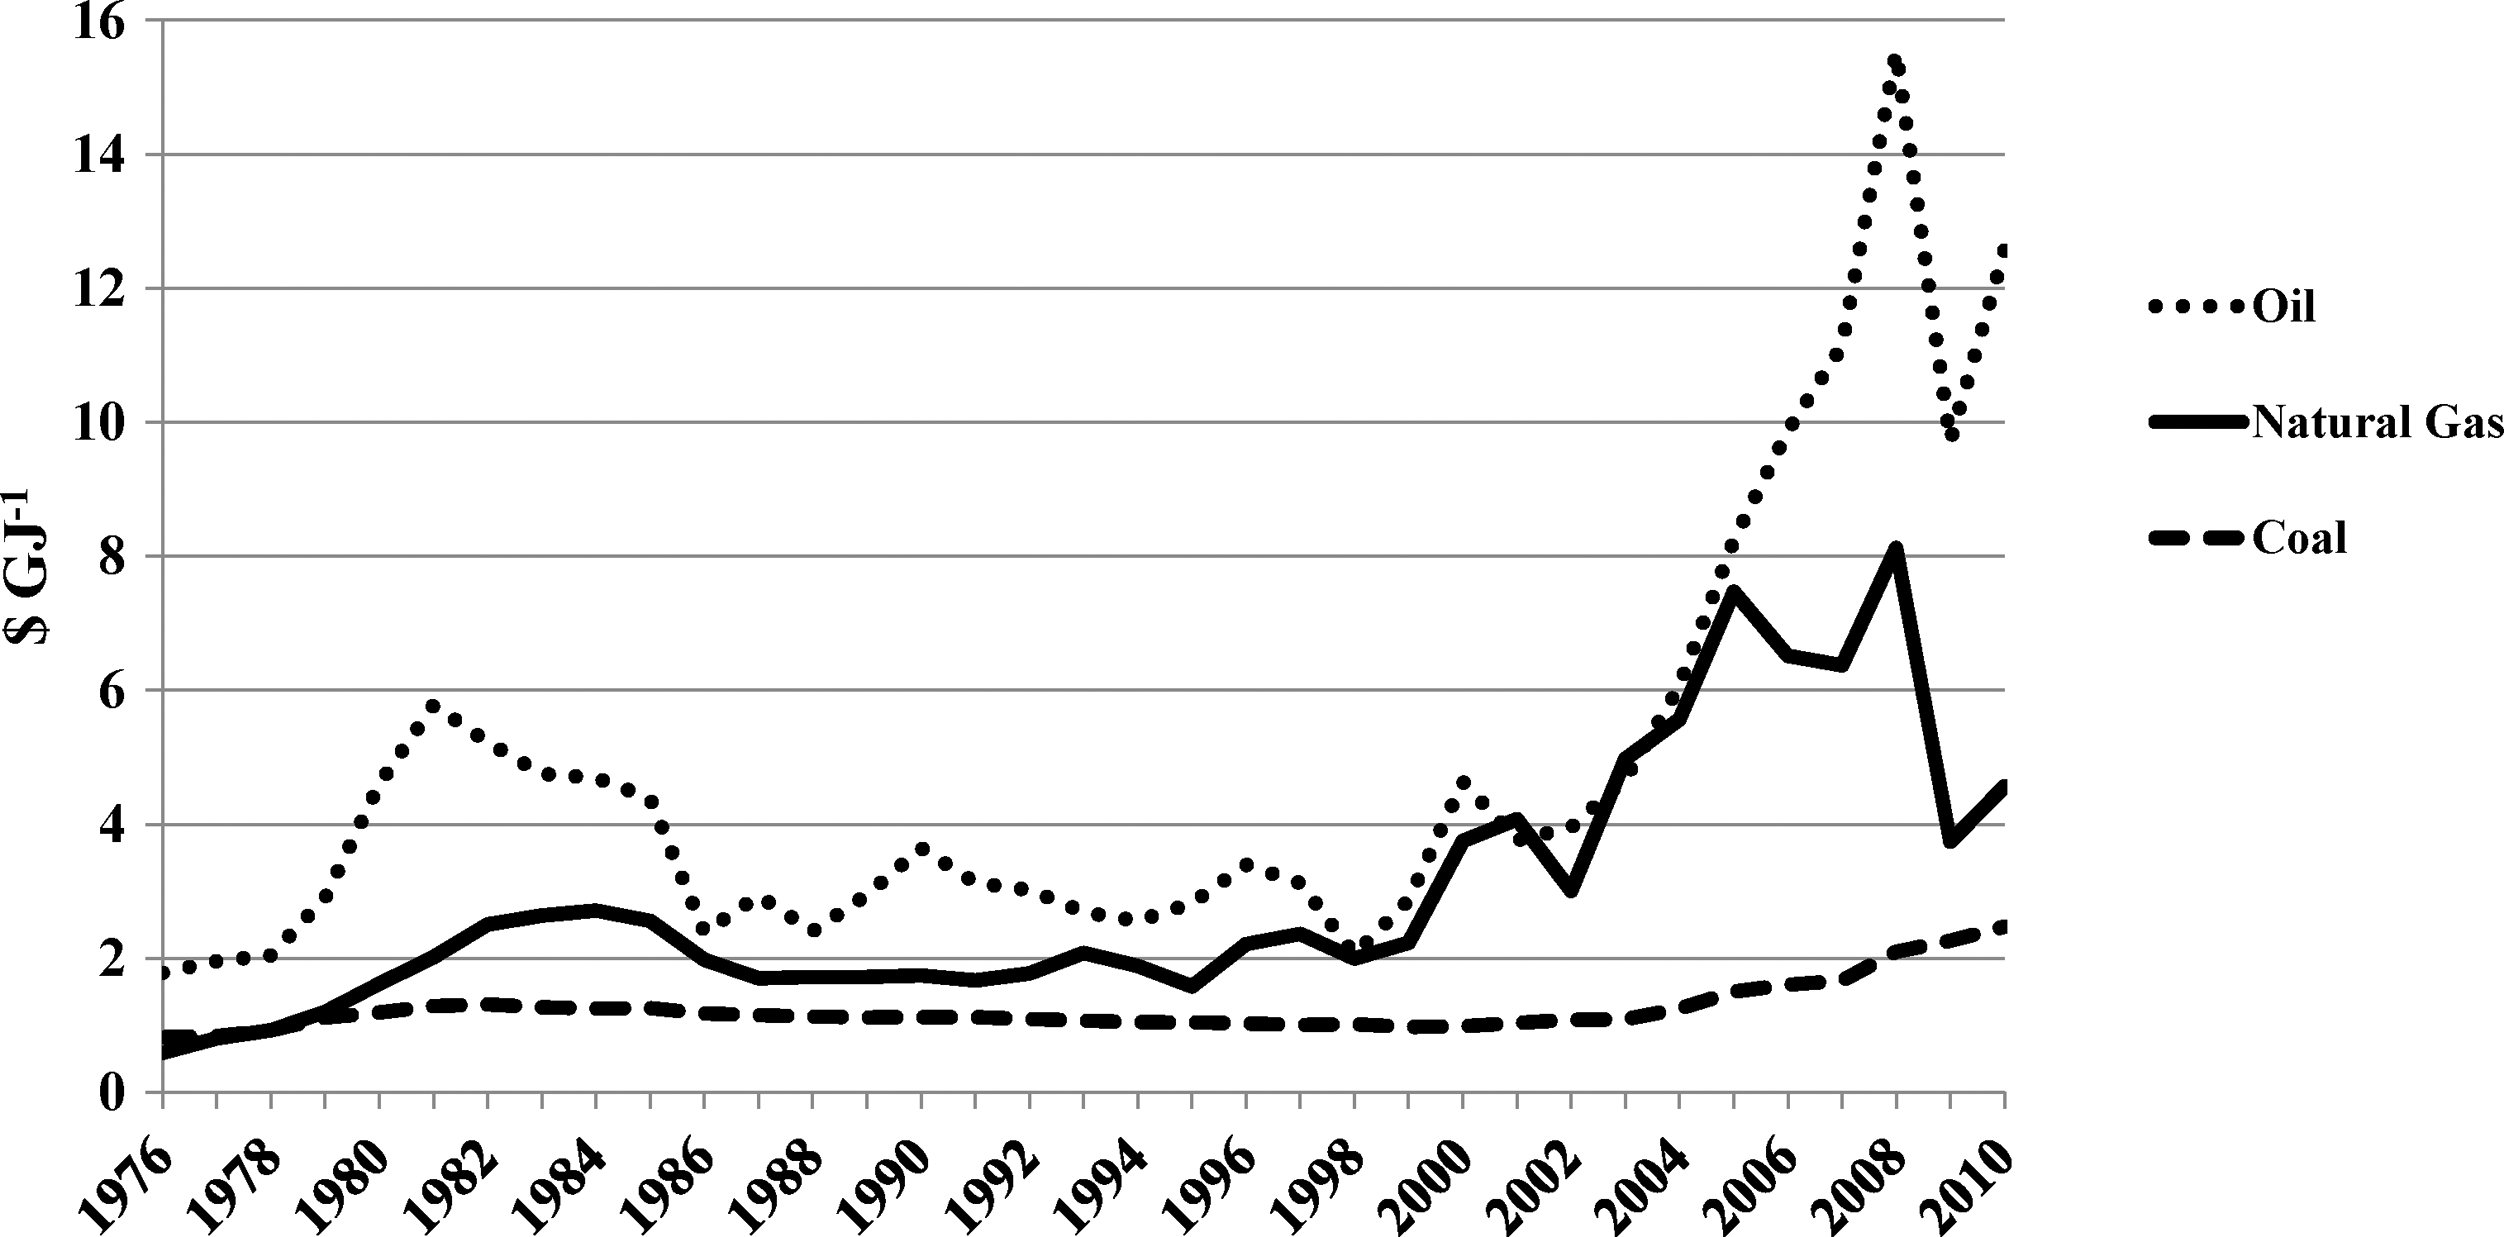
Nominal US pricing of primary fossil fuels.
Over the past 35 years, oil has commanded an average price premium of 260% over coal and a 76% price premium over natural gas on an energy content basis. This implies a premium paid for the energy content of transportation fuel compared to feedstocks principally used for stationary energy applications. The recent low natural gas prices have created an even greater divergence between oil and gas prices. 28 In terms of final products, and assuming a gasoline-to-motive power efficiency of 17.5%, a natural gas-to-heat efficiency of 85%, and a coal-to-useful electricity efficiency of 30%, transportation has been afforded a 581–1,730% price premium over electricity and a 756–2,252% price premium over heat from 1978–2010. 11,29 –32 Clearly, transportation is attractive as a target market if product price is the sole metric. However, profitability and processing margin volatility are the true tests of attractiveness. This paper provides a high-level comparison of the competitiveness of advanced lignocellulosic biofuels—ethanol and FT liquids—relative to other forest-based bioenergy products based on investment return and volatility of that return.
Materials and Methods
Facility scale, feedstock selection, and product revenue (as dictated by target market) were chosen as primary variables for investigation. A hypothetical cellulosic ethanol facility was compared with facilities that could produce FT liquids, wood pellets, electricity, or both electricity and heat (CHP). Financial models were created for all forest biomass conversion facilities using spreadsheet software. The time period for the comparison study was set at 20 years. An installed capital cost per unit output—$/L (yearly capacity) for ethanol and FT liquids, $/MW for power and CHP, and $/t (yearly capacity) for wood pellets—was estimated based on previously installed and announced projects. This enabled comparisons across technology types and ensured relevancy regardless of specific equipment selection.
Table 1 includes a list of all of the base case assumptions. 10,11,23,33 –49 Due to the large number of variables, the consistency of these assumptions with real-world projects will vary from case to case. It was the goal of this research to use assumptions that were reasonable expectations for real-world performance. An extensive review of previous academic studies, industry surveys, and industry/government reports was used to identify reasonable assumptions and model inputs. Financing for all of the projects was assumed to be 100% debt, with cost of capital assumed to be 8% for calculation of interest and taxes. The base case scenario was assumed to be 200,000 bdt/y feedstock input, which was chosen due to the availability of data on existing or planned facilities of this scale for all conversion technologies. It also enabled a middle-ground comparison between technologies that have traditionally operated at a scale less than 200,000 bdt/y (e.g., wood pellets) and those that are projected to operate at a much larger scale (e.g., FT liquids). Variables such as plant operating factor (uptime) and plant capacity factor were assumed to be the same for all technologies to permit a focus on capital costs, conversion efficiency, and relative product value. Capital cost allowance rate (depreciation) was assumed to be 4% for income tax purposes. Operating costs, excluding feedstock, were divided into labor, maintenance and repairs, stores/supplies (other than feedstock), insurance/permits, property tax, and supervision. Other than labor, these operating costs were assumed to be a percentage of installed cost. Base case product revenues were based on proxy product reference prices (e.g., diesel fuel for FT liquids). All operating expenses and revenues were increased year-over-year by 2% to account for inflation. Feedstock was assumed to be 50% moisture content chipped whole logs (roundwood) for the base case scenario. Although not the most likely feedstock for wood pellets, the use of standing timber allowed for realistic sensitivity analyses. Douglas fir (Pseudotsuga menziesii) was used as representative species. Harvest and whole-tree chipping cost was assumed to be $85/bdt, while transportation cost in a central British Columbia (BC), Canada region was determined using a trucking model discussed in Stephen et al. 50 –55 For the base case, delivered feedstock cost was determined to be $95.87/bdt. An additional onsite grinding cost of $5/bdt was assumed for FT liquids (entrained flow reactor) and pellets, and whole logs were assumed to be debarked for ethanol production. Lower heating value (LHV) was assumed to be 18.5 GJ/bdt for white wood and 21 GJ/bdt for bark. The pretreatment assumed for ethanol production was steam, and the facility was considered to be revenue neutral (self-sufficient) in electricity and heat. Heat was considered a coproduct of FT liquids. All prices were adjusted for inflation and currency exchange to 2007 US dollars.
Assumptions for Base Case 200,000 bdt/yr Biomass Processing Facility Models
Assumes feedstock is dried by combustion of additional feedstock and not natural gas. bCapital cost and scaling factors based upon facility review and literature, as indicated., and assumes 2007 US dollars. cCalculated assuming 10 filter paper units (FPU)/g cellulose, 600 FPU/g protein, and contribution to minimum ethanol selling price (MESP) of $0.132/L. 45 This is a figure approximately twice the cost of protein from amylase (starch hydrolysis), but loading is consistent with Humbird et al. 38 Should loading be 20 FPU/g cellulose, activity 600 FPU/g protein, and contribution to MESP be $0.132/L, protein would be $2.20/kg (similar to amylase). This is consistent with Stephen et al., but may be aggressive in the short term. 46
The sensitivity analysis component of the assessment focused on facility scale, feedstock type, and revenue. Scaling factors derived from the literature were used to adjust capital costs for various scales, with input ranging from 100,000 bdt/yr to 2 million bdt/yr. Feedstock costs for scaling were estimated based on the Williams Lake, BC, case study project site as described in Stephen et al. 55 However, the results could be applied to similar sites in other jurisdictions. The cost of harvest and whole-tree chipping was assumed to be the same cost as the base case for all scales. At the base case, 200,000 bdt/yr scale, several types of forest-based biomass were considered for a feedstock sensitivity assessment, including whole logs, pulp chips, sawdust/shavings, harvest residues (slash), and hog fuel (largely bark and low-grade mill residues). Feedstock costs for residues were based on previous studies and government and industry data. 56 –60 Product yield from each type of feedstock was calculated using conversion rate results from the literature and industrial standards. 2,11,23,33 –36 Finally, historical volatility (standard deviation) of fossil fuel prices from 1976 to 2007 was used to determine potential revenue volatility of the modelled facilities at the base case scale. 25 –27,61,62 The internal rate of return (IRR), the interest rate at which the net present value of cash flows is equal to zero, was used as the primary metric of comparison.
Facility Review
A review of installed and announced or planned projects for each technology enabled the calculation of capital costs and scaling factors (Table 1) for each technology type, with 200,000 bdt/y feedstock input used as the base for per unit capacity installed capital costs. The advanced lignocellulosic biofuel facility capital cost data for both technology types (biochemical and thermochemical) are based on planned and first-of-kind constructed projects, with the first commercial thermochemical facility constructed in 2010 and the first commercial cellulosic ethanol facility (utilizing agricultural residues) constructed in 2012. 63
The majority of biopower plants reviewed were found to lie in the 35–55 MWe capacity range, which is significantly smaller than most coal-fired power plants (200–450 MWe per unit, with multiple units often operating at a single plant). 10,58 Since economies-of-scale result in lower per-unit capital costs for larger facilities, this smaller scale for biopower plants could be a major impediment to economic competitiveness. While many of the newer pellet plants are in the 100,000–150,000 t/y range, the largest pellet plants approach 1 million t/y, with the largest concentration of these facilities in the southeastern US. 64 These capacities are significantly larger than many of the older pellet plants in North America and Europe, which range from 2,000–150,000 t/y. 2,64
Base Case
The assumptions for each base financial model are listed in Table 1. Biomass energy content, Bwet
, was calculated by:
in which x is the moisture content of the biomass (wet basis) and Bdry is the energy content of bone dry biomass. This was based on the combined specific and latent heat requirement to evaporate water in wet biomass of 2.6 megajoules/kg H2O. Biomass cost was determined on a bdt basis, with wet feedstock cost based on dry content percentage.
Total installed costs were calculated by:
in which C1 is the total installed cost of the study facility, C0 is the total installed cost of the base facility, M1 is the capacity of the study facility, M0 is the capacity of the base facility, and s is the scaling factor.
The base case specific revenue rates were based on average US wholesale prices for the same (e.g., electricity) or comparable (e.g., ultra-low sulphur diesel for FT liquids) products in 2007. In the case of heat, industrial prices for delivered natural gas were used as a general gauge for pricing, although heat pricing is going to be highly location-specific; $3 per million British thermal units (MMBTU) is considered a general indicator. It is important to note that electricity, heat, pellet, and FT liquid revenues do not have bioenergy-specific subsidies included in the assumed specific revenue. However, the assumed specific revenue for ethanol is the average rack price for ethanol (largely corn-based) in 2007, which included support from the US federal government in the form of a $0.51/gal ($0.135/L) blender's credit and a $0.54/ga ($0.143/L) ethanol import tariff. 65 The market price for pellets is strongly influenced by carbon taxes, which could be considered a subsidy, and renewables standards in the UK, Sweden, Denmark, and other European Union (EU) nations. 2
Results
When the base case (whole logs) financial results were compared, all facilities had incalculable IRR (substantially negative) and significant 20-year net income losses (Table 2). Therefore, assumed specific revenue was adjusted to identify a price (specific revenue) that would permit attainment of an acceptable 15% IRR. The resulting values are listed in Table 2. This artificially set specific revenue was used for additional analyses on scale, feedstock, and revenue volatility; therefore, results of these additional analyses represent relative IRR for the bioenergy options, rather than absolute or real-world performance.
Financial Results for Base Case 200,000 bdt/y Biomass Facilities
Scale
Each facility was scaled up and down, from 100,000 bdt/y to 2 million bdt/y biomass input, with the scaling factors presented in Table 1 used for capital costs. Based on costs presented in Humbird et al., a scaling factor of 0.65 was assumed for cellulosic ethanol production. 38 Kumar et al., used a scaling factor of 0.75 for power plants in Western Canada, but also conducted a sensitivity analysis of 0.6. 10 Traditional scaling factors for larger capital energy projects are in this range, so 0.7 was applied to the biopower and CHP facilities. 10 This was consistent with the biopower/CHP installed facility review. Mani et al., used the scale factor of 0.6 for estimating the wood pellet plant capital cost from a base case of 45,000 t/yr, although the 0.84 used here and by Sultana et al. for pellet mills was more consistent with the pellet plant review survey. 37,66 This higher scaling factor intuitively makes sense because pelleting machines are typically limited to a capacity of 5 t/h capacity; plants above that output require multiple pelleting machines. 2 This results in relatively poor economies-of-scale. The low scale factor of 0.5 used for the FT liquids facility is based on the engineering assessment of biomass-to-liquid plants by Boerrigter for capacities from 1,000–5,000 barrels per day (bbl/d). 36
The capital investments and IRR relative to facility capacity are described in Fig. 2, with a labor scaling factor of 0.5 used to determine the number of workers required. The size of the bubbles in Fig. 2 reflects the scale of the facility (100,000–2 million bdt/y biomass input). Scaling factor clearly has a very large impact on the capital cost and IRR of the facilities. Due to the variability of scaling factors for specific projects and uncertainty of scaling factors for non-commercial technologies, the results should only be considered a rough estimate. A lower scaling factor will favor facilities as scale increases, while facilities with a high scaling factor (e.g., wood pellets) will perform relatively poorly at larger scale.
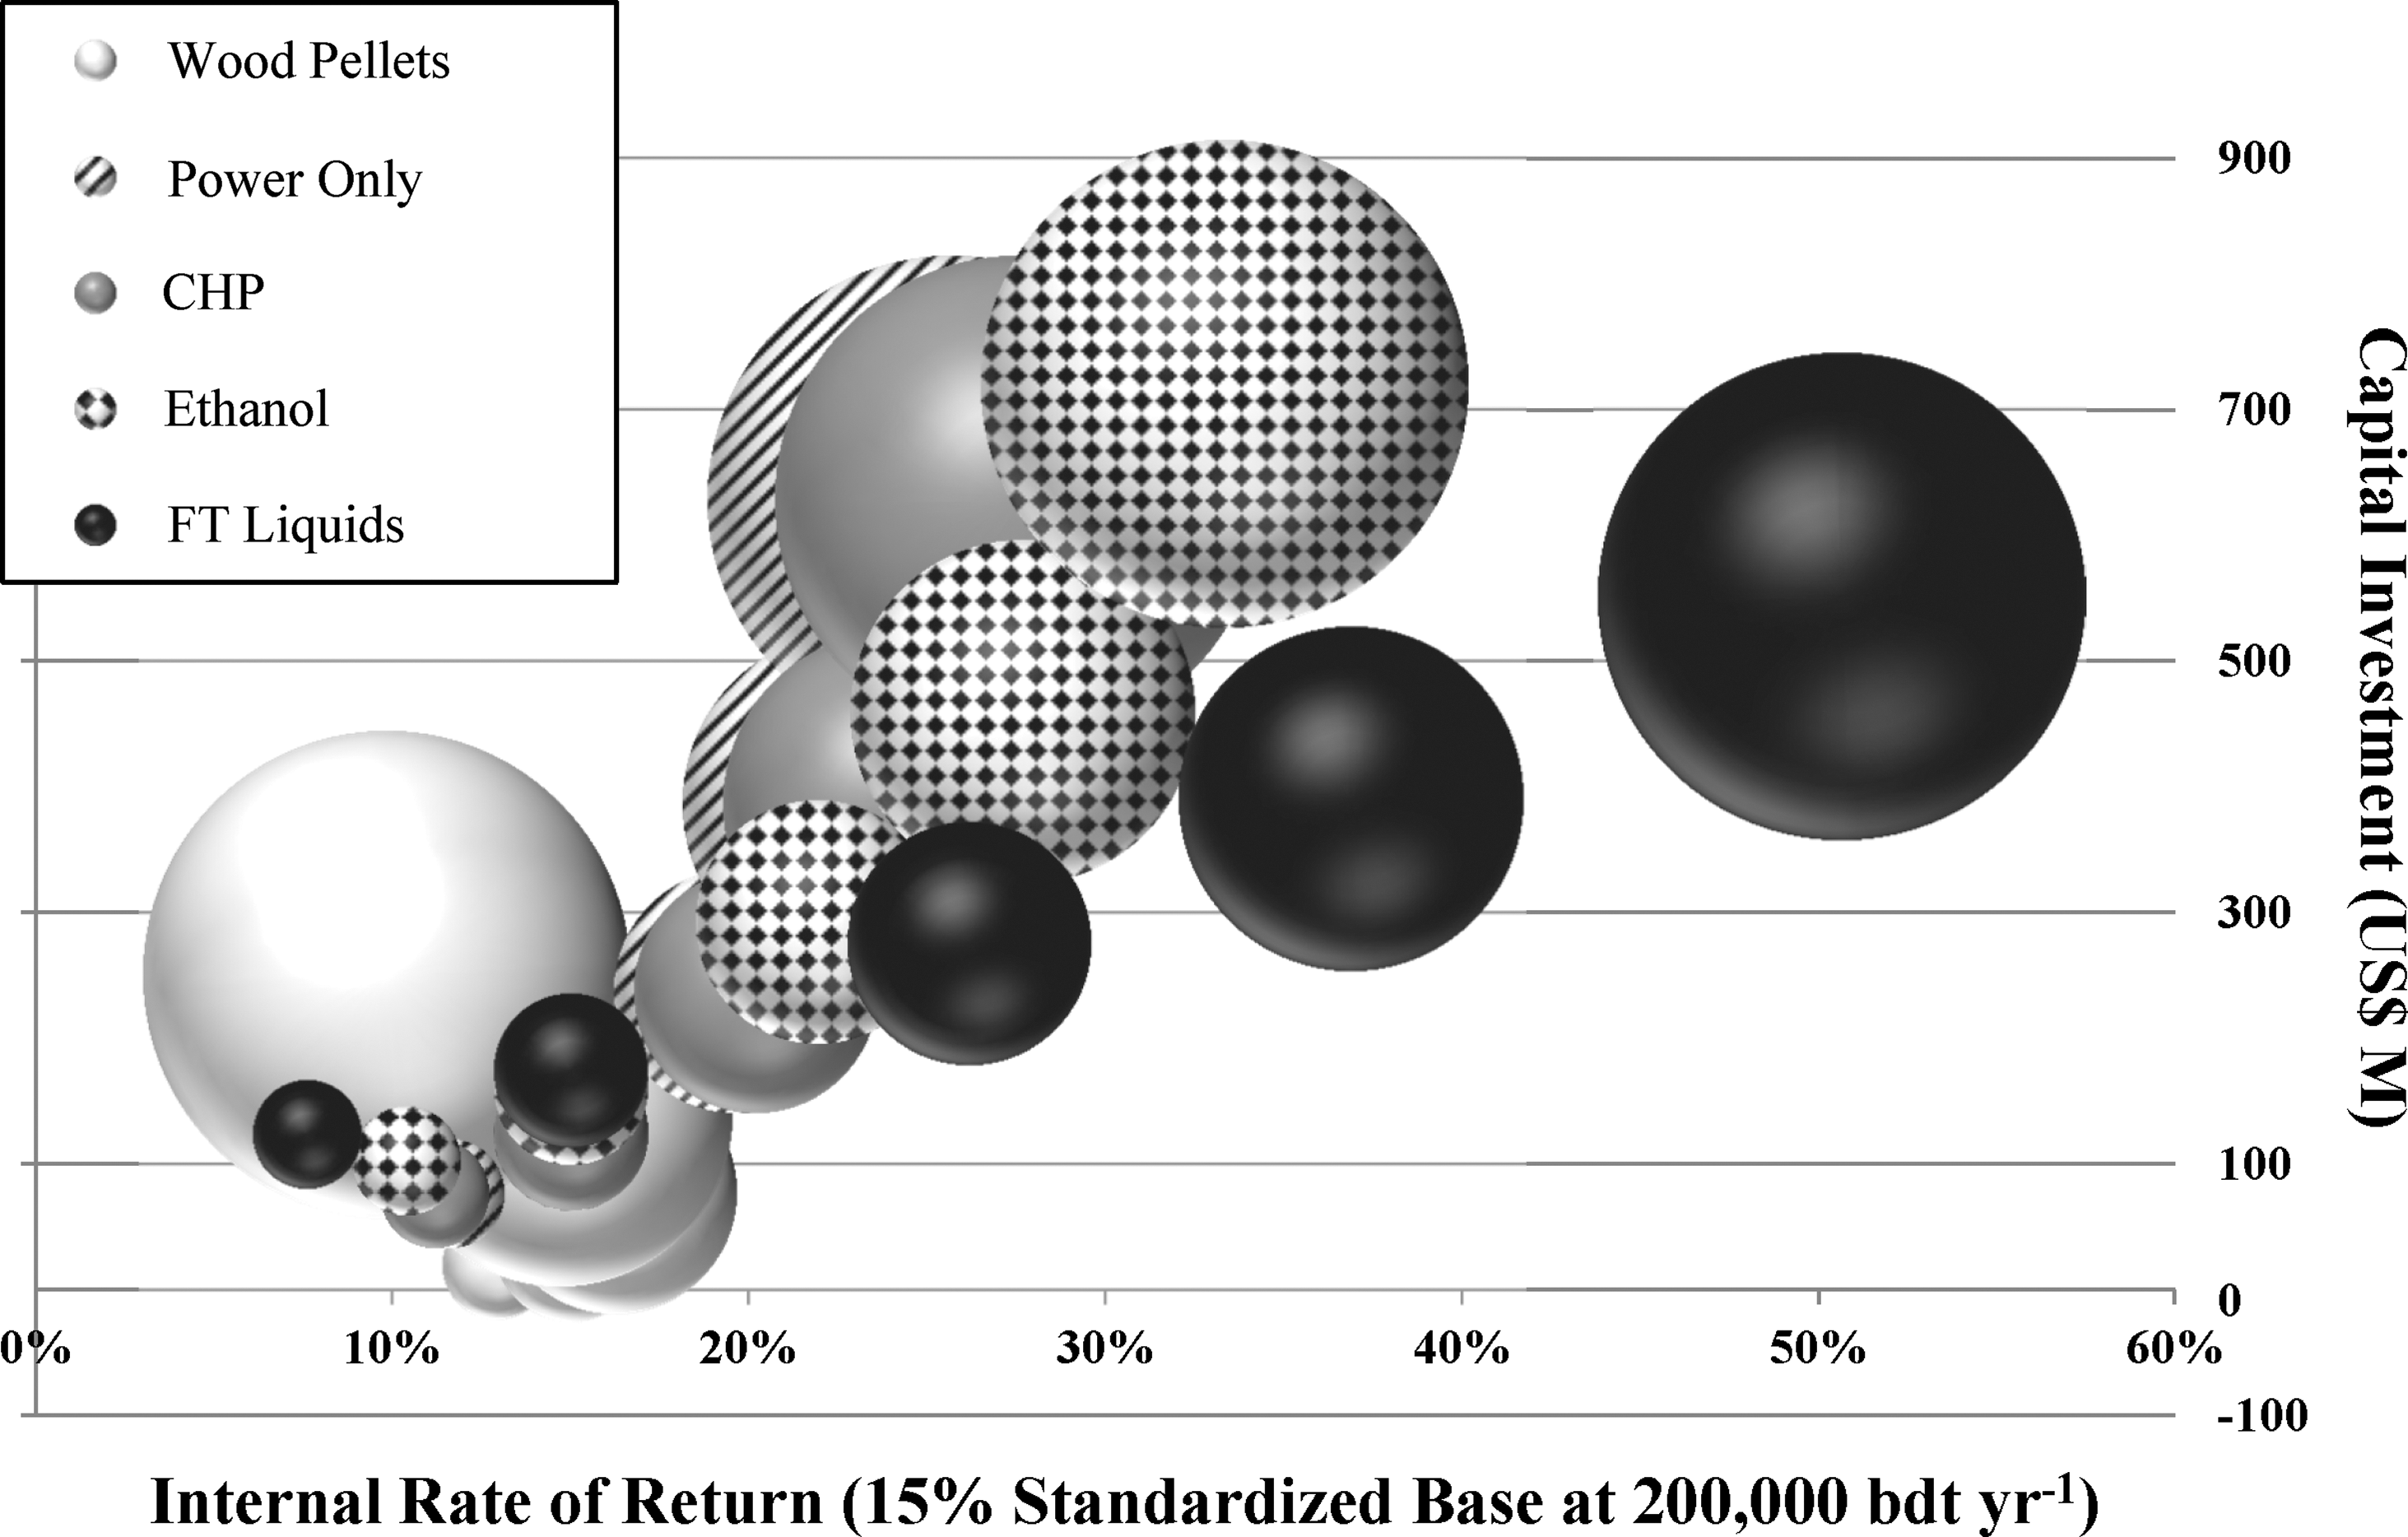
Impact of facility scale on internal rate of return (IRR) and capital investment. Bubble size represents facility scale, which ranges from 100,000 bdt/y to 2,000,000 bdt/y biomass input.
Feedstock
The second sensitivity analysis examined the impact of feedstock type on IRR, with the base case capacity of 200,000 bdt/yr used for analysis. The primary feedstocks considered for bioenergy operations were whole logs (base case), sawdust/shavings, harvest residues, pulp chips, and hog fuel (a bark-dominated mill residue). The facility capacities and conversion efficiency/yield were modified to reflect the differing characteristics of the feedstock, which are listed in Table 3.
67,68
Pellet prices were modified to reflect the relative value of bark inclusion in the pellet and differing energy content. The equation used to calculate pricing was:
Feedstock and Select Conversion Assumptions for Feedstock Sensitivity
Whole logs, harvest residues, pulp chips, and hog fuel are assumed to be chipped to less than 2 inches. Additional preprocessing to sawdust particles (as applicable for pellets and FT liquids) assumed to cost $5/bdt.
Whole logs are assumed to be debarked for ethanol production.
Includes harvest and logistics (handling, transportation).
Ethanol yield based upon Robinson, et al. 68
in which P is the market price of the study pellet, PN is the price of the base case pellet with 18.8 GJ/t energy content, and f is the energy content of the pellet in GJ/t. A 5% price adder was applied to pellets with 1% bark or less. A 10% price discount was applied to harvest residues, and a 20% price discount was applied to hog fuel to recognize the increased cost to biopower and CHP facilities for ash handling.
Ethanol yield was modified to reflect the bark and moisture content, since yield decreases with a decrease in moisture content and an increase in bark content. 34,69 Bark has significantly higher lignin content (∼50%), and hence lower polysaccharide content than white wood, which limits the amount of sugar available for fermentation. 67,68 The results of the feedstock analysis are presented in Fig. 3. It is clear that the base case whole log feedstock is the highest cost, and switching to harvest or mill residues results in an increase in IRR for all cases. Pellets had the greatest increase in IRR from feedstock switching when using sawdust/shavings for production.
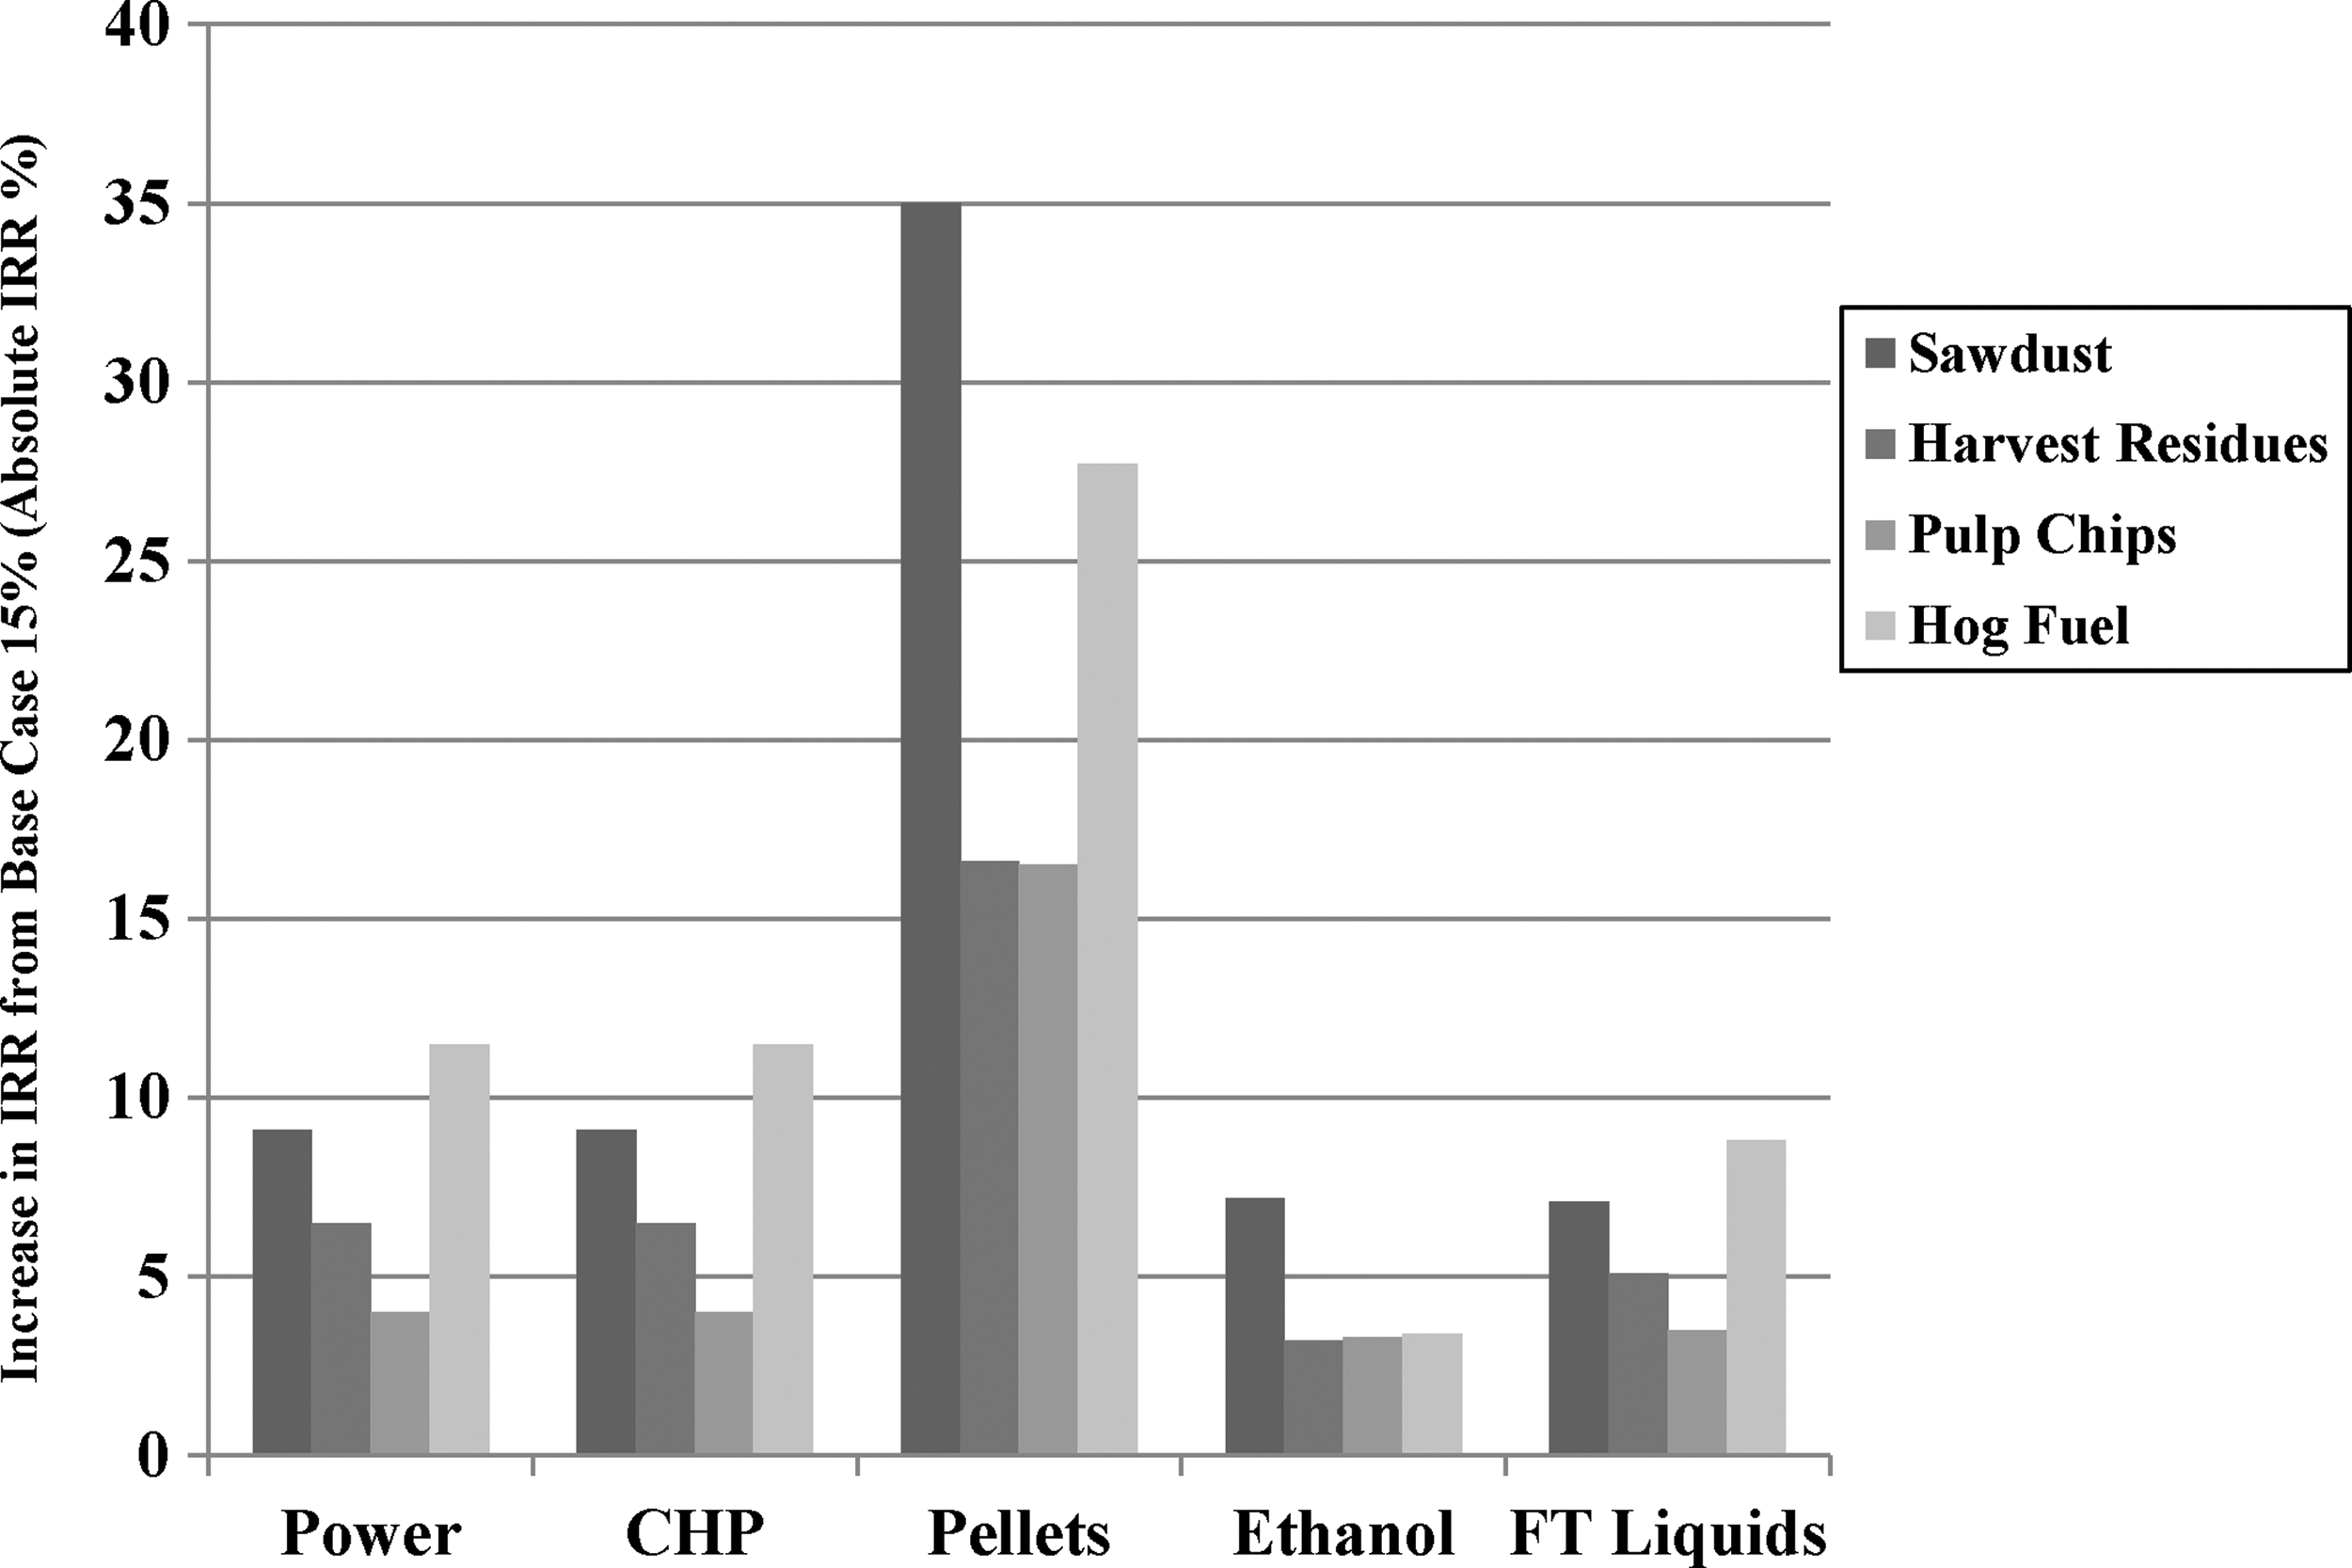
Impact of feedstock type on internal rate of return (IRR) from base case scenario.
Revenue
The third sensitivity analysis examined the impact of product price and overall revenue on IRR, with historical fossil fuel proxy prices serving as a basis for modelling range and volatility. Real prices for US FOB coal, wellhead gas, oil refiner acquisition, retail gasoline, and retail electricity were all used to compare volatility (Table 4). 25 –27,61,62 Retail gasoline prices and electricity rates were employed due to their long-term availability; as long as profit margins were consistent throughout the period (reflecting the difference in wholesale and retail prices), the volatility results should be representative of relative shifts.
Volatility of Real Prices for Select Fuels (2007 USD)
Average (residential, commercial, industrial, transportation, other) retail prices used.
The revenue for the base case scenario of roundwood feedstock and a plant capacity of 200,000 bdt/yr was modified for each conversion technology to reflect the product price volatility. Gasoline was used as a proxy for both ethanol and FT liquids volatility, while natural gas was used for wood pellets. A normal distribution was estimated, with prices within two standard deviations assumed to be representative of 95% of possible scenarios. When the impact on the IRR of the bioenergy facilities was compared, pellets were found to have the greatest range in IRR, followed by transportation fuels ethanol and FT liquids (Fig. 4). This shows that pellets, followed by ethanol and FT liquids, will be subject to the most volatile market conditions in the absence of long-term off-take agreements due to the price volatility of competing energy options. Biopower was the most stable product due to low volatility in electricity markets. Again, the more relevant values are not the absolute IRR but rather how the relative changes in IRRs compare.
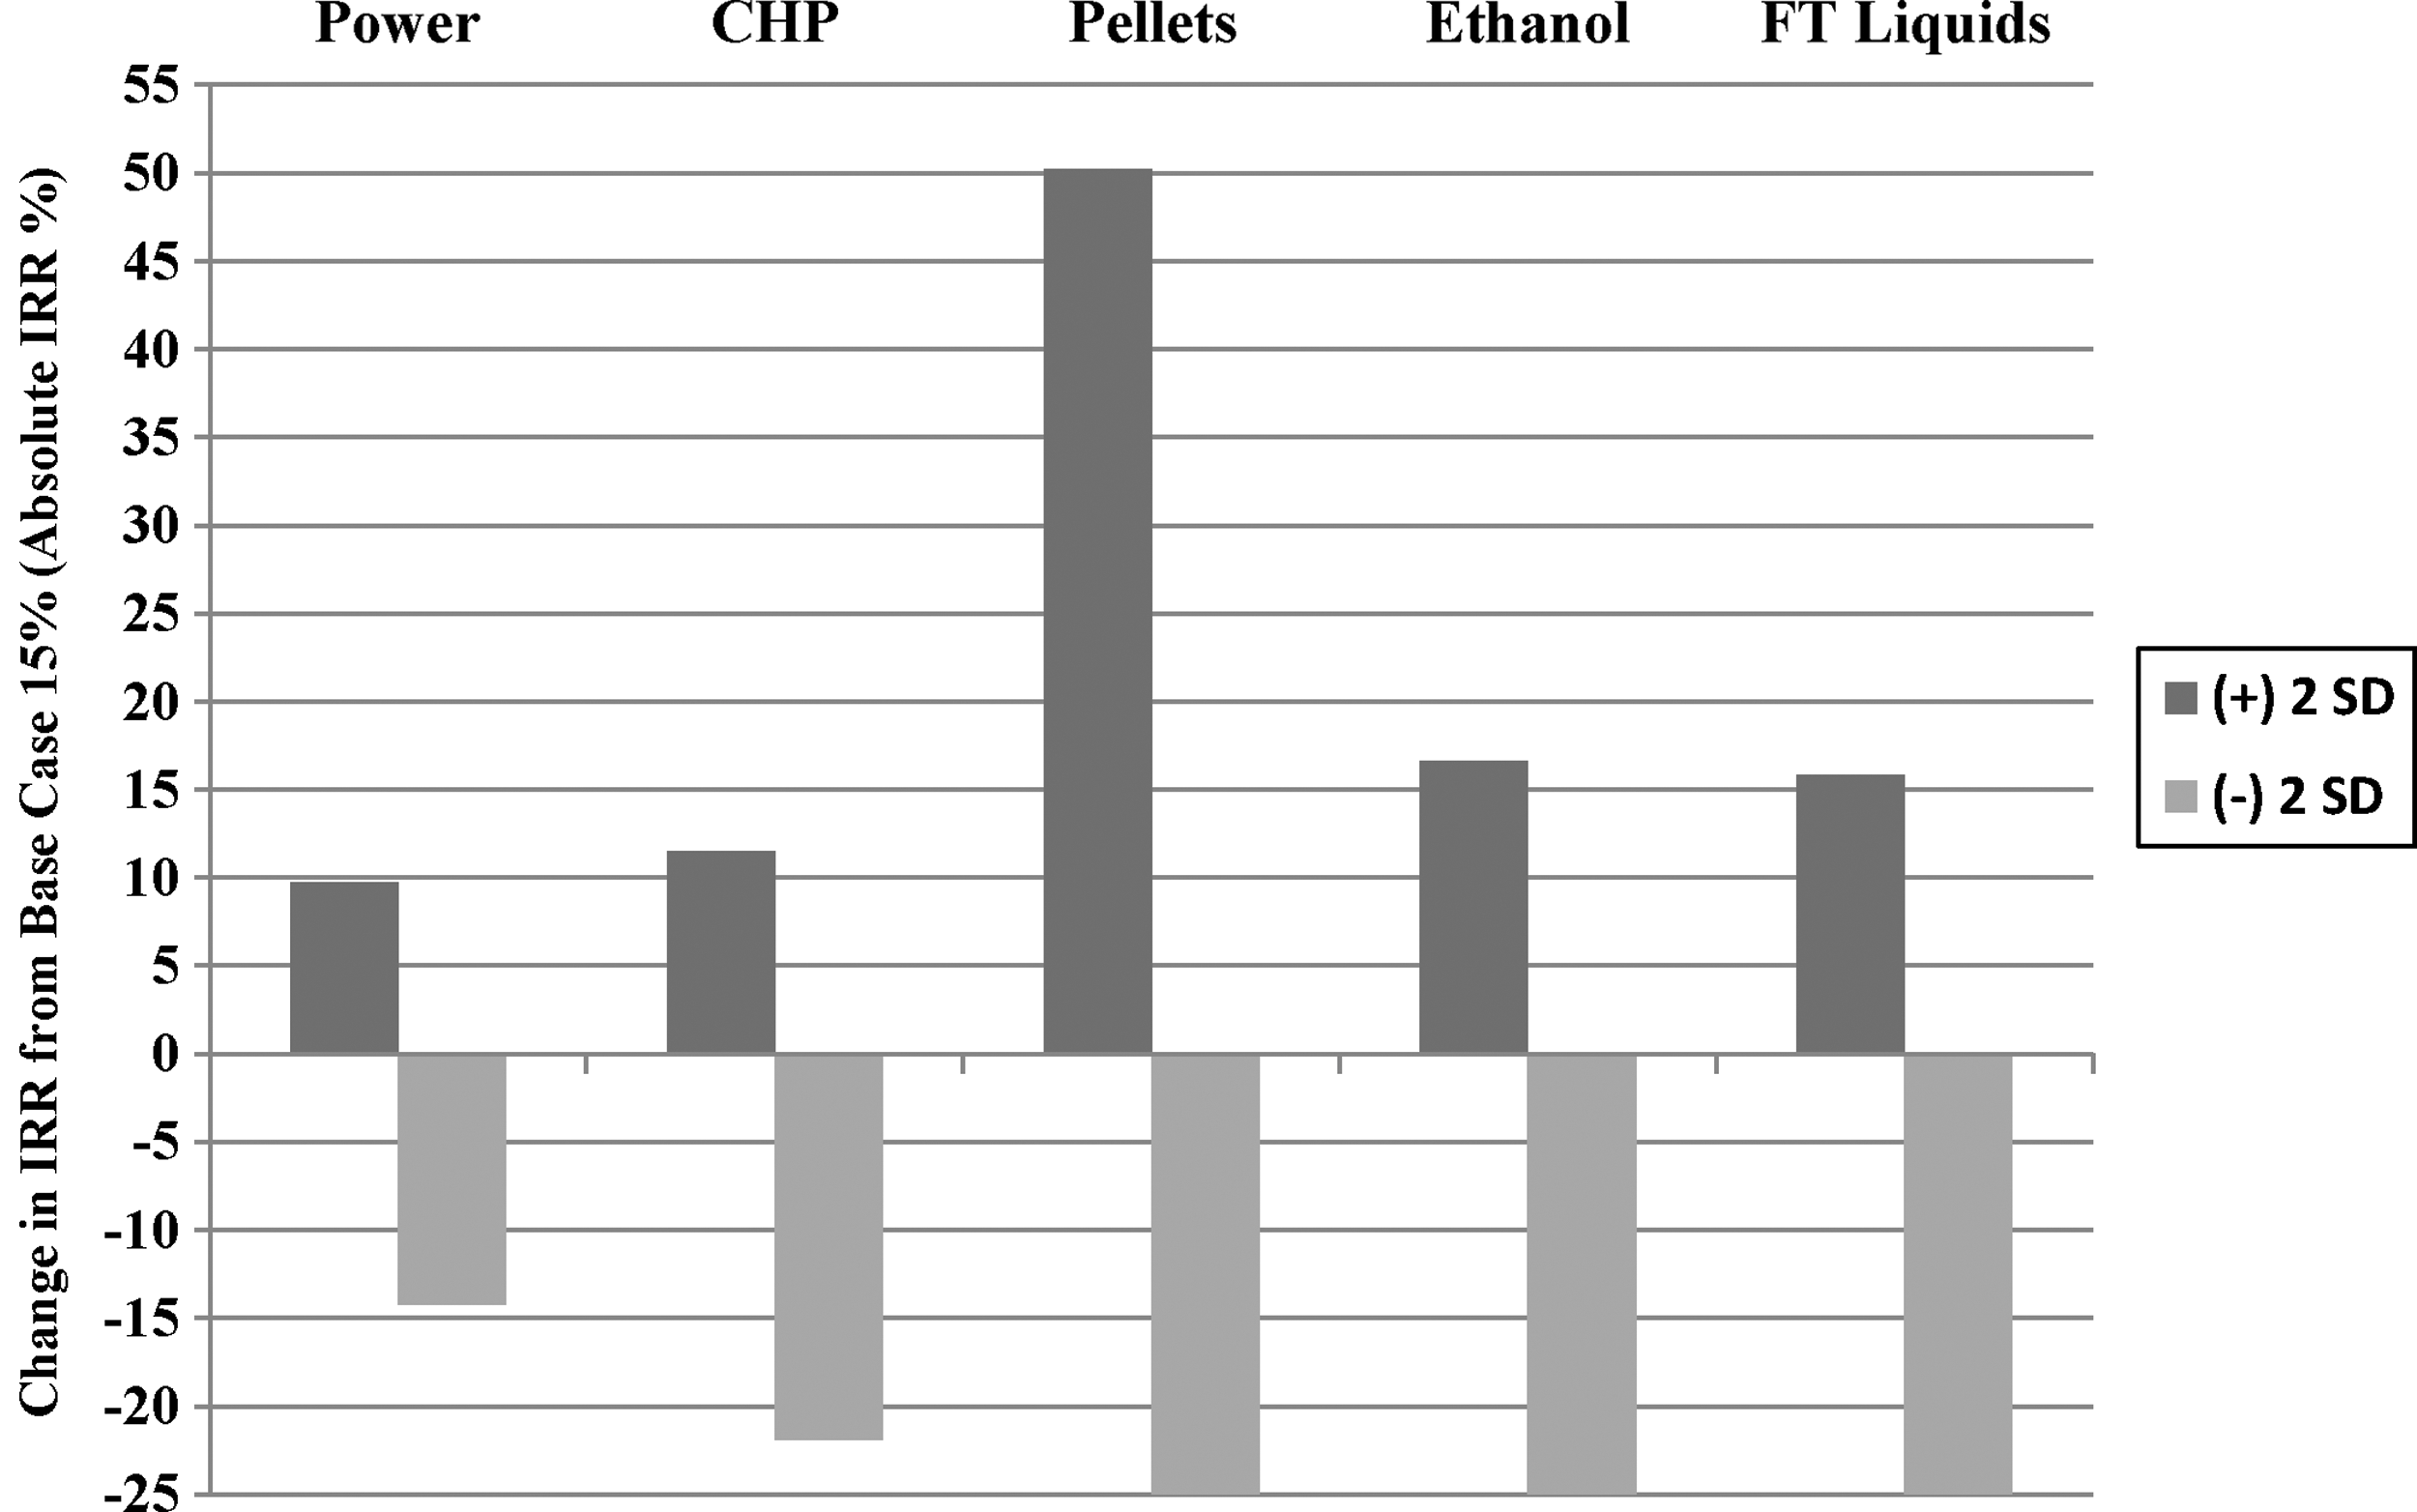
Impact of market volatility on internal rate of return (IRR) from base case scenario. −25% indicates change is incalculable.
Discussion
The economic viability of bioenergy projects is very sensitive to changes in scale, feedstock type, and specific revenue. It is apparent that cellulosic ethanol and the other bioenergy products assessed here will have a difficult time competing with conventional fossil fuels and alternatives at 2007 market prices for the base case scale of 200,000 bdt/yr when whole logs from dedicated bioenergy forest harvest are the primary feedstock. However, these results are highly dependent on assumed product revenue and, in many instances, new renewable energy projects may receive revenue at above-market prices. Cost of capital, which was assumed to be 8% for all projects, is likely to be significantly different for each technology depending on risk. Proven technologies such as CHP and pellets will have a cost of capital lower than that of unproven technologies such as FT liquids and cellulosic ethanol. Future research should explore the risk-adjusted relative cost of capital for different technologies. In addition, the choice of whole logs as the base case feedstock here resulted in higher production costs than for all other feedstocks. Although dedicated forestry harvest for bioenergy products permitted modelling of large-scale facilities and has been analyzed in the literature in the past, it is not widely practiced commercially at present. 58 The vast majority of bioenergy projects in operation at present rely on residues from the primary wood products industry (e.g., lumber, pulp).
To reach an investment-acceptable IRR of 15%, cellulosic ethanol required a doubling of specific revenue to $1.12/L, while stand-alone biopower required a tripling to $0.178/kWh. This indicates that a cellulosic ethanol plant, at the scale of 75 million L/yr, is closer to competitiveness with fossil fuels than is a 42 MWe biopower plant. This is a dramatic finding, as it shows that cellulosic ethanol significantly benefits from competing in a higher-value market (transportation fuels) rather than the lower-value electricity market, contradicting the historical commercialization success of the two options.
When considering options to reduce production costs and improve IRR for whole log feedstock, it was apparent that for bioenergy products other than pellets, increasing scale up to 2 million bdt/yr will likely improve project economics. Pellets are the exception because they are highly sensitive to feedstock costs but have relatively poor economies-of-scale. As scale increases, higher feedstock costs, driven by greater transportation distance, overwhelm the capital cost benefits of a larger pellet facility. It was clear that the economic performance of technologies with a low scaling factor (e.g., 0.5 for FT liquids) benefit significantly from increasing facility scale, which is consistent with the conclusions of previous studies. 36,70 In this case, the reduction in per unit capital cost is greater than the marginal increase in feedstock cost. The difference in scaling factors between technologies also significantly affects relative installed cost at different scales. While the installed capital cost for cellulosic ethanol was lower than FT liquids at the base scale 200,000 bdt/yr, increasing the yearly feedstock demand 10-fold resulted in a lower capital cost for FT liquids than cellulosic ethanol. Whether or not this reflects real-world need for an industrial facility remains to be seen, since this scale is far beyond those considered for commercial production.
Clearly, scaling factors have a very large impact on the expected capital cost and, hence, on the economic viability of the facilities described in this work as well. Verification of scaling factors is hampered by the absence of large-scale bioenergy plants; the world's largest pellet mill has a capacity of 900,000 t/yr, the largest dedicated (i.e., not cofiring) biopower plant has a capacity of 240–250 MWe, and there are very few commercial advanced lignocellulosic biofuel facilities. 64,71 In addition, the transportation biofuel industry lacks a standardized technology approach. Improved accuracy in scaling factors would be a worthwhile research endeavour in the future. The data also indicate that the impact of labor and other operating costs on IRR declined substantially as the scale increased, which is consistent with previous findings. 10 While a goal of bioenergy might be job creation, small-scale bioenergy facilities will be hampered by high labor and operating costs. 72
Feedstock selection was shown to impact the IRR of the five considered technologies differently. Switching to hog fuel resulted in the largest increase in IRR for biopower, CHP, and FT liquids, highlighting the low cost of hog fuel per unit of energy output for these thermal processes. In comparison, switching to sawdust/shavings resulted in the largest increase in IRR for wood pellets and ethanol. For wood pellets, this is consistent with existing industrial production, which is based largely on sawdust from sawmills and planer shavings. The large IRR gap between sawdust/shavings feedstock and other feedstocks indicates it may be difficult for Canadian pellet facilities to switch to other feedstocks—and, in particular, roundwood—and maintain profitability. Sawdust and shavings are the lowest-cost white wood (i.e., no bark) feedstock considered in this study, which means they have a high ethanol yield potential and the lowest feedstock cost contribution to ethanol production cost. Surprisingly, despite the low yield, utilization of hog fuel resulted in the second-largest increase in IRR for ethanol production, driven by the low feedstock price. Although some investigation has already been conducted on the effect of feedstock bark inclusion on ethanol yield, little work has been done on very high percentage bark feedstocks; this needs further exploration before the assumed yield of 154 L/bdt can be confirmed. 68,73 In addition, research on pretreatment and hydrolysis (for ethanol production) of dry feedstocks, such as shavings, could confirm the assumed yield in this work and determine how moisture content impacts yield. The FT liquids yield from low-grade feedstock should also be further investigated, as higher tar production and catalyst fouling could significantly impact performance.
The revenue volatility sensitivity analysis indicates that pellets, followed by ethanol and FT liquids, are the most susceptible to changes in market price. This sensitivity of pellets to revenue change is due, in part, to the high volatility of natural gas prices, the proxy competitor used for modelling pellet revenue. It should be noted that the use of natural gas to gauge heat markets also has a major pitfall in that demand for natural gas is also driven by the power and chemicals sectors, thereby reducing the correlation of natural gas and heat markets. In addition, heat revenue from a bioenergy facility will be highly dependent on local conditions due to the inability to transport heat (in the form of hot water or thermal oil) long distances. The biopower and CHP options benefited from the low volatility of electricity prices, which additionally may be guaranteed through feed-in tariff (FiT) contracts or similar mechanisms, as employed in various jurisdictions (e.g., Ontario's FiT program). 74,75 All types of bioenergy facilities could benefit from long-term agreements, with electrical utilities, heat consumers, or large oil refiners/blenders, for example, that would reduce or eliminate their exposure to market volatility. 76 Market volatility from month-to-month may also be an important consideration for business planning due to seasonal demand shifts. 77,78
The purpose of this paper was not to predict IRR for future facilities (many of which are negative at current unsubsidized market prices), but to compare bioenergy facilities for their ability to compete for feedstock and investment. In the future, the capital costs of nth liquid biofuels facilities are expected to be notably lower than the facilities modelled here. 79,80 When considering current unsubsidized North American market rates for various energy products, cellulosic ethanol is not at a disadvantage relative to other bioenergy options. However, subsidies and long-term (e.g., 20 years) guaranteed, above-market rates for other bioenergy options, including wood pellets and electricity, mean that cellulosic ethanol will have difficulty competing for feedstock (and investment) without a consistent subsidy regime for all bioenergy products relative to market prices.
Conclusions
It is clear that advanced lignocellulosic biofuels ethanol and FT liquids will be challenged to compete with fossil fuels gasoline and diesel at North American market prices. They will also face significant competition from other bioenergy products in their ability to access forest-based biomass feedstocks. Biopower and CHP facilities have the advantage of being highly flexible in terms of acceptable biomass feedstocks used, and they do not require the same degree of feedstock consistency and quality as do liquid biofuel production facilities. However, it is apparent that the investment return of both biochemical- and thermochemical-based biofuel processing facilities can accommodate changes in feedstock to a greater degree than can wood pellet production facilities. This provides, at least from a financial perspective, enhanced feedstock risk-management options and a reduced reliance on a single feedstock supply. While the accuracy of scaling factors for advanced lignocellulosic biofuel facilities is lower than that of facilities in the established biopower and wood pellet industries, FT liquid facilities clearly benefit more from an increase in scale than do biochemical/enzyme-based ethanol production facilities. This means that for smaller investments (e.g., less than $100 million), cellulosic ethanol is likely to be the preferred biofuel conversion platform, whereas for larger facilities thermochemical conversion may be preferable.
While many biopower and CHP facilities utilizing forest-sourced biomass already exist in North America and Europe, it appears that projects in North America are only profitable when they receive above-market prices for the electricity they produce. The revenue per unit output required to reach 15% IRR is closer to existing market prices for advanced cellulosic ethanol facilities than it is for biopower plants fueled by roundwood. Therefore, it appears that market structure, selective policy support, effective integration with the primary forest products industry, and technology risk are enabling biopower to outperform advanced lignocellulosic biofuels in commercial implementation. A consistent pricing regime for bioenergy products, which takes into consideration relative market prices, would allow cellulosic ethanol to compete more successfully for feedstock with other bioenergy options.
Footnotes
Acknowledgments
The authors are grateful for the financial support provided by the Natural Sciences and Engineering Research Council of Canada (NSERC; Ottawa) Bioconversion Network, BioFuelNet Canada (Montreal), and the British Columbia Innovation Council (Vancouver).
Author Disclosure Statement
No competing financial interests exist.