
Abstract
This research describes an innovative two-stage turbidostat culture system that supported sustained exponential growth at different rates and lipid accumulation in the halophilic chlorophyte Dunaliella sp. The first stage was operated as a nitrogen-replete cycloturbidostat, with a 14:10-h light:dark cycle at a growth rate of ∼1.5/day, and its effluent fed an 8-fold larger second-stage culture that then grew at ∼0.2/d. Turbidity-triggered pumps supplied medium consistently throughout the photoperiod only. Cell densities were about double in stage 2 compared to stage 1. They varied minimally throughout the day in stage 2, but in stage 1 they decreased by 50% in the first half of the photoperiod due to cell division beginning mid-photoperiod. Cell sizes increased through the first half of the photoperiod in stage 1, consistent with the phases of cell division, and indicative that the turbidity signal is more strongly influenced by cell size than density. Nitrogen-induced fluorescence transients confirmed nitrogen-limitation of stage 2, but not stage 1. Rapid light curves indicated reduced photosynthetic efficiency and capacity in stage 2. Nile Red fluorescence measured by flow cytometry was 3 times higher in stage 2 cells compared to stage 1 cells, demonstrating elevated neutral lipid content per cell. This system needs to be optimized for biomass and lipid yields, tested with other species, and scaled up for outdoor testing.
Introduction
Many recent reviews agree that microalgae are a promising source of renewable biofuels. Microalgae naturally fix carbon dioxide (CO2) from the atmosphere, grow very rapidly, have the potential to yield more oil per hectare (ha) annually than other crops, do not compete with food crops for arable land, can utilize saltwater and wastewater, and can be used to make biodiesel, the combustion of which produces lower carbon oxides, sulfur oxides, and hydrocarbon emissions than fossil-derived diesel. 1 –5
Mass production of microalgae for biofuel is a relatively new industry, and current production costs are prohibitively high. Results of techno-economic and life cycle analyses vary depending on biomass and lipid productivities, scalability, co-location variables, harvesting and processing strategies, by-product production, and economic markets. 6 –9 Reducing production costs, improving net energy balance, and ensuring culture stability in microalgal biofuel systems remains a challenge. 10 –12
Testing of enclosed photobioreactors (PBRs), open raceway ponds, and hybrid PBR-raceway systems is underway to cultivate microalgae on a large scale. PBRs support higher biomass density and volumetric productivity and lower the risk of contamination, but have high capital and maintenance costs. Less costly raceway ponds support lower biomass density and productivity; the microalgae are exposed to contamination from other algae, viruses, bacteria, grazers, and macrofauna. At present, open raceway ponds are favored because currently available PBRs are not cost-effective at commercial scale. 11
One solution to solving the challenges of microalgae mass production is to leverage the affordability of open raceway ponds and the stability and productivity of PBRs by employing a hybrid PBR-raceway system. Researchers in Hawaii grew Haematococcus pluviatilis continuously for a full year outdoors in a hybrid system. 13 A 25-m3 continuous-mode PBR operated at a low growth rate (0.25/day) served mainly to feed uncontaminated cells into a 50-m3 batch mode raceway that supported high growth rate (1.3/d). Within two days, nutrients were depleted and cells accumulated lipids prior to cessation of growth. It is unclear whether this combination of relative volumes and growth rates in the PBR and raceway would be optimal for all species and locations. Conceivably, equally stable and productive permutations that vary among species, climates, and coproducts may exist. A multistage serial, continuous culture system has been modeled and tested for algal growth, with a focus on ensuring washout of contaminants rather than optimizing physiology and yield of biomass or bioproducts. 14 –18 In this study, we employed a conceptual equivalent of the two-stage version of that system to achieve the latter goals.
Regardless of the system configuration, “the challenge is to achieve high lipid content at high productivity and solar energy conversion efficiency.” 19 Traditionally—and in the case of the two-stage system described above—this is accomplished by starving the cells of a particular nutrient, typically nitrogen, in batch mode. 13,20 Although this increases cellular triacylglyceride (TAG) content, it also greatly reduces biomass yield and requires an intermittent discrete culture and harvest regime. Selecting or genetically engineering algae with simultaneous high TAG content and rapid growth rate has proved to be an elusive goal, although manipulation of lipases and starch metabolism holds some promise. 21 –29
Pulsed additions of lower concentrations of nitrate (i.e., fed batch cultures) may result in similar terminal cell densities with higher lipid content than batch cultures receiving the same total nitrate at much higher initial concentration. 30 Moreover, lipid accumulation may occur prior to complete cessation of cell division, and it is therefore possible that cells can be maintained in exponential growth in nutrient-limited continuous culture. 13 This has recently been demonstrated in continuously illuminated single-stage turbidostat cultures of Neochloris oleoabundans. 31 While this is useful from an experimental standpoint, it is not particularly relevant to outdoor commercial cultures on a natural photoperiod, for which much of a cell's stored carbohydrates and lipids may be respired at night. 32 The system we describe here is a bench-scale, two-stage cycloturbidostat that could enable continuous growth and harvesting of lipid-enriched cells of the halophilic chlorophyte Dunaliella sp. or other species. This fully enclosed PBR-like system serves as a proof-of-concept for future optimization, scale-up to an open second-stage system, and eventual outdoor testing.
Material and Methods
Algal Strain and Culture Conditions
Dunaliella sp. 980625-1E was originally isolated from hypersaline soil at the Great Salt Plains in Oklahoma and has been maintained continuously in serial batch cultures since 1998. 33,34 Unialgal but non-axenic stock cultures are maintained at 22–27°C and 50–100 μmol photons per square meter per second (photons/m2/sec) metal halide illumination on a 14:10 h light:dark (L:D) cycle in artificial seawater with 2 mM HCO3 - and modified to contain 5% NaCl and f/2 vitamin. 35,36 Experimental continuous cultures used the same medium, with the following modifications: Tris buffer was eliminated, as it is impractical for future scale-up; HCO3 - was increased to 10 mM to support more rapid growth in lieu of CO2 enrichment of the air stream; nitrate was eliminated; and ammonium and phosphate were reduced to 200 and 40 μM, respectively. Turbidostats were grown under a 1,000-W metal halide lamp at ∼600 μmol photons/m2/ sec incident illumination on a 14:10 L:D cycle. Air (0.2 μm filtered) flowed continuously into the headspace at ∼20 mL/min, and cultures were mixed via Teflon-coated magnetic stir bars at ∼120 rpm. Nevertheless, pH rose to ∼9 in stage 1 and >9 in stage 2 by mid-photoperiod. Heating from the lamp caused the culture temperature to fluctuate daily between ∼23–28°C, similar to what outdoor cultures might experience.
Two-Stage Turbidostat
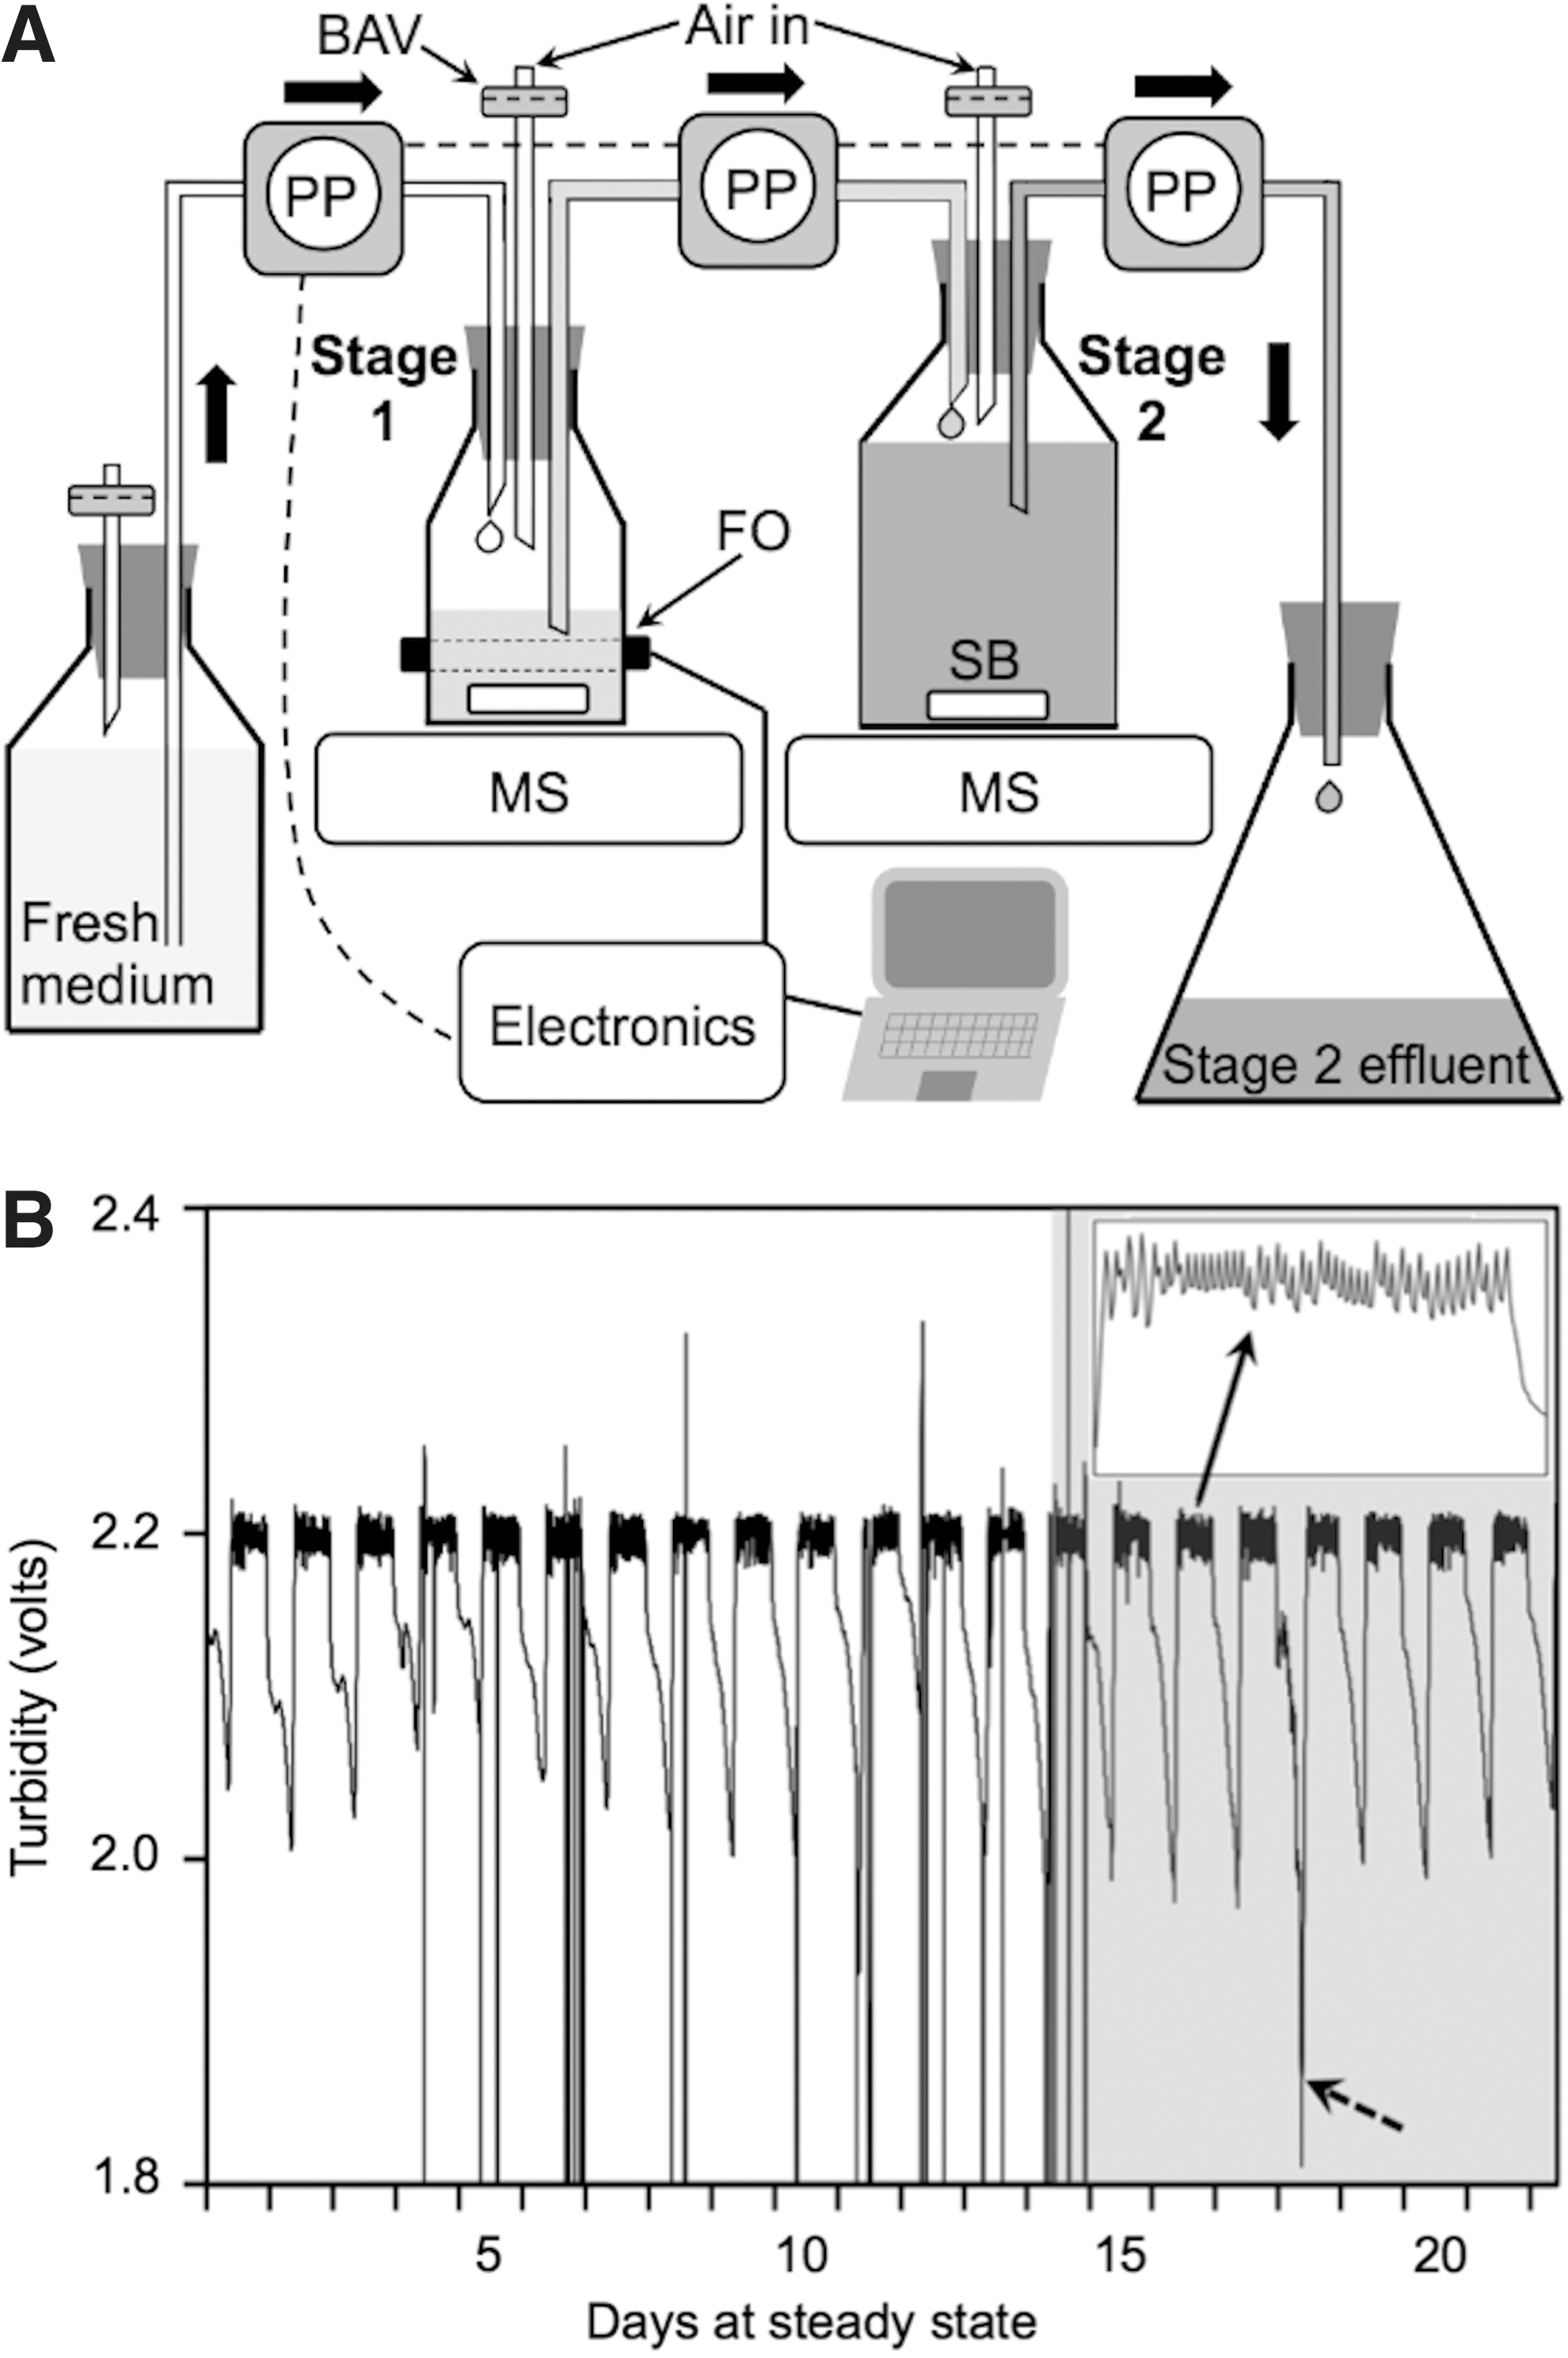
Each of two stage 1 cultures (240 mL initially in 0.5-L Pyrex bottles, with a switch to Teflon fluorinated ethylene propylene (FEP) bottles on day 14; see results for explanation) was independently controlled as a turbidostat with the dilution rate determined by the intrinsic growth rate of the algae under these conditions, as described previously. 37 When the 5-min mean 880-nm turbidity exceeded an arbitrary set point, peristaltic pumps cycled for 3 min, adding 6 mL or 2.5% of the stage 1 culture volume per cycle. Concurrently, 6 mL of stage 1 culture was pumped directly into corresponding stage 2 cultures (1,850 mL in 2-L Pyrex bottles; Fig. 1A); i.e., stage 2 had an approximately 8-fold lower turnover rate and received nutrient-depleted stage 1 effluent. Specific growth rate (μ) is the total volume delivered daily, calculated from the number of pump cycles and confirmed by measurement of the stage 2 effluent (harvest) at the start of each photoperiod, divided by the 240-mL (stage 1) or 1,850-mL (stage 2) culture volume. The duplicate two-stage cultures were maintained for 21 days following two days in batch mode prior to reaching the set point for pump cycling.
Cell Enumeration and Sizing
On day 6, each culture was sampled seven times from just before to just after the photoperiod to determine cell densities and sizes with a Millipore Scepter (Billerica, MA) handheld particle counter and a hemocytometer. Culture samples (1.35 mL) were added to microcentrifuge tubes containing 0.15 mL 40% formaldehyde and mixed gently. Both Scepter and hemocytometer cell densities were corrected for the 10% dilution (1.35 mL culture sample plus 0.15 mL formaldehyde). This was loaded onto both sides (∼50 μL each) of a hemocytometer, which was counted entirely (1 mm2 and 33–182 cells each), and the sides averaged. On average, counts of the two sides differed by 12.8% of the mean, with the worst four samples differing by 22%, 30%, 42% and 48%. The remaining 1.4 mL was centrifuged (5 minutes at 5000×g) to collect the cells, after which the liquid was decanted and the pellet resuspended using a disposable pipette and vortexing in 1.4 mL phosphate buffered saline (PBS;137 mM NaCl, 2.7 mM KCl, 10 mM Na2HPO4, and 1.8 mM KH2 PO4) for pH and ionic strength compatibility with the Scepter. The Scepter sensor was immersed directly into the tube and cell density and size distribution were measured within approximately 20 seconds. In addition to allowing hemocytometer counting of the otherwise highly motile cells, formaldehyde minimized osmotic changes in cell size and prevented cell rupture on resuspension in PBS, which has a significantly lower osmolarity. Microscopic observation revealed no obvious change in cell morphology, and the trace residual formaldehyde after resuspension in PBS did not appear to interfere with Scepter measurements.
Relative Neutral Lipid Estimation by Nile Red Flow Cyotometry
On day 12, ∼7 mL samples of each culture were transported within 30 min to a FACSCalibur flow cytometer (BD Biosciences, San Jose, CA). Each sample was processed at the low flow setting (12 μL/sec), first unstained and again after spiking with the lipophilic fluorescent dye Nile Red (NR, Sigma-Aldrich, St. Louis, MO) in acetone to a final concentration of 1 μg/mL. 38 NR-spiked samples were vortexed for 10 sec and incubated in darkness for 5–20 min before measuring with the flow cytometer. 39,40 The 488-nm argon laser provided excitation of yellow NR fluorescence in the presence of neutral lipids, which was detected in the FL2 channel (560–640 nm). 40 A total of 10,000 events were detected, but to exclude bacteria we only analyzed the 56–97% of events (cells) falling within a subjective forward versus side-scatter gate established using unstained cells. All flow cytometer settings were constant for all samples.
Physiological Characterization of Cells
Nitrogen-induced fluorescence transients (NIFT) and rapid light curves (RLC) were determined between photoperiod hours 3.5–8.5 on day 15 using a Fiberoptic Phyto-PAM fluorometer (Phyto-C and Phyto-EDF, Heinz Walz GmbH, Effeltrich, Germany). 41,42 Samples (∼5 mL) were transferred directly from turbidostat cultures to a 4-mL glass flow-through cuvette enclosed in a custom black plastic chamber with a central port holding the Phyto-EDF fiber optic cable against the side of the cuvette. The nominal actinic light provided by the Phyto-PAM was 150 μmol photons/m2/sec throughout the NIFT assays. Saturating pulses were automatically applied every 30 sec, beginning within ∼1 min of sampling from the culture. After ten flashes (5 min), we injected 0.2 mL of either 5% w/v NaCl (isotonic control) or 4 mM NH4Cl (200 μM final concentration) in 5% NaCl and followed the response for another 20 flashes (10 min), followed by six flashes in nominal darkness (except for the ∼4 μmol photons/m2/sec of the pulsed 8-Hz measuring beam). Separate culture samples were used for the NaCl and NH4Cl treatments. The NIFT response is evaluated by comparing the time courses of steady-state fluorescence (F) and/or photosynthetic yield ([Fm′ - F]/Fm′; in which Fm′=maximum fluorescence in the light) in the nitrogen (N)-spiked and control samples. We used the channel 4 (665 nm excitation) fluorescence, which was the highest signal of the four excitation channels.
Immediately following the dark period, we initiated a pattern of rapid light curves (RLC) on the same sample as follows: 30 sec each at nominal actinic light (PAR) of 4, 16, 32, 64, 90, 120, 150, 180, and 240 μmol photons/m2/sec, and 20 sec each at 320, 460, and 610 μmol photons/m2/sec, with a saturating flash at the end of each level. The software automatically calculated steady-state F, Fm′, yield, and relative electron transport rate (rETR=yield x PAR x 0.5×0.84) for each irradiance, and fitted a nonlinear equation to estimate the light-limited initial slope (α) and light-saturated rETRmax. We depicted the RLC by plotting rETR vs. irradiance. Yield at the lowest PAR approximates maximum fluorescence yield in darkness (Fv/Fm; Fv=variable fluorescence), when all active photosystem II reaction centers are open.
Lipid Characterization and Fatty Acid Profile
Lipids were analyzed on stage 2 effluent biomass pooled from both replicates over days 14–21. The effluent-receiving flasks (Fig. 1A) were kept on ice during that period. The contents were concentrated by centrifugation each day at the beginning of the photoperiod and then added to the previous days' harvest (stored at −20°C). At the end of the experiment, the pooled biomass was lyophilized and weighed. Lipids were extracted from a 125-mg subsample, dried under N2, and extracted a second time to remove excess salt. 43 Total lipid extract was separated into neutral lipid, glycolipid, and phospholipid classes on silica mini columns. 44 Class separations were verified by thin layer chromatography (TLC). Each fraction was spotted on a high performance TLC-gypsum inorganic hard layer with fluorescence (GHLF) normal phase–10×10 cm, 150-μm plate (Analtech, Newark, DE) developed with an 80:20:1 hexane:ether:acetic acid solvent mixture. Lipids were viewed by dipping the plate in a 3% cupric acid/15% phosphoric acid solution and charring. A fatty acid methyl ester (FAME) derivative of each lipid class was produced by saponification with methanolic potassium hydroxide (KOH) followed by transmethylation with methanolic boron trifluoride (BF3). Purified FAMEs were analyzed by gas chromatography, as described previously with only minor modifications. 45 Identification of FAME peaks was achieved by comparing retention times with authentic FAMEs (Nu-Check Prep, Elysian, MN). Fatty acid composition was calculated as a percentage of the total fatty acid present.
Ammonium Assay
The ammoniacal nitrogen (NH3-N) concentration was estimated in each stage 2 culture on days 5 and 7 using the Hach salicylate method #8155 with the Hach DR/890 colorimeter (Hach Company, Loveland, CO). To avoid exceeding the upper limit of the assay and to minimize salinity interference from the 5% NaCl culture medium, culture samples were filtered through glass microfiber (GF/F) filters (Whatman, Pittsburgh, PA). Subsequently, 2 mL samples were diluted to 10 mL with 18.2 MΩ-cm Milli-Q water (Millipore) prior to carrying out the assay. Reported concentrations were corrected for this dilution.
Results and Discussion
Growth Rate, Cell Density, and Cell Size
Stage 1 cultures of Dunaliella sp. exhibited stable diel patterns of turbidity and pump cycling over the 21-day steady state period (Fig. 1B). The turbidity fell rapidly within minutes of the lights going off and rose rapidly when the lights came on, as was previously observed in the trebouxiophyte Picochlorum oklahomensis. 37 The pumps began cycling when the signal reached the arbitrary set point of 2.2 volts, about 1–2 hours into the photoperiod. The average daily specific growth rates (21 days) of the replicate stage-1 turbidostats (240 mL volume) were 1.46/d and 1.64/d, thus the respective stage-2 cultures (1,850 mL volume) grew at about 0.19/d and 0.21/d. For the first 13 days, the stage 1 cultures were maintained in glass bottles, but the cells tended to stick to the walls, thus violating the continuous culture requirements of a uniform suspension of cells and cell flushing equal to the dilution rate. To lessen this tendency, we briefly maximized the daily stirring rate (typically ∼1 min early in the photoperiod) to dislodge cells, and transferred stage 1 cultures to freshly autoclaved glass bottles on days 5, 8, and 12. On day 14 we transferred the cultures to Teflon FEP plastic bottles, with no discernable impact on the growth rate. The FEP resin bottles supported more consistent growth rates from day-to-day and between replicate cultures because the cells did not adhere to the bottles. This problem must be considered in scale-up cultivation for any algae that adhere to surfaces, as FEP is very expensive.
To relate turbidity to culture properties, on day 6 we enumerated cell densities and mean equivalent spherical diameter with an EMD Millipore Scepter (Fig. 2), and cell densities and frequency of dividing cells (doublets) by microscope counts in a hemocytometer (Fig. 3). Representative size frequency distributions are shown for two distinct samples (Fig. 2, inset). To our knowledge, this is the first published application of the Scepter to algae. We obtained a strong exponential correlation between Scepter (S) and hemocytometer (H) counts (H=0.2024e–1.844S, R 2 =0.94; Fig. 3, inset), and the Scepter slightly underestimated true theoretical counts at the high end, as described in the instrument literature based on yeast cells. Hemocytometer counts tended to be noisier, probably due to the >200-fold lower counts than the Scepter. However, both methods revealed the same temporal patterns.
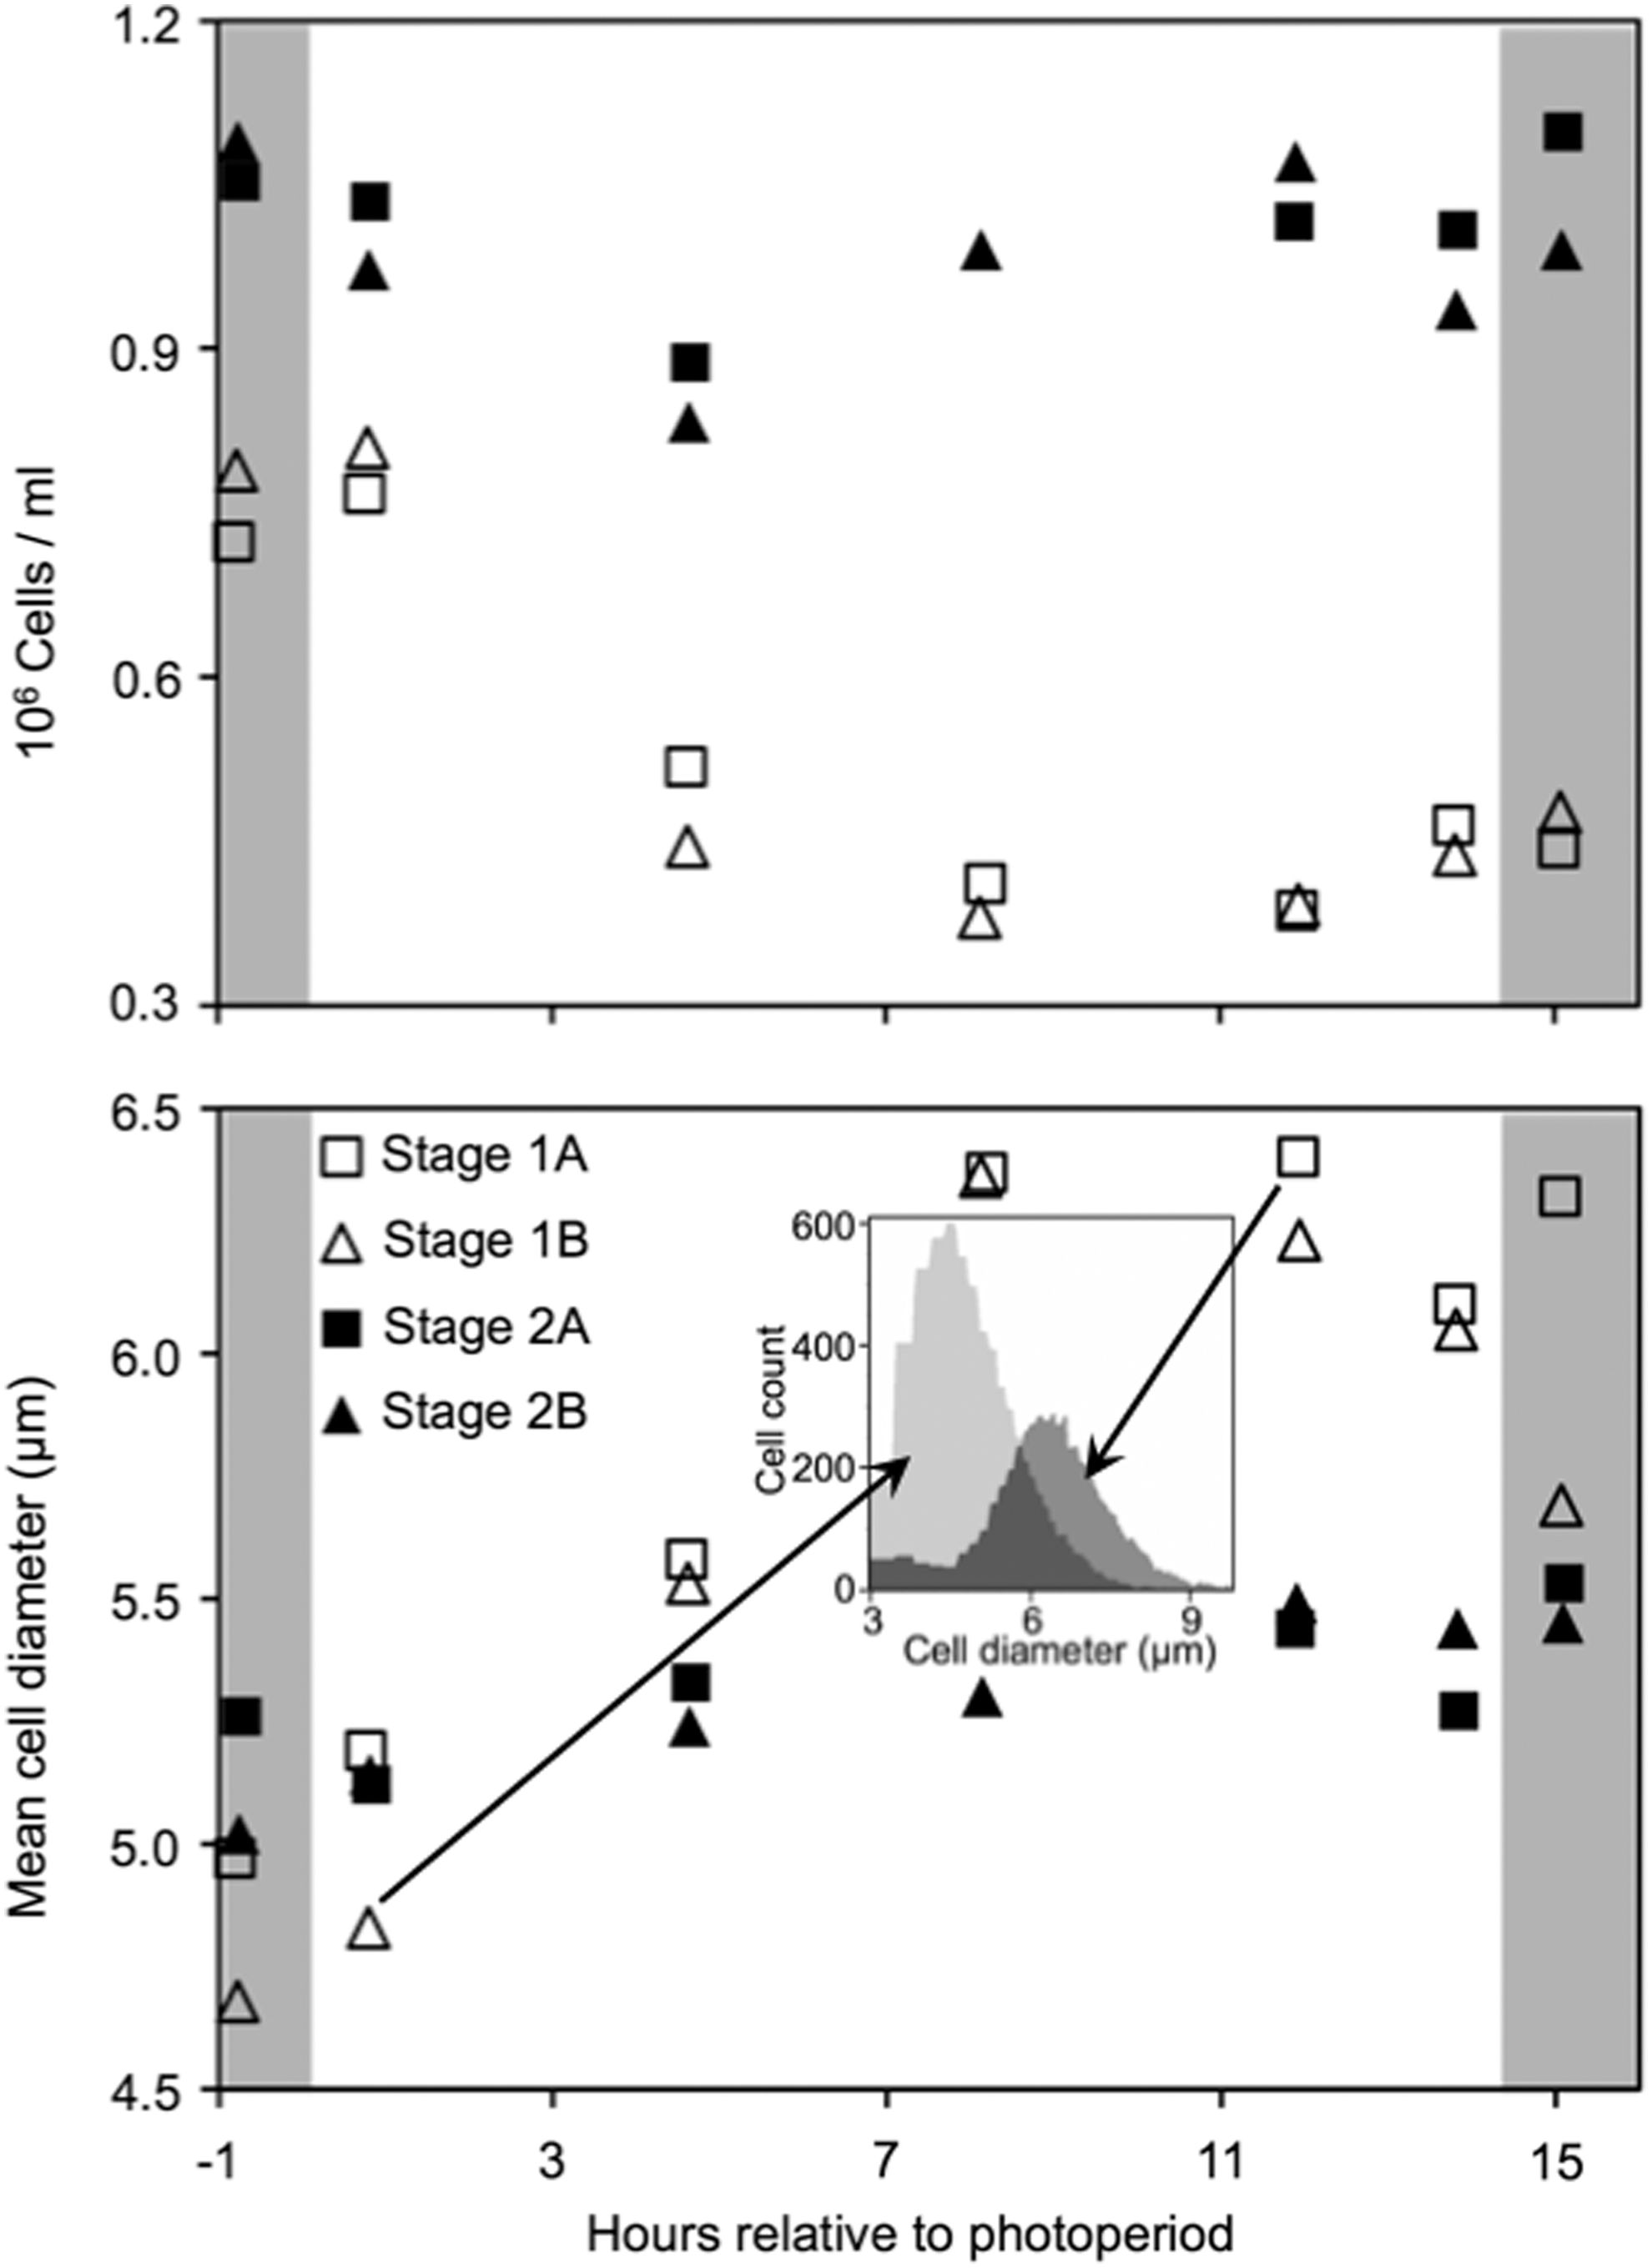
Cell densities and mean equivalent spherical diameters in replicate stage 1 and stage 2 turbidostat cultures of Dunaliella sp. based on Scepter data. Each point represents a single sample and Scepter mean based on 1.9–4.5×10⁴ cells. Inset shows frequency distributions of equivalent spherical diameter for two representative stage 1 samples (arrows).

Cell densities and frequency of dividing cells in replicate stage 1 and stage 2 turbidostat cultures of Dunaliella sp. based on hemocytometer counts of 84–339 cells in 2 mm2. Inset shows regression of cell densities (x 106/mL) determined by hemocytometer vs. Scepter counts.
Cell densities were always higher in stage 2 than in stage 1 cultures. Stage 1 culture cell densities declined by about half, and mean cell size increased during the first half of the photoperiod; then size and density more or less stabilized through the beginning of the dark period (Fig. 2, open symbols). These patterns are consistent with the frequency of dividing cells, which increased in the second half of the photoperiod (Fig. 3, open symbols). Thus, cell divisions kept pace with dilution after, but not before midday. The turbidity signal increased steadily between pump cycles throughout the photoperiod (Fig. 1B). Therefore, turbidity reflects cell size as much or more than cell density. This also may explain the nocturnal decline in turbidity, as cell size must decrease to repeat the cycle. More detailed knowledge of diel cell division patterns and mean duration of the visible doublet stage for individual dividing cells would be needed to allow for more precise matching of these patterns to the dilution rate, but they must balance over 24 hours.
Our observations are, however, consistent with both phased cell division and cell size, with both peaking early in the dark period in cyclochemostat cultures of Isochrysis under a simulated diel irradiance regime. 32 At a dilution rate of 1/d, 70–90% of the algae divided at night. It is possible that Dunaliella follows the same pattern. However, at a growth rate of ∼1.5/d, it is probably necessary that some cells divide during the photoperiod (Fig. 3).
Consistent with a low dilution rate, stage 2 cultures exhibited much smaller fluctuations in cell densities and sizes. Dividing cells were rarely observed (Figs. 2 and 3, filled symbols). The small changes appear to reflect the much larger changes in size and density of stage 1 cultures that flow into stage 2 cultures.
Physiological Confirmation of Nitrogen Limitation
Residual ammonium concentrations in the duplicate stage 2 cultures were 43 and 39 μM on day 5, and 18 and 29 μM on day 7. These values are high compared to typical natural water bodies, but suggest that stage 2 cultures experienced ∼10–20% as much ammonium supply as the medium influent to stage 1 within a few days of steady state growth, and that stage 1 did not consume all of the ammonium. We believe that a functional measure of N-limitation is more useful.
NIFTs are useful rapid indicators of limitation by a particular nutrient, in this case nitrogen. 41,42 On day 15, cells from stage 1 cultures exhibited no obvious differences in the responses of steady-state fluorescence or light-adapted fluorescence yield (Fv′/Fm′) to additions of 5% NaCl as a control or 200 μM NH4Cl (Fig. 4A, 4C), consistent with N-replete conditions. In contrast, cells from stage 2 cultures exhibited more pronounced transients in steady-state fluorescence following addition of NH4Cl compared to NaCl (Fig. 4B). Stage 2 cells showed a small transient dip followed by a gradual rise in Fv′/Fm′ and a higher final maximum fluorescence yield in darkness (Fv/Fm) compared to the initial level (Fig. 4D), but stage 1 cells showed negligible change in Fv′/Fm′ or Fv/Fm (Fig. 4C). The exact shape and magnitude of the responses are not of particular interest here, except to confirm that the N-spikes induced a response distinct from controls in stage 2 but not in stage 1 cultures.
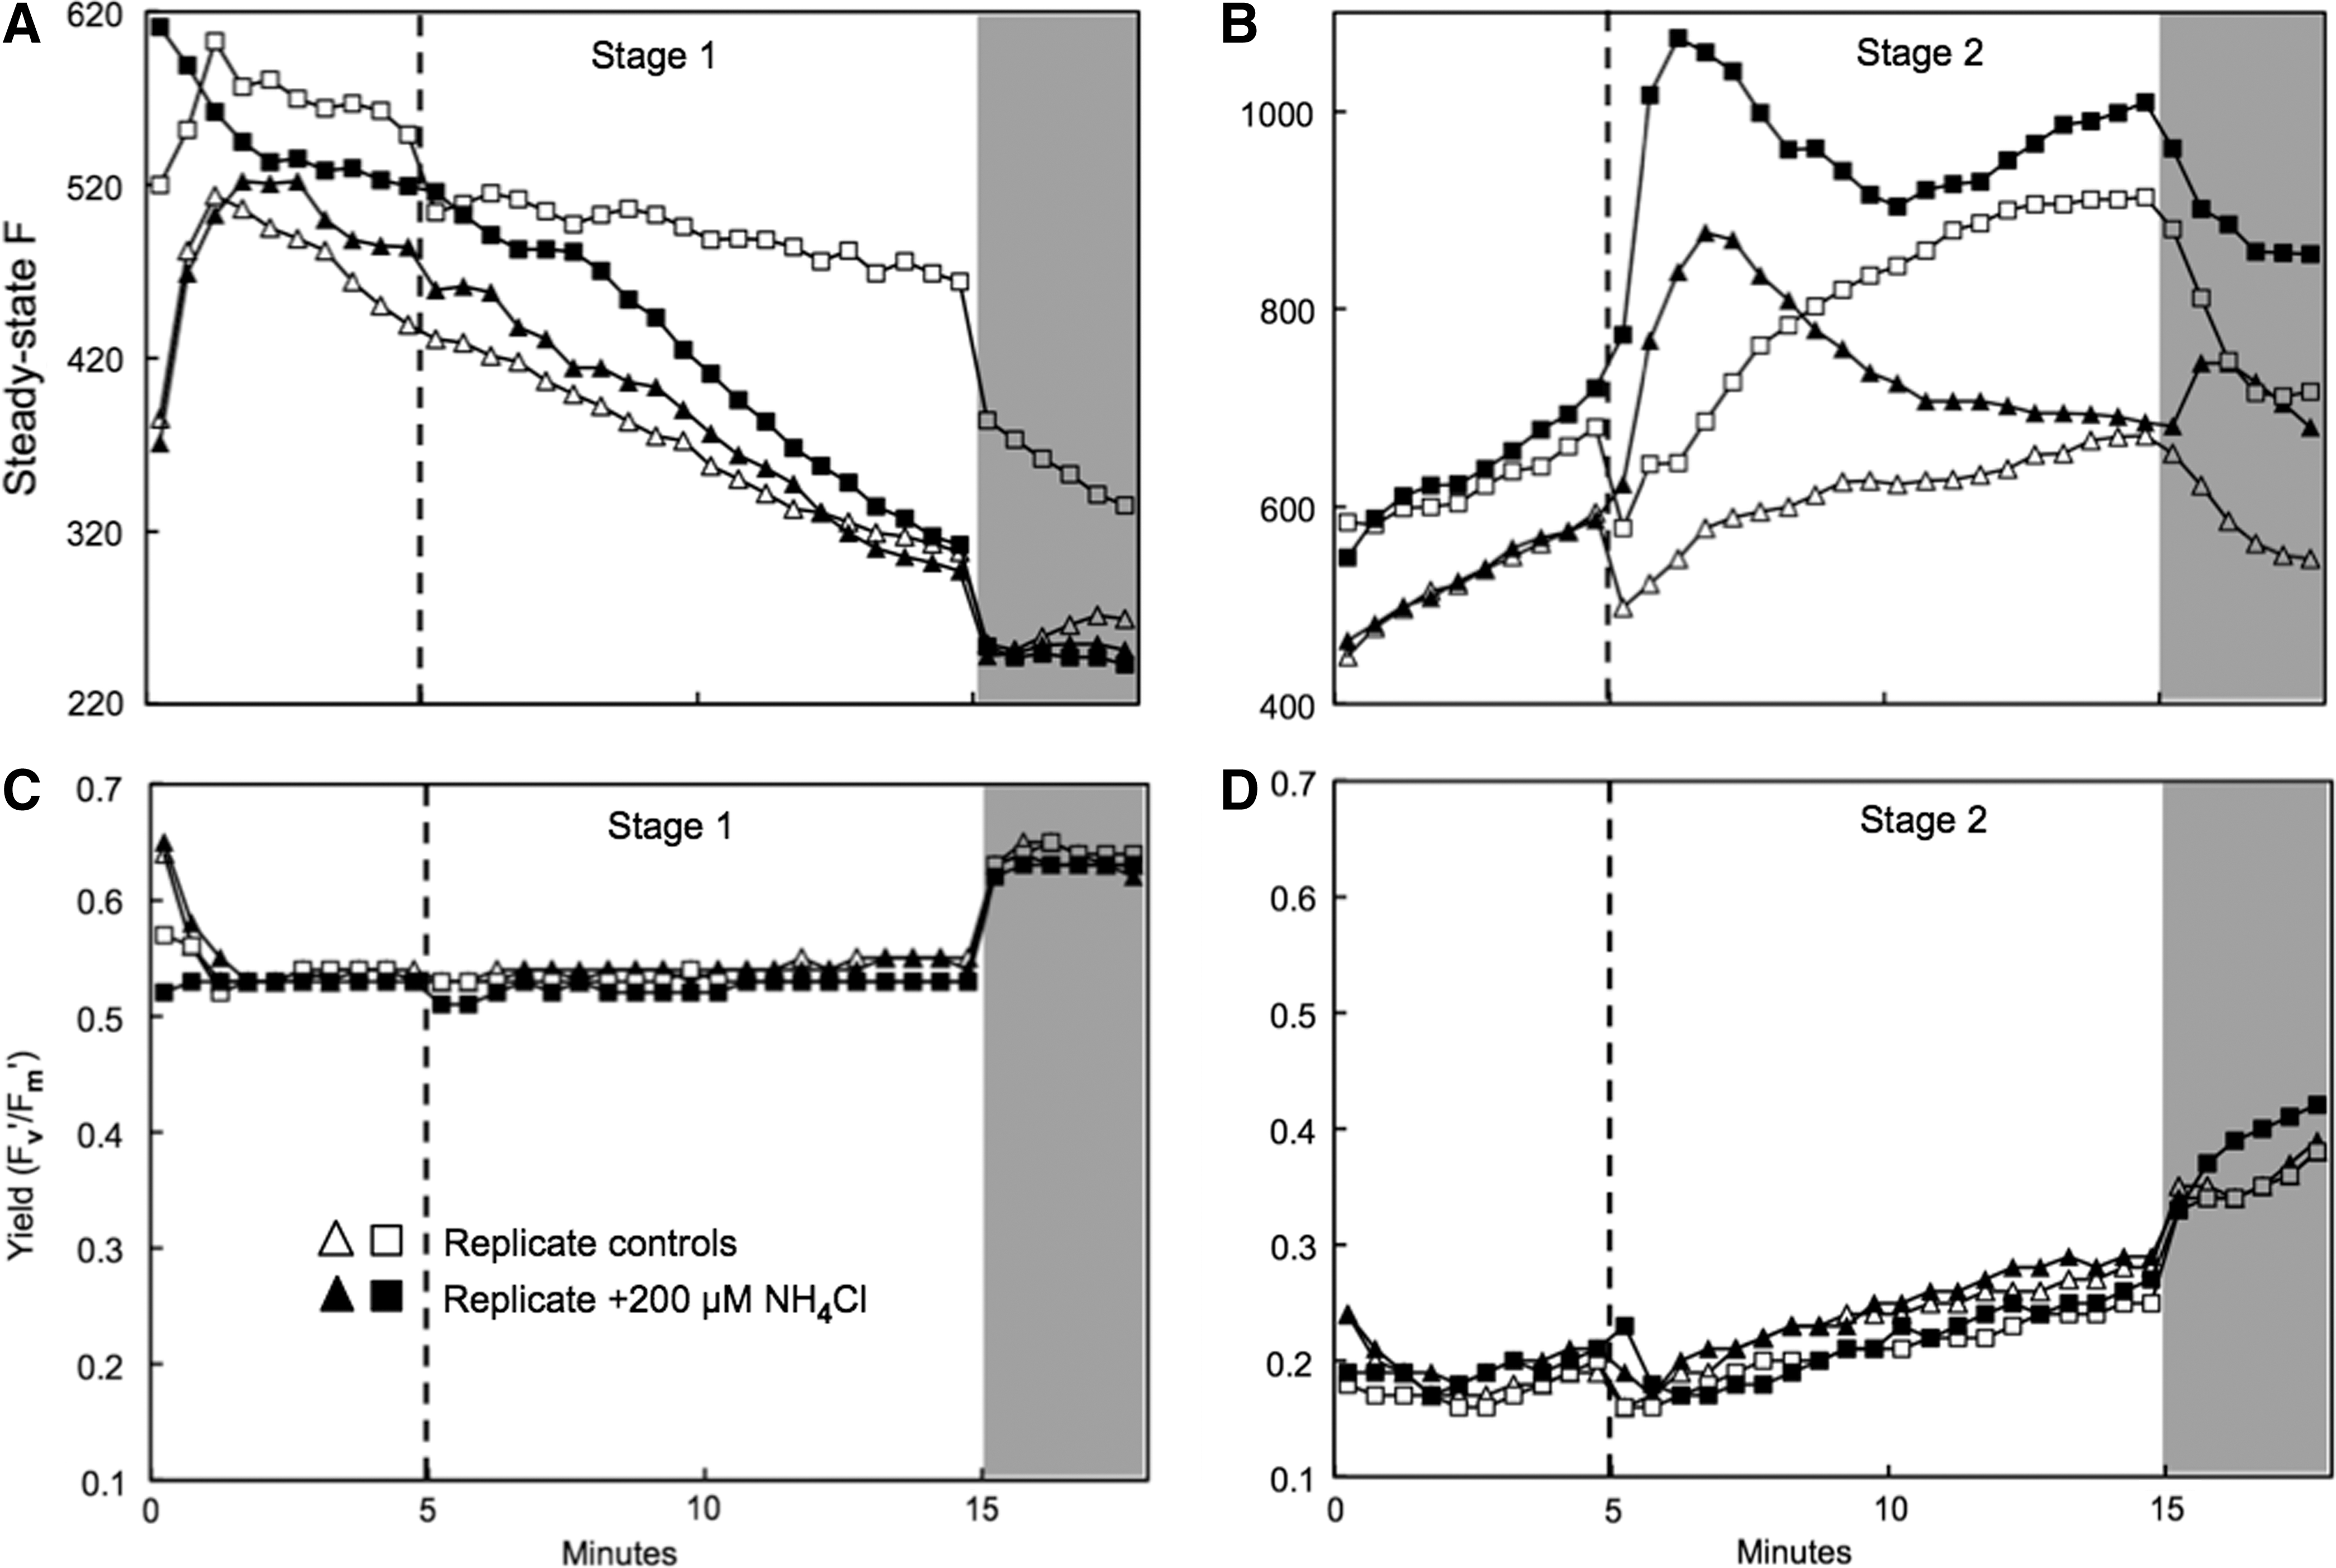
Steady state fluorescence
Rapid light saturation curves conducted after 3 min in darkness following NIFT assays showed no difference between cultures treated with 5% NaCl as a control or 200 μM NH4Cl (Fig. 5). However, stage 2 cultures had about half the rETRmax and a lower initial slope (α) compared to stage 1 cultures. The Fv/Fm was significantly lower (p<0.001; 2-tailed paired t-test) in stage 2 (0.41±0.02; mean±SD, n=4) than in stage 1 (0.64±0.01). Reduced Fv/Fm, rETRmax and α together indicate lower photosynthetic efficiency and capacity in stage 2 cultures, consistent with reduced dilution rate and N-limitation.
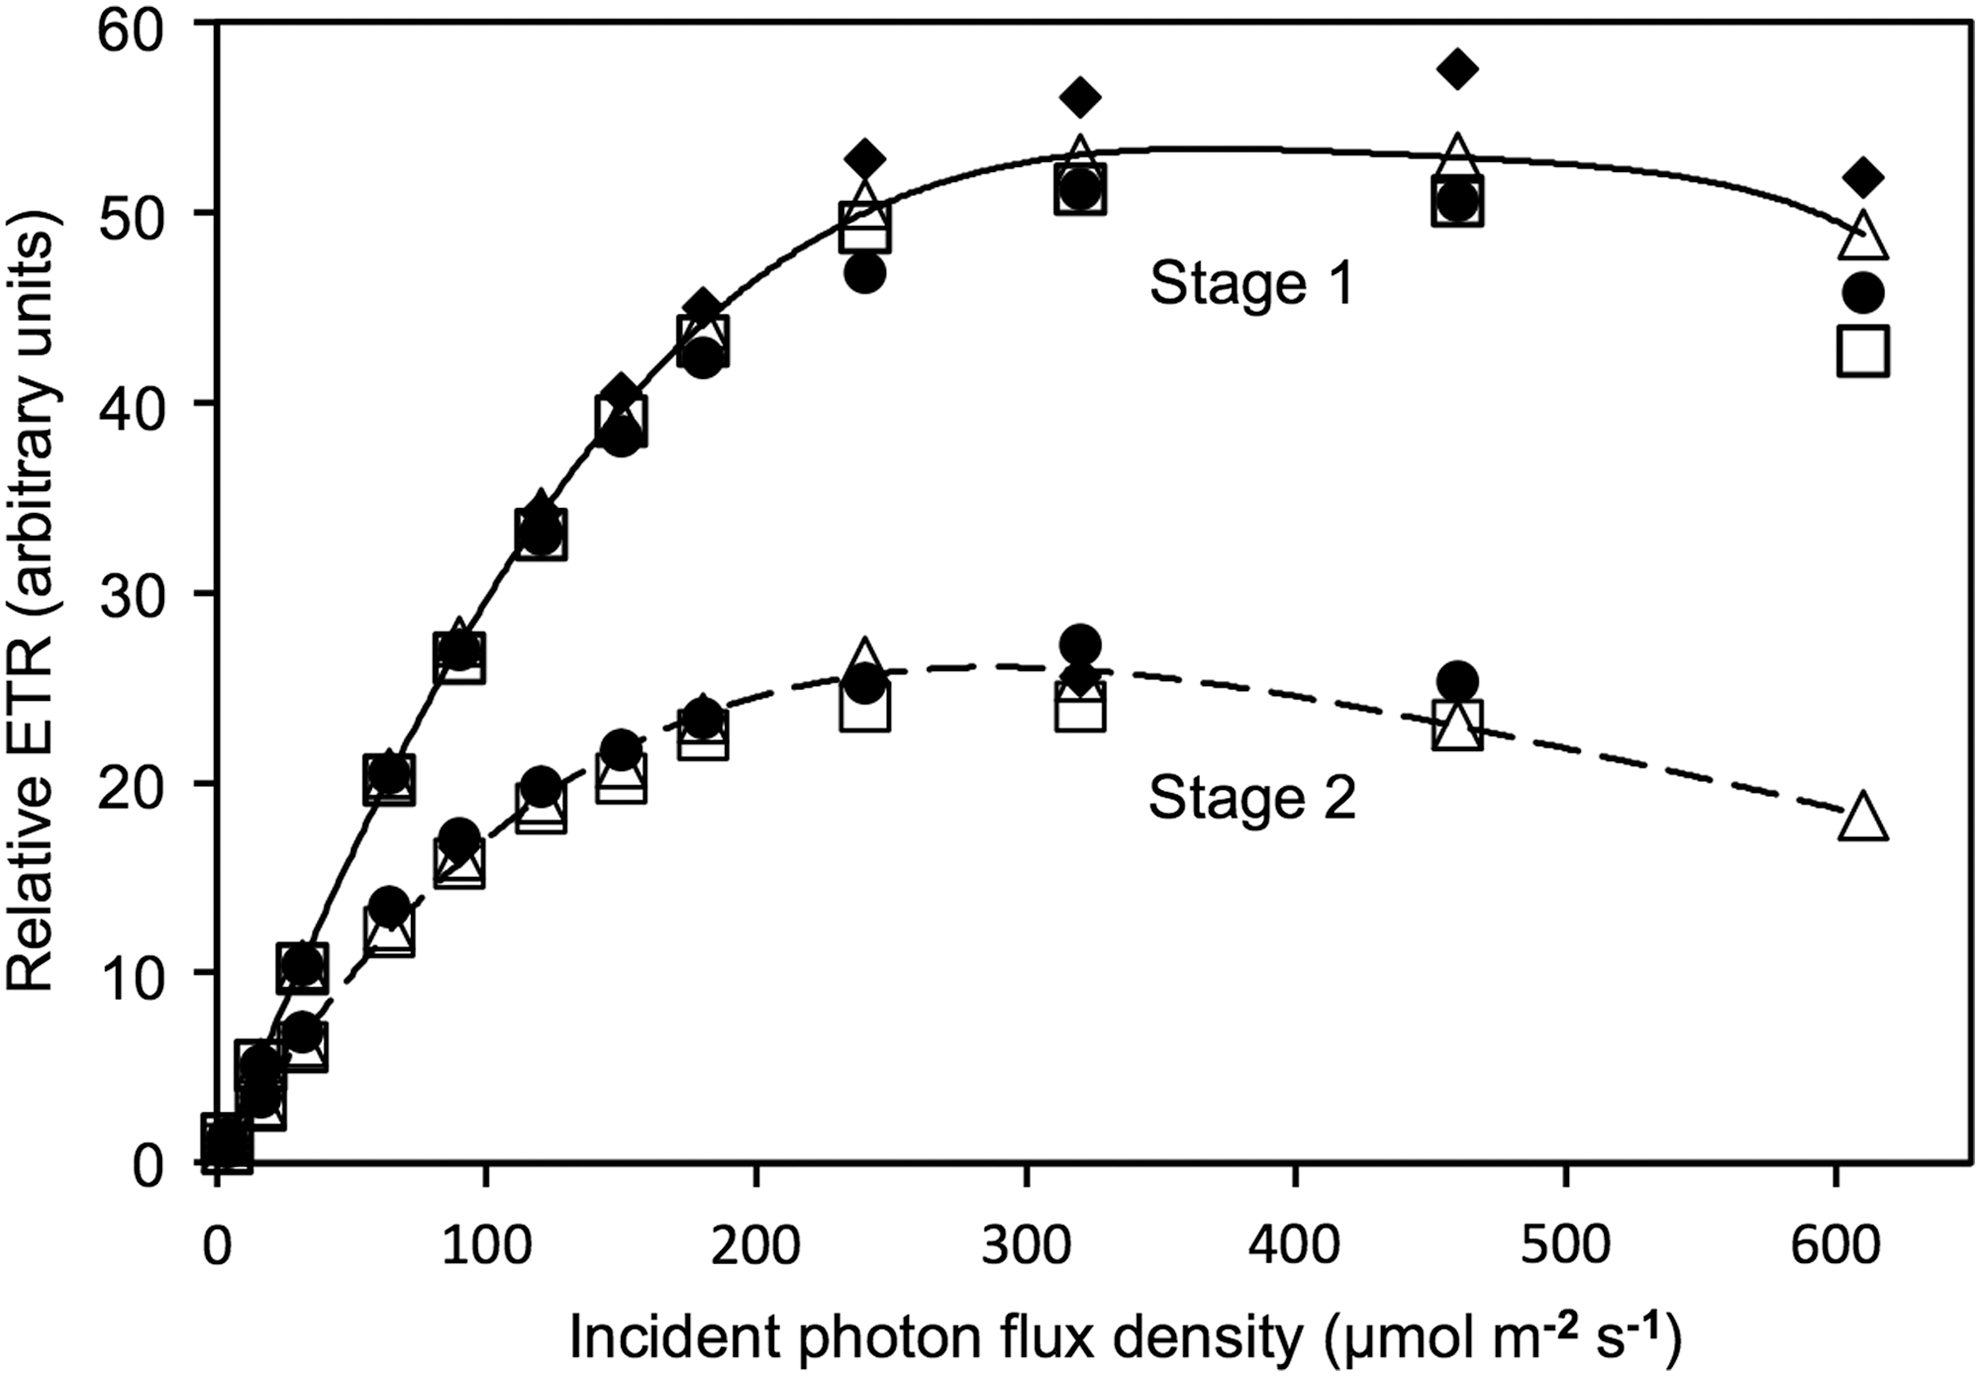
Rapid light curves (relative electron transport rate vs. light) for cells from stage 1 and stage 2 cultures of Dunaliella sp. measured immediately following NIFT assays in Fig. 4. Open symbols (▵□) followed addition of NaCl as controls and filled symbols (♦•) followed addition of 200 μM NH4Cl. Lines are subjective polynomial fits.
Lipid Content and Fatty Acid Composition
NR fluorescence detected by flow cytometry on day 12 indicated a 3-fold higher relative neutral lipid content in stage 2 than stage 1 cultures sampled mid-photoperiod (Fig. 6, Table 1). Although we did not directly validate that the NR differences between stage 1 and stage 2 cells were quantitatively related to neutral lipid content, others have demonstrated linearity for bulk and flow cytometric NR assays. 32,40 This supports the concept of cells with elevated lipid content maintained at a stable low growth rate of∼0.2/d. This is especially noteworthy given contrary observations that led to the claim that “nitrogen-limitation in Dunaliella cultures does not increase either lipid content or lipid productivity.” 19,46 It would be worthwhile to evaluate the diel pattern of lipid content in continuous culture, as any variability could be used to optimize harvest time. In cyclochemostat-grown Isochrysis, carbohydrate and lipid production rates more or less followed the diel irradiance pattern, and cellular carbohydrate:carbon and lipid:carbon ratios were maximal at the end of the photoperiod. 32 Similar results were obtained with semicontinuous cultures of Nannochloropsis and synchronous heterotrophic cultures of the dinoflagellate Crypthecodinium cohnii. 47,48 This would suggest that the optimal time to harvest would be late in the day, but that would need to be reconciled with our concept of a fully continuous culture and harvesting system.

Flow cytometry forward scatter (FSC) vs. FL2 channel plots for cells from stage 1
Flow Cytometry Data Based on Plots Such as Those Shown in Fig. 6 for Turbidostat Cultures of Dunaliella sp. The Two Values are Weighted Means of All Gated Events (All Quadrants Combined) for the Duplicate Two-Stage Culture Systems.
Forward scatter (FSC) is an indicator of cell size.
FL2 channel (525±15 nm fluorescence) indicates Nile Red (NR) fluorescence associated with neutral lipids.
Total lipids comprised 11% of total dry weight or 15.6% of estimated salt-free dry weight of the cumulative stage 2 effluent biomass over the last eight days of the turbidostat. Salt content was estimated assuming that the wet cell pellet had the 5% w/v salt content of the culture medium. Lipid class and fatty acid composition are shown in Table 2. Qualitative fatty acid composition was similar to previous reports for Dunaliella spp. 39,49 –51 Neutral lipids comprised about one-third of total lipids. Stage 1 biomass emptied into stage 2, thus we were unable to assay lipids in stage 1 biomass to confirm the NR difference between stages. These estimated lipid levels are toward the low end of widely varying estimates for Dunaliella, but we emphasize that this particular strain is not necessarily ideal for lipids, and the cultivation system has not yet been optimized to hyper-accumulate lipids. For example, we used only elevated bicarbonate (HCO3 -) in the medium influent to stage 1 and no further inorganic carbon enrichment in stage 2, where lipids accumulated as nitrogen was depleted. Consequently, pH during the photoperiod of day 15 was ∼9.2 in stage 2, indicating possible CO2 limitation, although a pH of ∼9 in stage 1 on day 5 indicates that rapid growth is compatible with high pH in Dunaliella. Moreover, biomass for lipids analysis was pooled from over several entire photoperiods that probably exhibit time-varying TAG content, and it is conceivable that some TAG was catabolized during up to 24 hours of storage in the collection flask despite being on ice. 32,47
Lipid Content Data for Combined Stage 2 Effluents for the Last Eight Days of the Turbidostat Cultures. Neutral-, Glyco- and Phospholipids Add up to Only 83.5% of Total Lipids Due to Incomplete Recovery During the Cumulative Separation Process. Fatty Acids Comprising <0.8% of the Total for Any Lipid Class are Excluded.
Conclusions
Despite several design limitations, lipids clearly accumulated in stage 2 cells based on NR flow cytometry, confirming results from single-stage continuous light turbidostat cultures of N. oleoabundans. 31 Maintenance of photosynthetic light use efficiency in a nutrient-limited and thus energy-imbalanced continuous culture system is critical. 31 Our successful proof-of-concept system is not yet optimized for high biomass density and yield. The maximum density of stage 1 was limited by our current optical and electronic setup, which could be fixed with simple design changes. In this experiment, the total effluent volume collected over eight days for both systems combined (∼5.3 L) yielded only ∼0.29 g dry biomass after correcting for estimated salt content, for a relatively low stage 2 biomass density of ∼0.054 g/L. Enriching the air stream to >1% CO2 and optimizing light absorption, nutrient concentrations, and relative volumes of stage 1 and stage 2 will be essential to increase productivity as well as lipid and co-product yields. Testing with other species, replacement of the enclosed second stage with an open raceway, and outdoor testing will be necessary to evaluate the potential for scale-up. Continuous biomass transfer from the stage 1 PBR to a stage 2 raceway should reduce the competitive ability of contaminating algae in the latter, and our system should be compatible with incorporating multiple stages for contaminant control. 13 –18
Footnotes
Acknowledgments
This research was supported by grant PS11-013B from the Plant Sciences program of the Oklahoma Center for the Advancement of Science and Technology (Oklahoma City, OK). Robin Madden and Dr. Jack Dillwith in the Department of Entomology and Plant Pathology at Oklahoma State University (OSU, Stillwater, OK) conducted lipid analyses. Marie Montelongo and Dr. Jerry Ritchey in the OSU Department of Veterinary Pathology provided training and access to the FACSCalibur.
Author Disclosure Statement
No competing financial interests exist.