
Abstract
Several challenges have to be overcome for the production of biofuel from algae to be commercialized. Key among those challenges is the management of contamination in open ponds; without technology to do this, biomass cannot be produced economically. A number of successful open pond technologies have been developed that manage contamination by creating an extreme environment that limits the amount of contamination and improves the stability of these systems. However, these solutions are neither aligned with the economics of fuel production, which demand low costs and high volumes, nor are they suited to many strains of algae considered candidates for fuel production. This work describes a possible solution developed by Sapphire Energy, Inc., to the contamination challenge of open pond cultivation with a strain of algae considered suitable for the production of biofuel. This example illustrates an integrated solution that incorporates pest identification, tracking, and management, and it focuses on a primitive fungal pest that has been shown to crash open ponds of algae used for the production of biofuels. The implementation of this solution can prevent these crashes and offers an approach to managing contamination in open ponds, thereby advancing the prospect of using algae as an economically viable strategy for the production of biofuels.
Introduction
Algae biofuels may provide a viable future alternative to fossil fuels, but a number of challenges remain before this can become an economic reality. 1,2 To compete with fossil fuels, algae biofuels must be produced at large scale and at low costs. Currently, the estimated cost for a barrel of algae oil ranges from $300–2,600, whereas a barrel of fossil oil typically costs $40–80. 3 –6
One of the key platforms that will facilitate the scale-up of algae biofuels in a cost-effective manner is the open pond platform for the production of biomass. Despite their submaximal productivities, these ponds will form the basis of microalgae production at the large scale required for biofuels because of their simplicity and low costs. 7 However, this technology has not yet been optimized for those algal species short-listed for oil production, such as Scenedesmus sp., Chlorococcum sp., and Tetraselmis sp. 8 The primary challenge with growing these species is culture contamination and population crashes. 9 Open ponds are an excellent habitat for a variety of algae contaminants that can act as competitors (other algae, bacteria), parasites (virus, fungi, protozoans), or consumers (protozoans, aquatic invertebrates). 10 –13
A number of strategies have been deployed to mitigate the impact of this contamination; the most effective approach actively deployed in the commercial production of algae using open pond technology involves maintaining an extreme culture environment, such as high salinity, high alkalinity, or high nutritional status. 14 To date, only a limited range of microalgae have been maintained as monocultures in open ponds for long periods: e.g., Dunaliella, high salinity; Spirulina, high alkalinity; and Chlorella, high nutrition. 15 These processes are cost-prohibitive for the production of biofuel, but are supported by the high value of non-fuel products. 16
Other strategies have been suggested and attempted for managing contamination in open ponds. Many involve deploying a chemical into the pond that alters the pond environment to confer a differential advantage on the target algae strain, or to disadvantage the undesirable contaminant. Examples of these strategies involve the use of hyperchlorite in Nannochloropsis cultures to control protozoa and disadvantage invasive strains. 17,18 Ammonia has been used as a treatment for rotifers and cladocerans in open ponds, and pH adjustments (decrease to pH 3 for 1–2 hours, followed by adjustment to pH 7.5) have been used to target rotifers. 17,19 Glyphosate and ozone have been used to maintain dominance in Nannochloropsis cultures. 20,21 The use of pesticides such as Dipterex, Parathion, and dichlorodiphenyltrichloroethane (DDT) to control zooplankton has been tested in laboratory-scale Chlorella sp. cultures but has not been used in large-scale cultures. 22
None of the above chemical strategies has been successful at commercial scale or for extended periods of time in open ponds. Here we describe a strategy optimized by Sapphire Energy, Inc., for managing pest contamination in strains of algae used in the large-scale production of biofuel. This example will focus on open pond cultures of the green algae strain Scenedesmus dimorphus, which is considered by many a potential strain for the production of biofuel. 23,24 This microalgal strain, while suited to the production of biofuel, is subject to biological pests such as primitive fungi. 25,26 Sapphire Energy, Inc.'s strategy involves isolating and identifying organisms responsible for reducing productivity in open ponds and then developing both real-time tools to track those pests and chemical strategies to manage them. These processes are then integrated in the field, at scale, and over the long-term.
Materials and Methods
Isolating Pests
Pests were isolated in a similar method to that described in Letcher et al. 26 Samples were collected from ponds of S. dimorphus in which microscopic evidence showed the presence of amoeboid-like microorganisms infecting numerous algal cells. Plaque plating was used to isolate pests by preparing 10-fold serial dilutions of the infected culture in 96-well plates. A 100-μl aliquot of each dilution was added to 1 mL of a saturated S. dimorphus culture and 4 mL of 0.75% soft agar in 15-mL culture tubes. The contents of the culture tubes were mixed thoroughly and poured onto solid agar plates. These plates were then placed in an acrylic box maintained at 33°C with continuous light (defined here as Utilitech Lighting 4100 K T8 light bulbs, ∼200 μmol/s/m2) and a carbon dioxide (CO2, 5%) flow rate of 0.3 L/min. Plaques were observed in approximately 5 to 7 days.
Pest Phenotype
The organism obtained from plaques observed in the isolation step was used to inoculate axenic uninfected algae to establish a pest-response phenotype. These plaques were cored and suspended in modified artificial seawater media (MASM) (D). 26 This suspension was then used to inoculate (1% v/v) axenic cultures of S. dimorphus grown to mid-log phase in MASM (D). Fifty milliliters of axenic algal culture was inoculated (in triplicate) into 125-mL polycarbonate Erlenmeyer flasks with vented DuoCaps (Florida Scientific Products, Orlando, FL). The cultures were then grown on a shaker (150 rpm) in an acrylic box maintained at 33°C with continuous light, and were provided CO2 (5%) at a flow rate of 0.3 L/min. Cell dynamics in these cultures were monitored through fluorescence (measured using a sample diluted 10-fold at the following wavelengths: excitation 430 nm, emission 685 nm) and quantitative polymerase chain reaction (qPCR). Cultures in which the fluorescence decreased were analyzed for the presence of the organism that was used to inoculate the crash. If the organism inoculated grew coincidentally with the algae dying, it was assigned a pest designation. Fluorescence of algal cultures—a relative measure of algal biomass—was measured at excitation 430 nm and emission 685 nm using 200-μL samples in a microtiter plate reader (SpectraMax M2, Molecular Devices, Sunnyvale, CA).
Sequencing, Identification, and qPCR Primer Development for Putative Pest Organisms
Initial sequencing of the internally transcribed spacer (ITS) region of the eukaryotic ribosome of putative pest organisms was performed as described in Letcher et al. 2013. 26 The sequence was aligned using Basic Local Alignment Search Tool (BLAST) against the National Center for Biotechnology Information (NCBI) nucleotide database for identification. qPCR primers were designed from the ITS sequence (forward primer CACGCGTACGGTTGATTAGA, reverse primer TGAATGCACTTTGCACTGCT) and validated according to Minimum Information for Publication of Quantitative Real-Time PCR Experiments (MIQE) guidelines. 27
Laboratory Pesticide Data
S. dimorphus cultures were grown in 5-mL volumes in snap-cap test tubes. The growth medium was as described for pond cultivation (see below). Tubes were incubated in a rack at an angle of approximately 20o on a rotary shaker (190 rpm) in an acrylic box maintained at 33°C with continuous light and were provided CO2 (5%) at a flow rate of 0.3 L/min. Defined infection sources for pesticide testing included equal mixtures—by cycle threshold (CT) values—of FD95 (the fungal pathogen described here), FD01 (Amoeboaphelidium protococcarum), and FD61 (unpublished). 26 Stock solutions of water and the commercial fungicide Headline (BASF, Ludwigshaven, Germany) were mixed to the desired final concentration of active ingredient and added immediately to the culture. Algal growth of all the cultures was measured by optical density (OD) (750 nm), and initial OD readings were typically 0.1.
Pest Tracking
Samples of pond culture were lysed by boiling in lysis buffer, as described by Letcher et al. 26 qPCR with primers specific for FD95 (MyiQ2 Real-time PCR Detection System, iQ5 software package, or CFX96 Real Time PCR Detection System, CFX Manager software package, Bio-Rad, Hercules, CA) was used to determine relative levels of pest DNA. The CT value was used to track this DNA. This represents the number of cycles required for a fluorescence signal to cross a threshold. The more DNA there is, the fewer cycles required to cross the same threshold. Decreasing CT values indicate increasing pest DNA levels. DNA was diluted 1:20 in double-distilled water. qPCR reactions were set up with either iQ SYBR Green Supermix (Bio-Rad Cat # 170-8880) or SsoFast with EvaGreen Supermix (Bio-Rad Cat # 172-5200). For the MyiQ2 system, each reaction consisted of 10 μL of Supermix, 5.2 μL diluted DNA, and 4.8 μL 1mM oligonucleotide set. For the CFX96 system, reaction volumes were halved (final volume 10 μL). An annealing temperature of 57°C was used, with all other cycle parameters per the manufacturer's recommendation.
Pesticide Application in Open Ponds
The commercial fungicide Headline was diluted in water to a final concentration of 10,000 ppm of its active ingredient, pyraclostrobin. Appropriate precautions in accordance with the label requirements of Headline were used at all times during the application of pesticide. The concentrated fungicide solution was poured into the pond culture over a period of time approximately equal to the time taken for the culture to travel one cycle of the pond. This time varied with the size of the pond and the speed with which the culture was moving. All applications of Headline in outdoor pond culture were performed under regulatory guidance from the state of New Mexico. The ponds were dosed on day 4 of the experiment as shown in Figure 1.
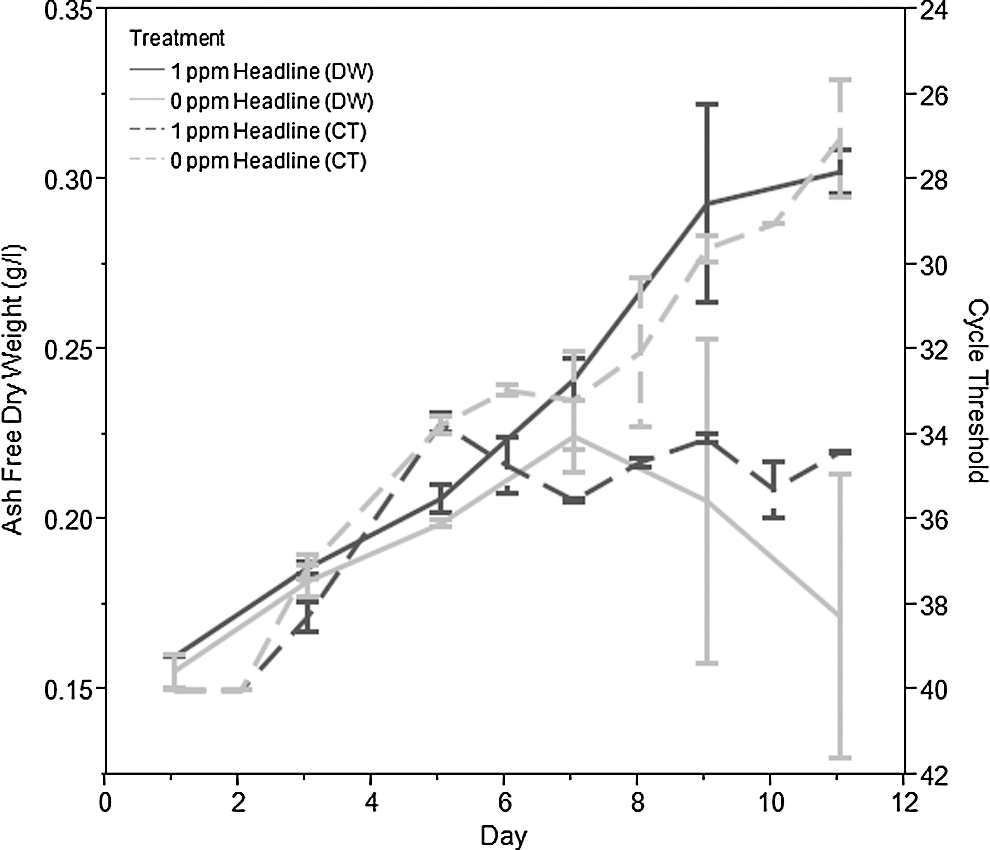
Data from duplicate outdoor ponds infected with a mix of algae pests and either treated with 1 ppm of pyraclostrobin via Headline fungicide, or not treated (controls). AFDW of the biomass is illustrated on the left axis and CT of the pest FD95 is shown on the right axis. The error bars represent the standard error of two replicates.
Pond Cultivation
S. dimorphus cultures were cultivated outdoors in Oswald-style mini-pond raceways at 25-cm depth with a total operating volume of 350 L. The medium composition is detailed here as the ingredients required to prepare 1 L (1.929 g NaHCO3, 2.373 g Na2SO4, 0.52 g NaCl, 0.298 g KCl, 0.365 g MgSO4·7H2O, 0.084 g NaF, 0.309 mL 67% (w/w) HNO3, 0.039 mL 75% (w/w) H3PO4, 6 mg 4Na-EDTA·4H2O, 1.164 mg FeCl3·6H2O, 0.275 mg MnCl2 anhydrous, 0.125 mg ZnCl2 anhydrous, 0.076 mg Na2MoO4·2H2O, 0.024 mg CoCl2·6H2O, 4.036 mg 4Na-EDTA·4H2O, 1.2 mg Ferix-3 [Kemira, Helsinki, Finland]). Culture pH was maintained between 8.8 and 9.2 by bubbling 100% CO2. Ash free dry weight (AFDW) (g/L) of the pond was tracked every other day using standard AFDW techniques. The infection ponds were inoculated (0.1% v/v) with equal mixtures of FD95 (described here), FD01 (A. protococcarum), and FD61 (unpublished) on the first day of the experiment. 26
Results
Isolating Pests
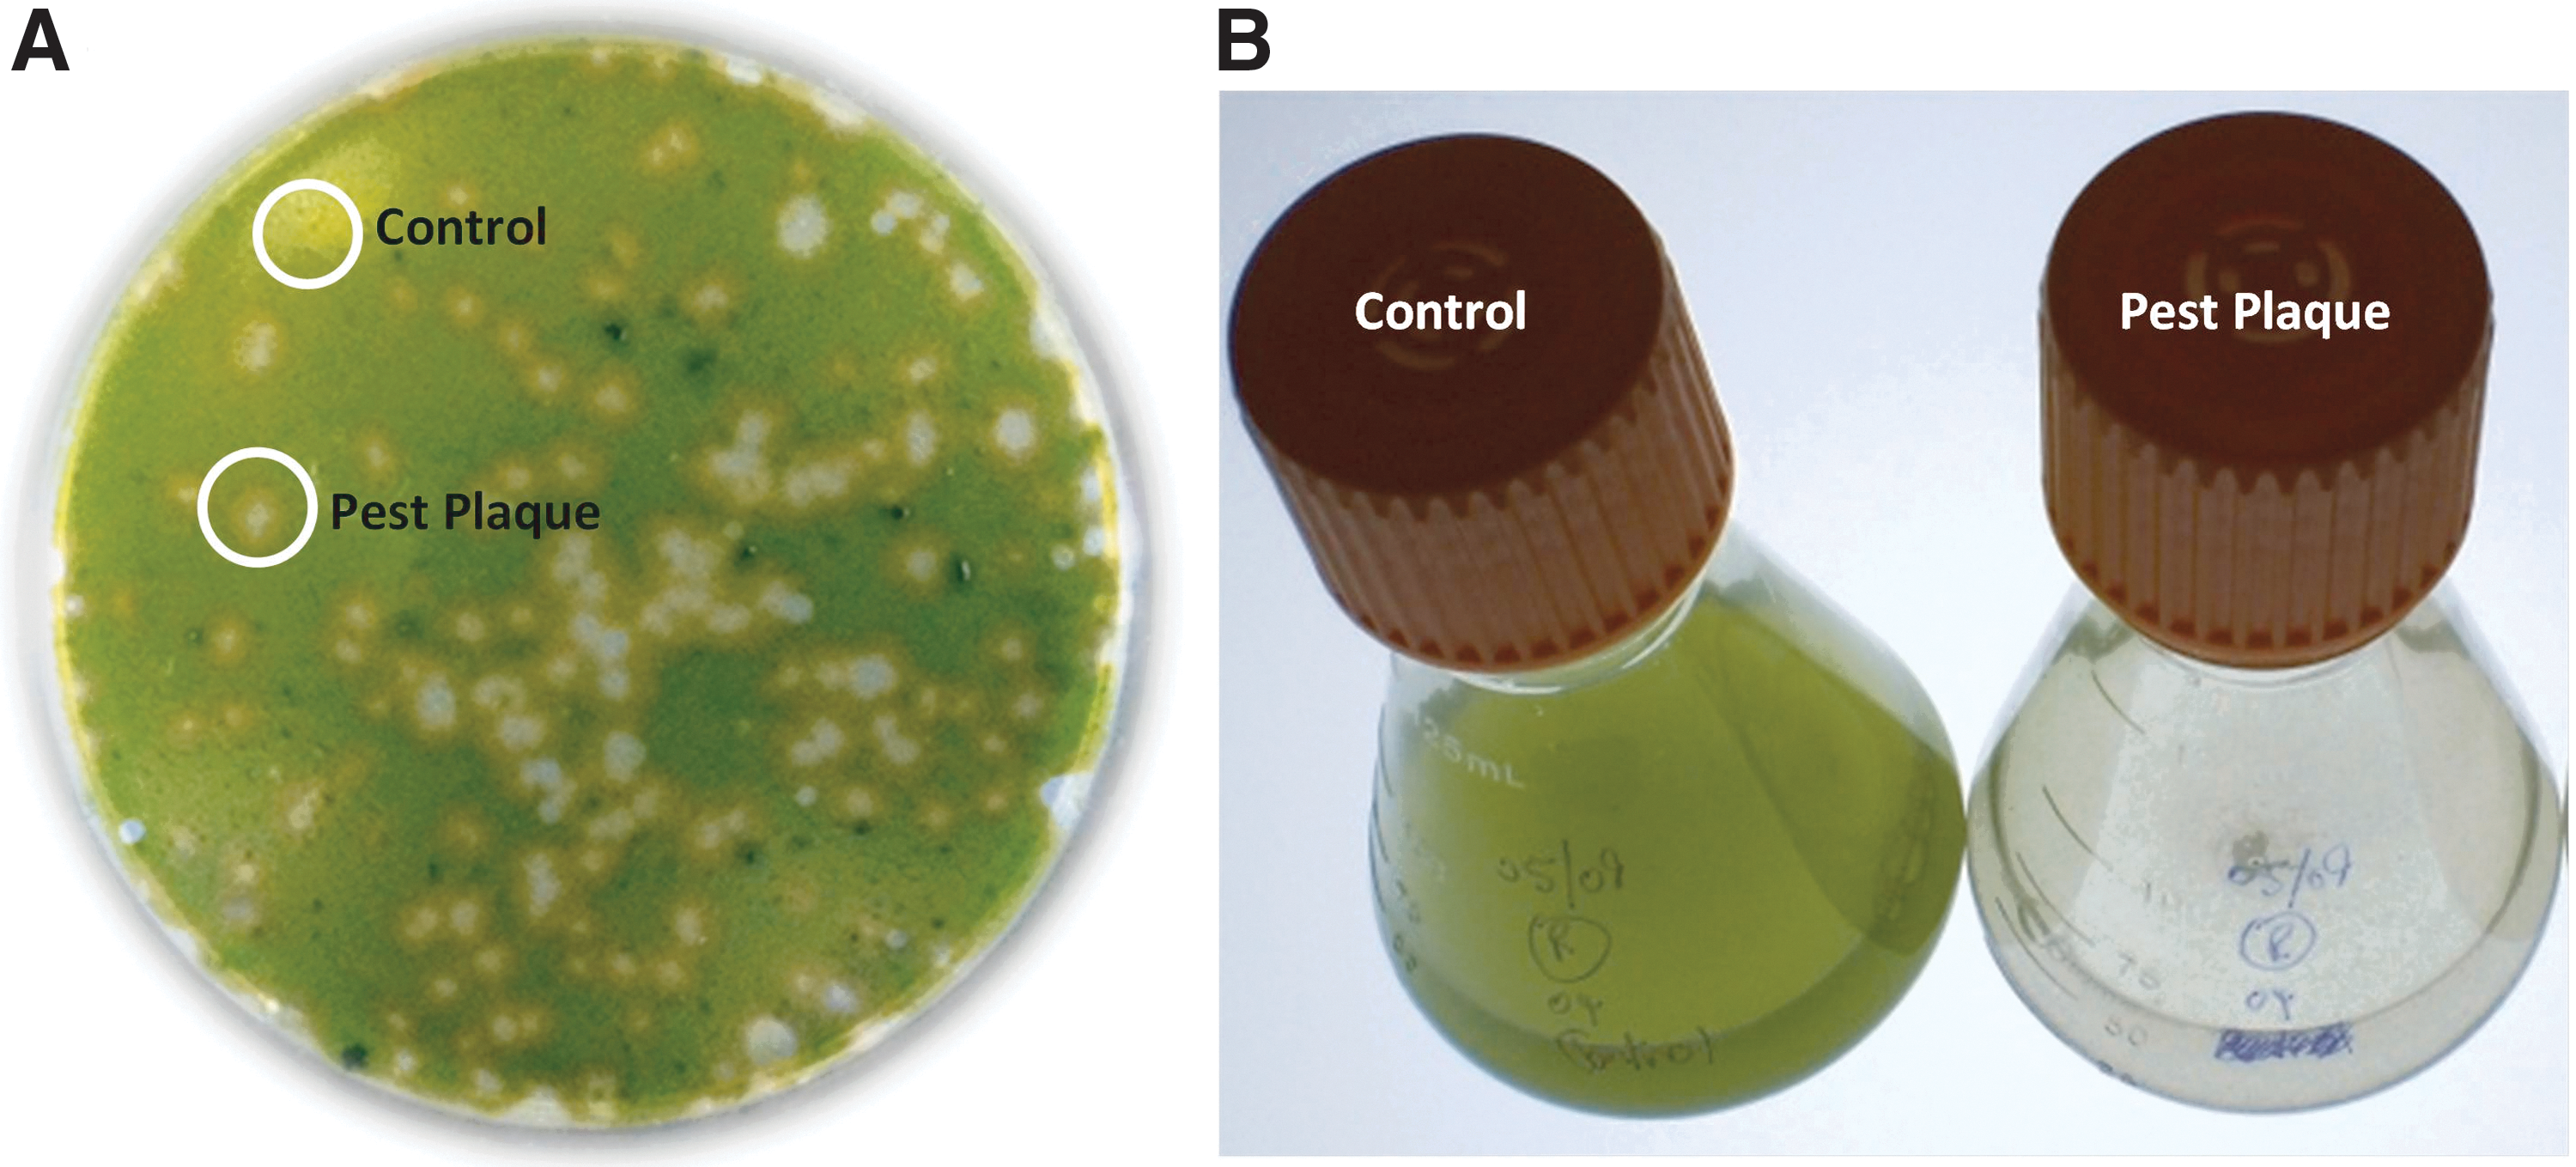
Plaque plating was used as the primary technique for isolating potential pest organisms from outdoor cultures of S. dimorphus that displayed health declines or crashes. Figure 2A shows plaques that were generated from an infected culture and subsequently used to isolate an organism associated with a pest-response phenotype. Once these plaques were generated, individual plaques were cored, sequenced, and used to infect axenic cultures of S. dimorphus in the laboratory. After four days, these cultures typically had one of two phenotypes: algae in the inoculated flasks were both green and dominant, or live algae were completely absent–i.e., crashed (Fig. 2B). If this initial culture crash could be replicated by re-infecting fresh axenic culture and the predominant sequence identified from the crashed culture matched the sequence from the plaque/inoculum, then the organism was considered a pest.
Pest Phenotype
Figure 3 shows data illustrating the pest-response phenotype demonstrated in Figure 2B. As time progressed, the infected culture began to die as the pest reproduced. In the control flask, where there were no pests, the algae grew normally.
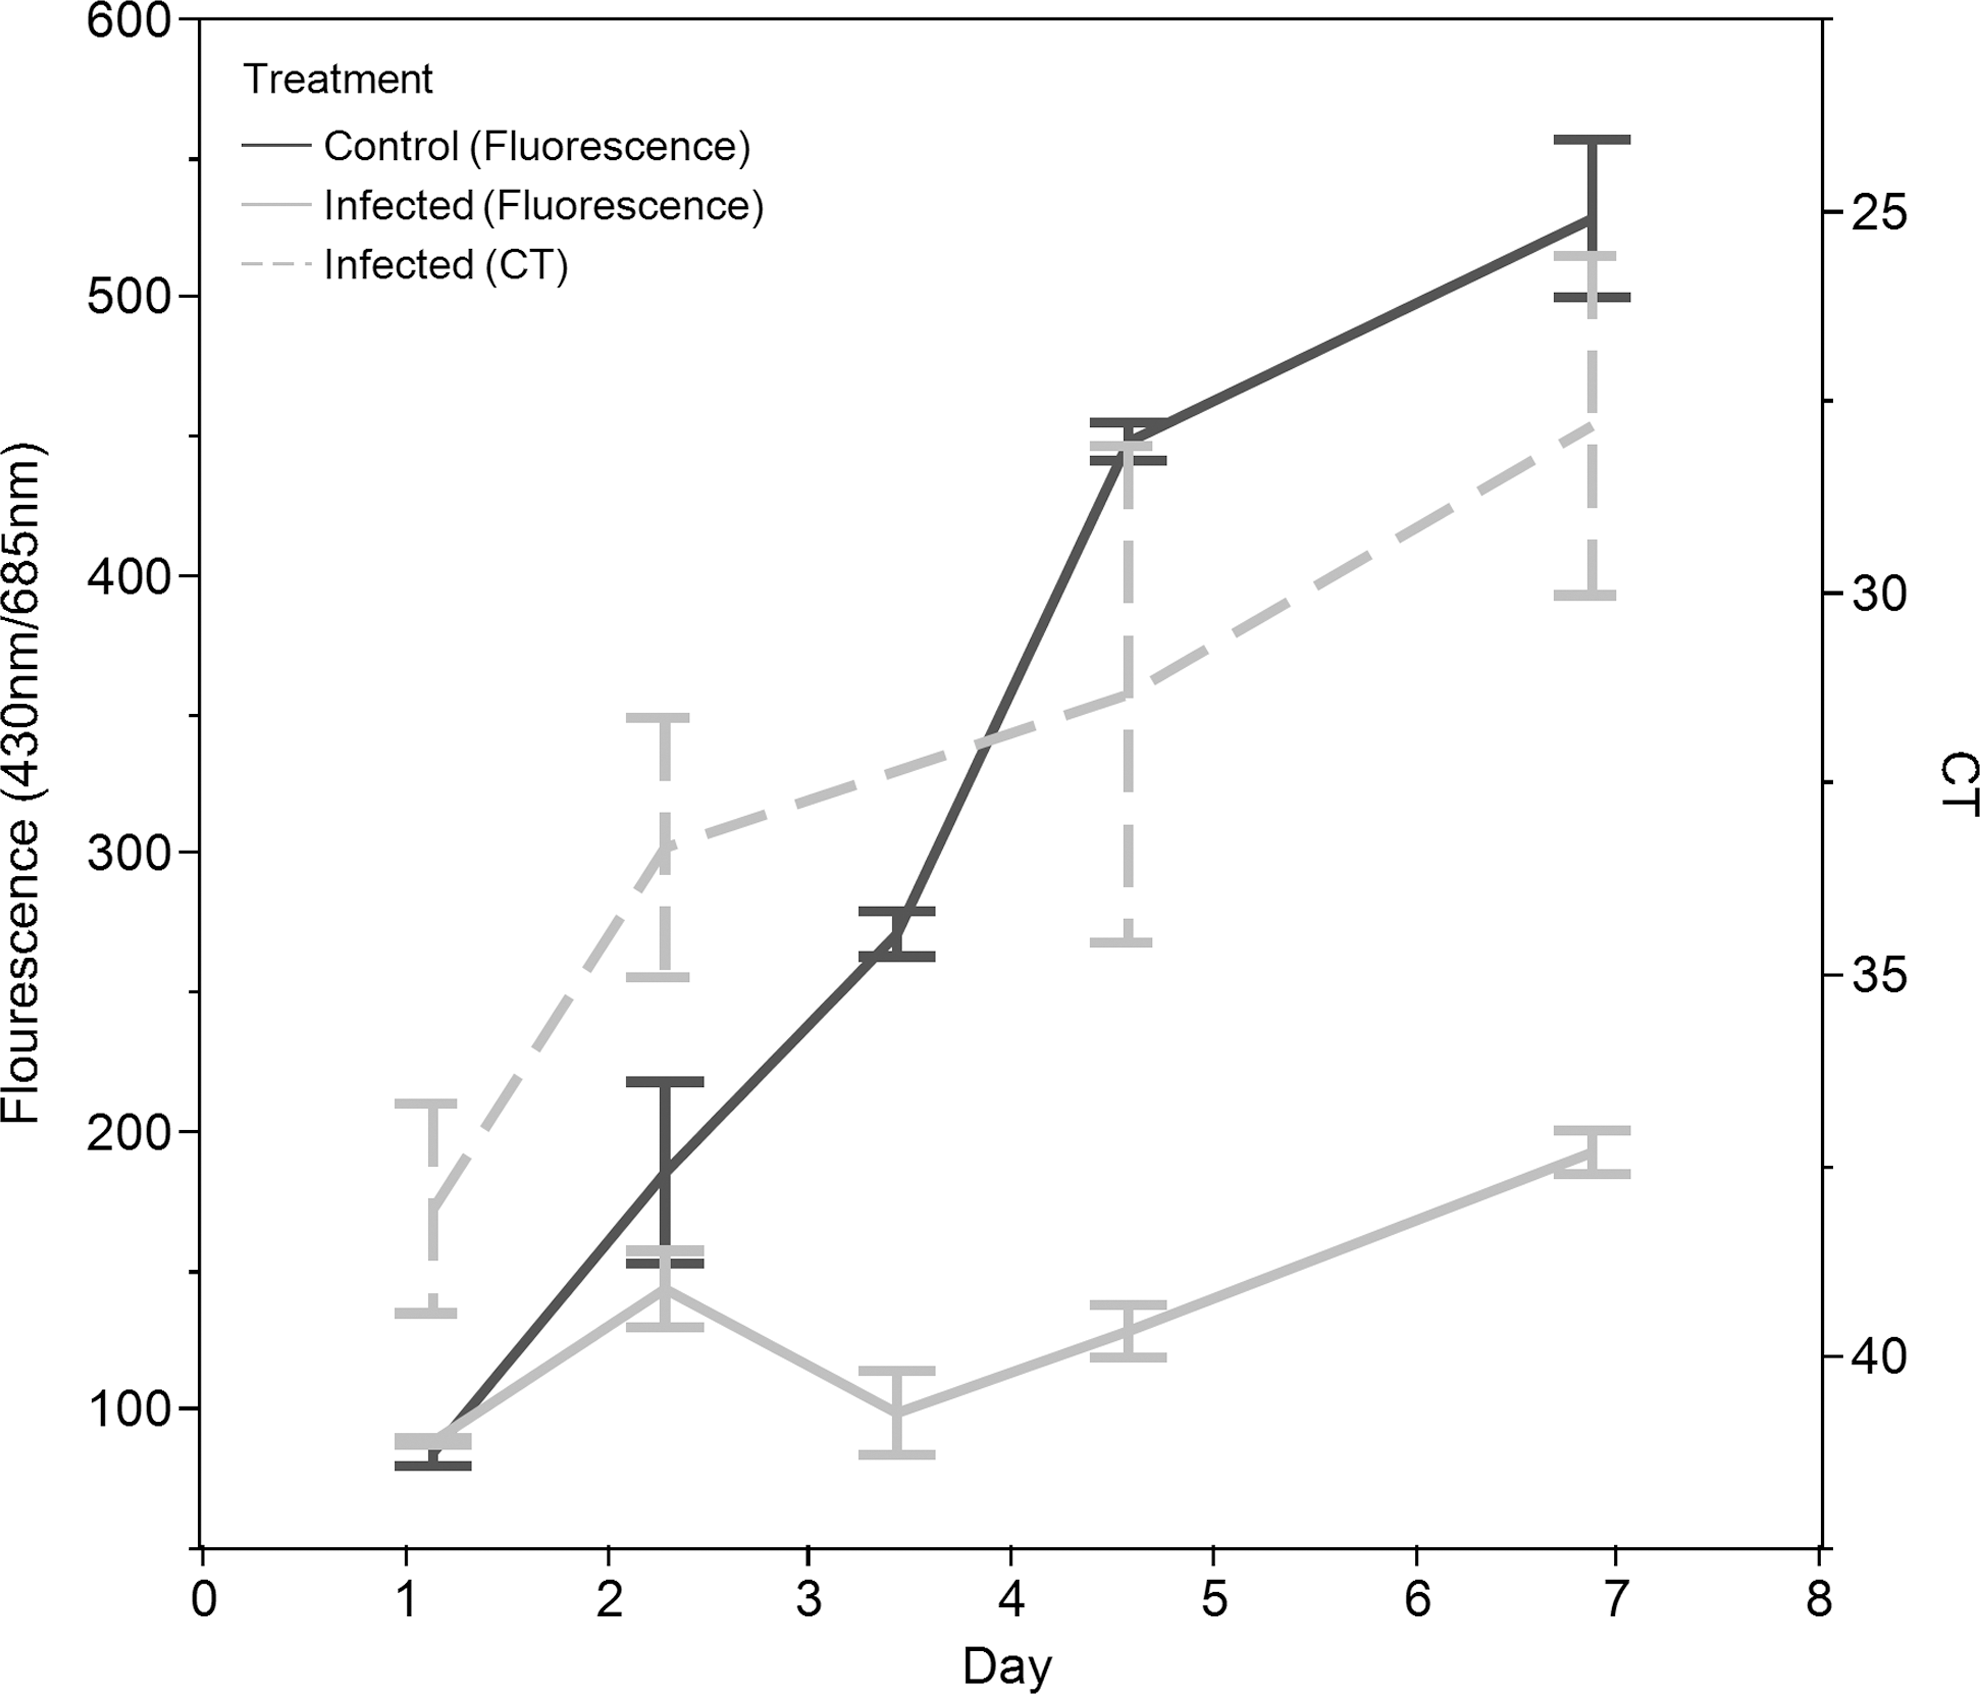
Time course of change in algal biomass (measured with fluorescence) and fungal parasite DNA abundance (measured with qPCR as CT where units are number of PCR cycles) of a control culture and a culture infected with the fungus FD95. The cycle threshold value decreases as the amount of pest DNA increases. The axis is reversed to reflect intuitively how the pest DNA is changing through time. Changes in control fluorescence values are denoted with dark gray solid lines, and changes in infected culture fluorescence are denoted with light gray solid lines. Changes in pest DNA are denoted with a light gray dashed line. As the fungal contaminant in the infected culture begins to grow, it kills the algae, resulting in minimal algal growth. The uninfected culture continues to grow during the entire time course of the experiment. The error bars represent the standard error of three replicates.
Pest Identification
An example of a pest isolated in the manner described here was termed FD95. The ITS1&2 sequence identified for this organism showed that FD95 is an unidentified organism, putatively Cryptomycota, and closely related to the recently described parasite of S. dimorphus, A protococcarum. 26 ITS1&2 region sequencing resulted in the following sequence: CCGTAGGTGAACCTGCG GAT GGATCATTACTAAATCTGTCG TGCG TATGACTCTGCATTCTTGAA TGCG T CTCATTCCACTTCAAAT TA CTCA TCATTGT GAACTGTTGCTAA TGTGTA TG CAATCACCTTTTTGGT GACG CGTG CCAT TAGTCTTTTATT AAACTA AAACT TTTAAA CTAAAG ATCTCTGCACAAACT TAGTGT TGT GTCAACTAAA AACTAAAACTTTTA GCA ACGGATCTCTAGGCTCTCGCA GCGATG AGAACGCAG CGAA TTGC GAAAT GTAAT GTGAATTGC ATTT ACCGCG AATCA TTAAA TCTT TGA ATGC ACTTTGC ACTGCTGTGAATT CACGGCAGTACGCCTGTTTGAGCA TCAATCAAATTTCTCACTTTTATAT AGTGATT GTGAAG TACTGGATAC AGTACTTTTG AGTTTA CACAAACT GTT CGTGTTGAT ACAACA GTTGG CAATATCTATATCGATCTT GTC AA CTCTAATCAA CCGTACGCGTGTTT ATTGA GCTCTG ACTG CTCTCTCAT TACATTGATCTCAAATCAGGCGAG AATACCC GCTGAACTTAAGCATAT CAATAAGCGG.
Light Microscopy
Images of the pest organism FD95 across its life cycle, collected using light microscopy, are shown in Figure 4. Free living, motile aplanospores with several pseudopodia were evident and abundant (Fig. 4A) and were often seen proximal to host cells (Fig. 4B). As an aplanospore encountered S. dimorphus cells, it began an attachment phase (Fig. 4B). The attached aplanospore encysted on the host cell surface (Fig. 4C). The parasite protoplast was injected into the host cell, and degradation of the host cell was clearly visible (Fig. 4D). The parasite penetration tube into the host was also visible (Fig. 4E). With the host cell wall serving as the parasite sporangium wall, cleaved aplanospores were released (Fig. 4F) following dehiscence of the aplanospore cyst (AplC). This life cycle resembles that of many microbial pathogens of algae. 26,28

Light microscopy of the life cycle of the fungal pathogen FD95.
Laboratory-Scale Pesticide Tests
A pesticide with potential utility for crop protection in open pond algal cultivation must necessarily demonstrate efficacy against a predator or pathogen at a concentration below the concentration that causes toxicity to the cultivated algae strain. This difference is referred to as a therapeutic window. Initial pesticide testing comprised a combination of toxicity tests on potential production strains and efficacy tests against captured and cultured pests of those strains. Concentrations to be tested were determined empirically. When a putative therapeutic window for a pesticide was found, lab-scale testing proceeded with cultures comprised of infected production strains utilizing media and nutrient maintenance relevant to broader investigations of production site and strategy. Pyraclostrobin carbamate is a member of the widely used strobilurin class of fungicides. It acts by interfering with electron transport in fungal mitochondria. Strobilurins have potential for protective and curative action. As noted above, the commercial formulation evaluated in this study was the compound Headline, a fungicide widely used on a number of crops such as cotton, peanuts, corn, and various beans. It was selected for evaluation because it has been used successfully in the treatment of fungal diseases in commercial agriculture. 29,30
The data shown in Figure 5 were derived from experiments designed to demonstrate the efficacy of using pyraclostrobin to manage pests. Because we were looking for crop protection solutions to multiple pests, the infection source used for testing Headline efficacy included equal mixtures of three pathogens of algae (FD95, FD01, and FD61) previously described. In the absence of pesticide, infected cultures crashed and thus showed little change in OD over time. In contrast, uninfected cultures exhibited large increases in OD over the duration of the experiment; the difference between these two treatments was statistically significant (analysis of variance (ANOVA), n=3, p<0.0001). In the presence of 0.5 ppm pyraclostrobin via the addition of Headline, there is no longer any difference in growth between infected and uninfected cultures as demonstrated by comparable OD changes (ANOVA, n=3, p=0.5899). At higher levels of pyraclostrobin, differences in OD change are observed between the infected and uninfected treatments, suggesting that the most effective dose is approximately 0.5 ppm under the conditions used in this experiment, and that there may be some synergism between pest stress and chemical stress.
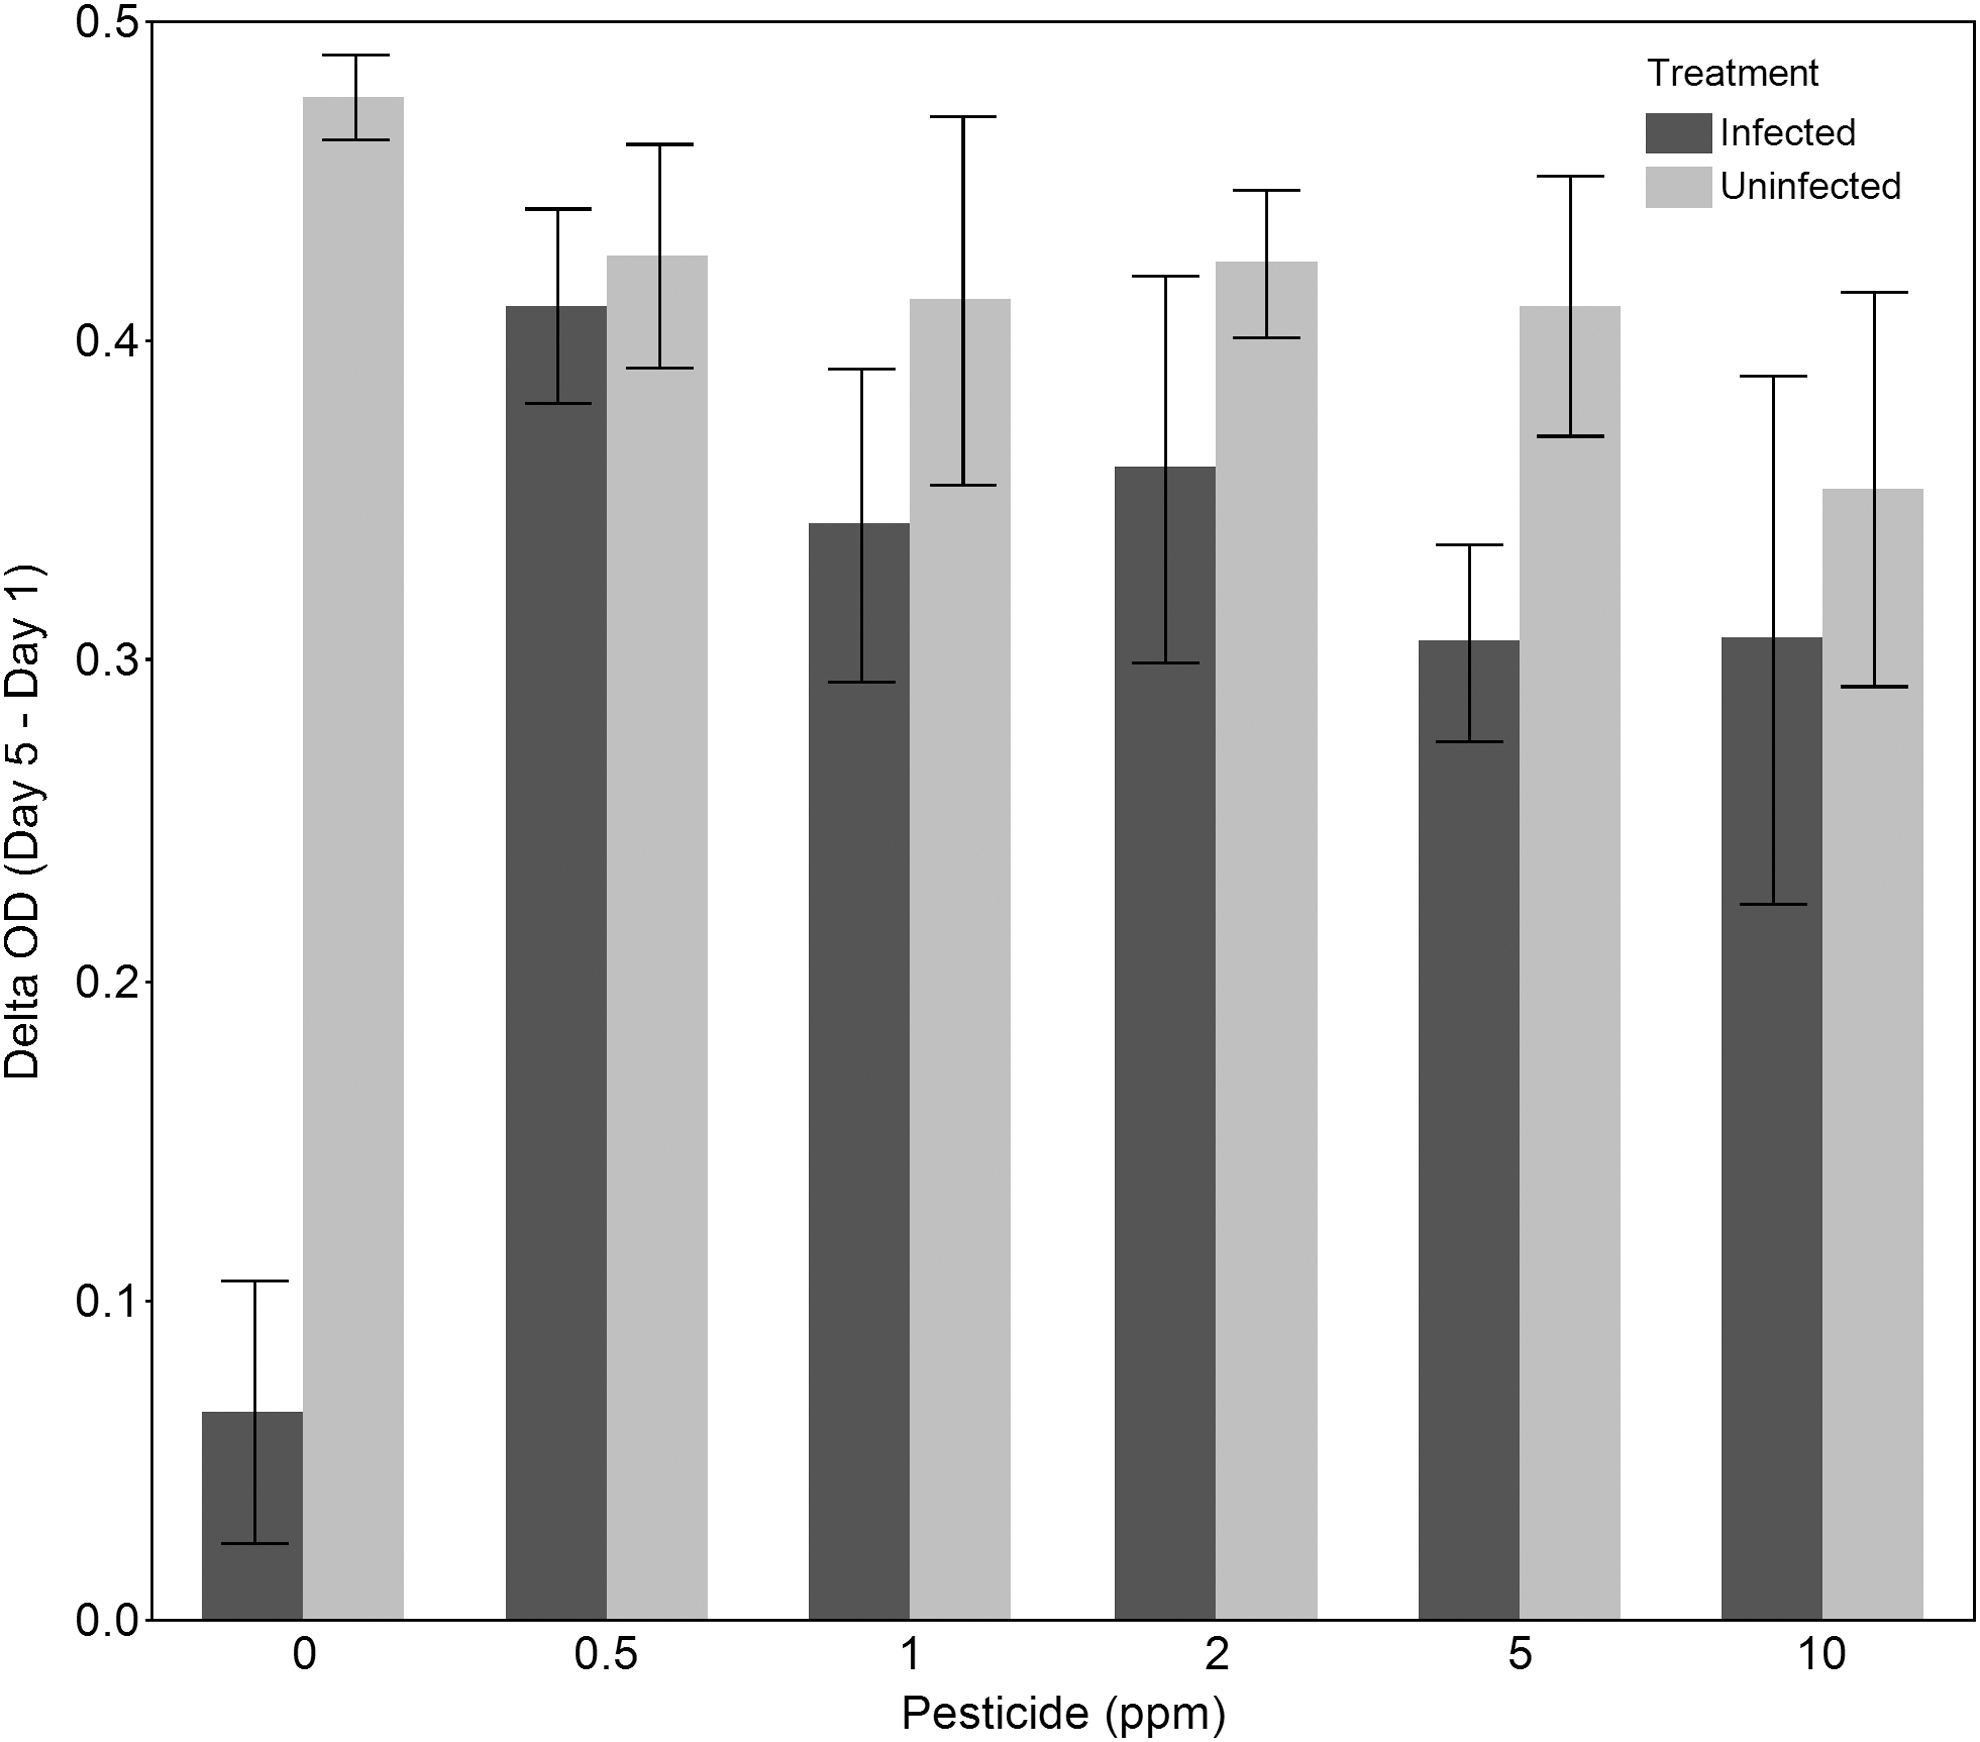
Laboratory tests to find the effective dose of pyraclostrobin to manage fungal pests of cultivated S. dimorphus. Culture of S. dimorphus was infected with a mixed infection source and grown in the presence of five different levels of pyraclostrobin for four days. The post-infection change in OD of the algae cultures over four days is shown. OD of the culture on day 1 was subtracted from the OD of the culture on day 5. If the culture grew, this change was positive, and if the culture did not grow, this change was close to zero. The error bars represent the standard error of three replicates.
Mini-Pond Pesticide Verification Tests
To test pest tracking by qPCR and treatment with 1 ppm pyraclostrobin via Headline, cultures of S. dimorphus were cultivated in 350-L mini-ponds and deliberately infected with FD95. Fig. 1 shows an example of field data that track both the growth of S. dimorphus and the growth of FD95 and how management strategies affected the impact of FD95. Lysates of pond samples were taken daily and the presence of DNA derived from FD95 was monitored using qPCR at regular intervals. These monitoring data were used to determine the presence of the targeted pest, and if this pest was increasing or decreasing in abundance over time; it was not designed to give a quantitative estimate of pest prevalence. As shown in Fig. 1 the algal culture that received a 1 ppm pyraclostrobin via Headline dose continued to grow after treatment as indicated by increasing AFDW values (g/L), while the ponds that did not receive Headline ceased to grow as indicated by decreasing AFDW values. Based on parallel qPCR results, FD95 appeared to stop growing in the ponds that received Headline and continued to grow in the ponds that did not.
Discussion
Managing contamination in open ponds is about creating an environment in the pond that promotes the growth of the target strain(s) of algae over the growth of contaminants that may negatively impact the growth of the target strain(s). There will always be contaminants in the pond, and successful strategies will manipulate the pond environment (composition of the media, type of strains deployed, chemicals deployed, etc.) in a way that maximizes the growth rate of the target strain while simultaneously minimizing the growth rate of the contaminant(s). Such management presupposes that the contaminants impacting algae growth are known and can be tracked, and that strategies that will differentially disadvantage their growth rates with respect to the growth rate of algae are also known. A critical element of this solution is having a good lab model for the pests that enables low-cost evaluation of a large-parameter space to ensure that the best strategies can be devised at the lowest cost and are translatable to the field.
Sapphire Energy has developed a pest management strategy for identifying and tracking pests in algal cultures. This strategy also includes methods for preventing such pests from reducing culture productivity, such as the use of pesticides. Figure 6 illustrates Sapphire Energy's pest management strategy. If an unknown pest is observed, various techniques (e.g., plaque plating, baiting, selective media) are first used to isolate the putative pest organism. ITS or 16S sequencing is then used to identify the pest and to develop qPCR primers to track the genomic DNA of this pest in established ponds. A specific threshold is then established for the qPCR value of each pest that is being monitored. Once this threshold is reached, a crop-protection strategy—in this case, a pesticide application—is implemented, and the pest's temporal dynamics are consistently monitored to determine if the strategy is successful. This sequential process is repeated if the pest-management strategy is not successful and/or if a new pest is observed.
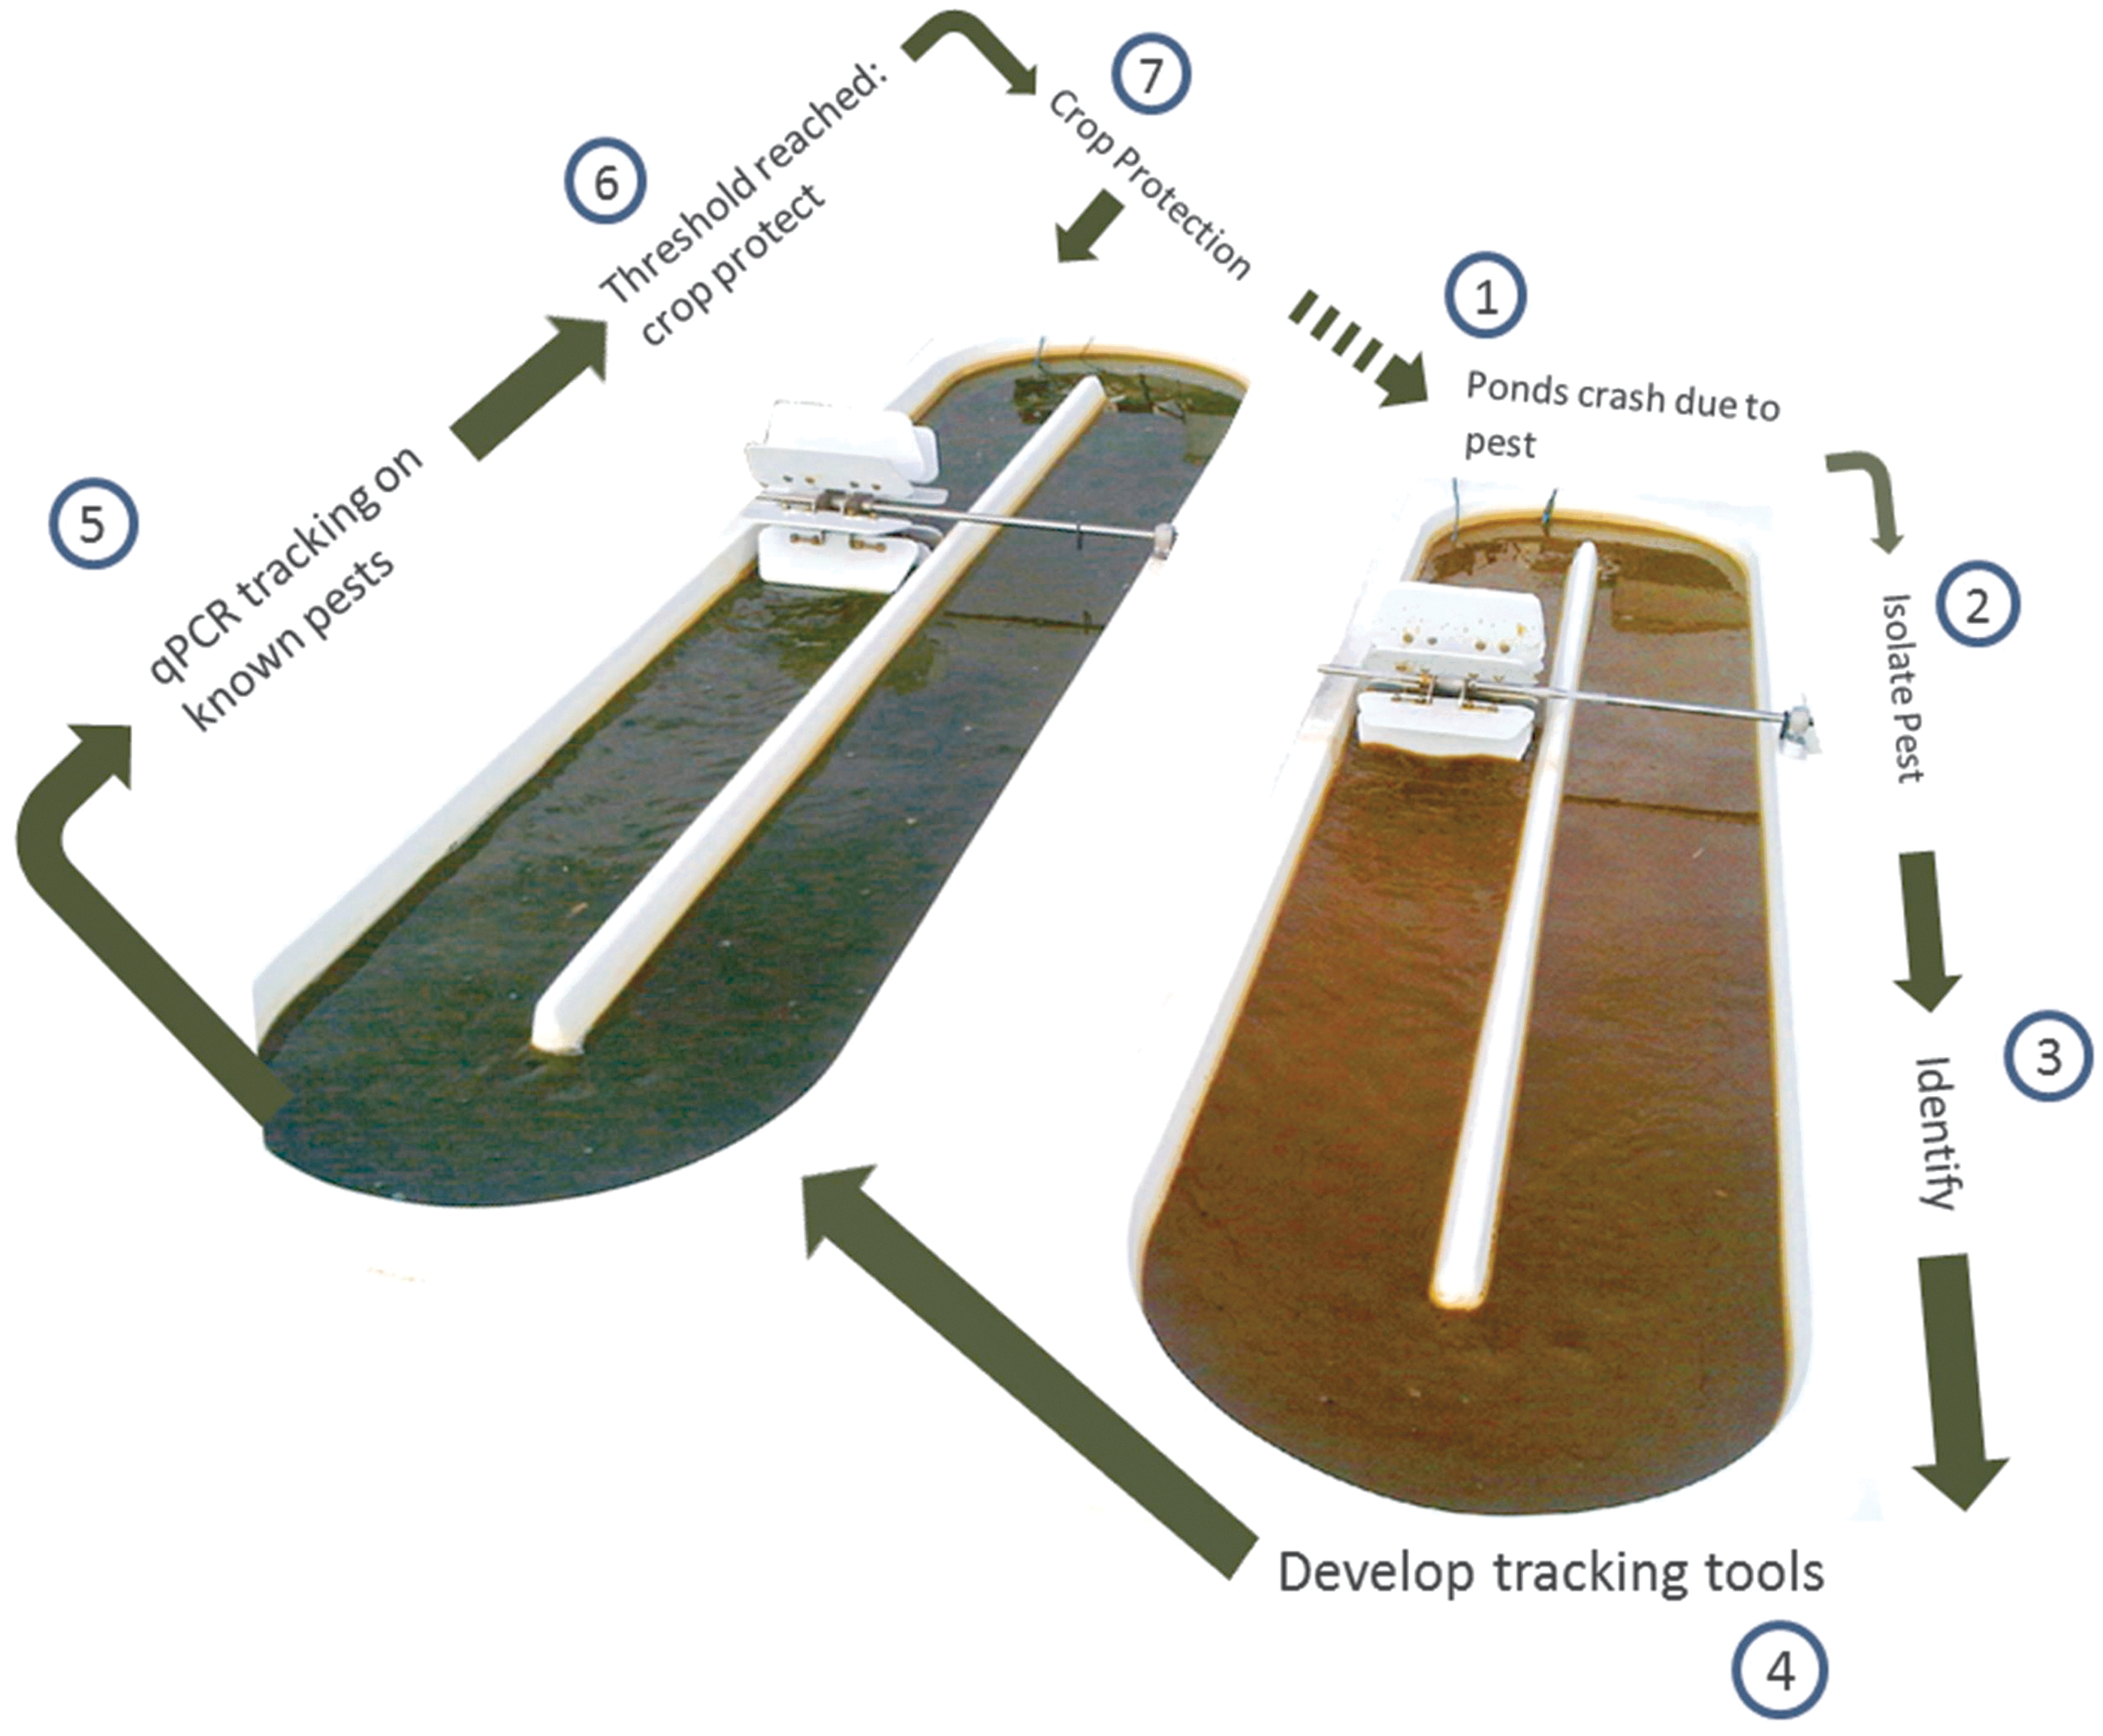
Pest management strategies are triggered by qualitative microscopic observations of pests in field samples and/or by bringing a pond sample into the lab and exposing it to conditions that would accelerate pest growth and precipitate a culture crash. If a new or unknown pest is observed, various microbiological techniques (e.g., plaque plating, baiting, selective media) are used to isolate this pest organism. ITS or 16S sequencing is then used to identify the pest organism and to develop qPCR primers to track the genomic DNA of the targeted pest in established ponds. A specific threshold is then set for the CT value of each pest that is being monitored. Once this threshold is reached in any given pond, a crop protection strategy (e.g., pesticide application) is then implemented and the pest's abundance is consistently monitored to determine whether the control strategy is successful. This iterative process is repeated if the pest management strategy is not successful and/or if a new pest organism is observed.
The possibility that a target pest may evolve resistance to the pesticide should be taken into account when considering this approach to managing contamination in open ponds. This has happened in many other agricultural settings and there is no reason to believe it could not happen in open ponds of algae. One of the strategies deployed to mitigate the risk of this happening is to use the pesticide discriminately. The initial implementation of pesticide use in agriculture, with its pest-independent doses, has driven the resistance of pests to unprecedented levels. 31 Another strategy to mitigate the likelihood of this happening is to rotate pesticides with differing modes of action. This reduces the likelihood of resistance emerging but does not rule it out. Another important tool in the management of resistance is vigilance. Monitoring pests for the evolution of resistance will enable a greater understanding of its mechanisms and evolution and may also shed insight into additional or synergistic strategies for managing resistant pests. Ponds will always be contaminated, and regardless of the biology of the strain deployed, there will always be the need to manage ponds to optimize the productivity of the target strain and mitigate the pest contamination that reduces it. Chemicals are one of the most readily available and deployable tools for an agricultural endeavor. However, as the field progresses and scales, there will hopefully be developments in other areas such as manipulation of the ecology of open ponds, which may manage contamination through the deployment of rational consortia.
Managing the stability of biomass production in open ponds growing algae for the production of biofuels will be a critical step in ensuring that this technology becomes economically viable. Currently, Sapphire Energy is successfully growing strains of green algae that were previously shown to be unstable in open pond conditions. This work describes an integrated system that includes pest designation, real-time tracking of pest dynamics, and the targeted deployment of a commercially available pesticide that can mitigate the impact of fungi on the stability of S. dimorphus production in outdoor ponds. Using this strategy, Sapphire Energy has successfully managed to culture green algae stably in non-extreme media for more than a year in outdoor open ponds. Strategies for deploying low cost and reliable open ponds for the commercial production of biofuels must continue to be honed as the field progresses toward commercial economics. Current data suggest that if improvements continue on expected trajectories, the industry will reap favorable energy return on investments for algae-based biofuels. 32 Data such as those presented here bode well for open-pond algae technology becoming a viable platform for producing biofuels to help address the projected supply challenges facing the world's energy markets in the coming decades.
Footnotes
Acknowledgments
The authors acknowledge the help of Kyle Botsch, Yan Xu, Kalli Lambeth, and Peter Letcher.
Author Disclosure Statement
Six of the authors of this paper are employees of Sapphire Energy, Inc., a for-profit company, the goal of which is to commercialize the production of a renewable source of energy using algae as a production platform.