




Abstract
Renewable energy has gained importance due to rising energy demands and diminishing fossil resources. Lignocellulosic biomass, with a core consisting of crystalline cellulose, has the potential to become a renewable source of fermentable sugars for energy production. However, to utilize this resource, biomass has to be broken down through physical, chemical, or enzymatic treatments. The biochemical hydrolysis of cellulose by cellulases offers an economical alternative to hazardous chemicals. Thus, complete knowledge of the molecular interactions between cellulases and cellulose would help to optimize the efficiency of industrial enzyme cocktails. Single-molecule (SM) methods study molecular events by visualizing individual molecules instead of measuring averages, thereby providing a detailed view of nanoscale processes with high spatial and temporal resolution. SM fluorescence microscopy utilizes enzyme and cellulose labeling, along with localization and tracking algorithms, to yield particle or fluorophore positions with nanoscale precision. Similarly, high-speed atomic force microscopy utilizes a high aspect ratio probe that is brought into close proximity and scanned across the sample to visualize the surface topography and its evolution over time. Both SM techniques have been recently applied to the study of cellulase-cellulose interactions and used to probe enzyme-binding orientation, affinity and reversibility, non-catalytic and catalytic surface motion, and the effect of molecular crowding on enzyme mobility. This review aims to showcase SM techniques and how they have been applied to study cellulose structure and cellulose depolymerization by cellulases. While the study of cellulase-cellulose interactions and cellulose depolymerization through SM microscopy is still a young field, these methods have already contributed to our understanding of the nanoscale processes involved in biomass conversion. Further application of SM techniques could elucidate molecular mechanisms involved in enzyme synergism, as well as the molecular changes that take place as cellulose fibrils are converted into soluble sugars.
Introduction
The ever-increasing energy requirements of a growing population pose a challenge to traditional power-generation methods. A greater awareness and demand for renewable energy sources has given rise to a continuous search for alternatives. Lignocellulosic biomass offers such an alternative, because it provides a rich source of structural polysaccharides, is available in abundance, and can be converted into composite building blocks (e.g., cellulose nanocrystals, cellulose microfibers, cellulose nanospheres) or soluble sugars. 1,2
Lignocellulosic biomass is found in plant cell walls and is structured in macrofibrils, each of which is a bundle of microfibrils with diameters of 10–20 nm (Fig. 1). The core of a microfibril is composed of crystalline cellulose fibrils, which are interrupted by dislocations and/or areas of amorphous cellulose. The sheath surrounding the microfibrils consists of hemicellulose and lignin. Hemicellulose is composed of chains of 5- and 6-carbon sugars that contribute to soluble sugar production, while lignin is a polymer built up from aromatic alcohols that can hinder the production of fermentable sugars. 3,4 Due to its abundance, the most promising candidate for conversion into biofuels and other sustainable bioproducts is cellulose, a macromolecular polymer of β(1→4) bonded D-glucose. It has a polymorphic crystalline structure in which linear glucan chains associate via hydrogen bonding to form microfibrils. Seven main allomorphs of cellulose are known today (Iα, Iβ, II, IIII, IIIII, IVI, IVII). 5 This crystalline nature of cellulose and the lignin sheath around the microfibrils make the structure insoluble and difficult to access by enzymes or chemicals.
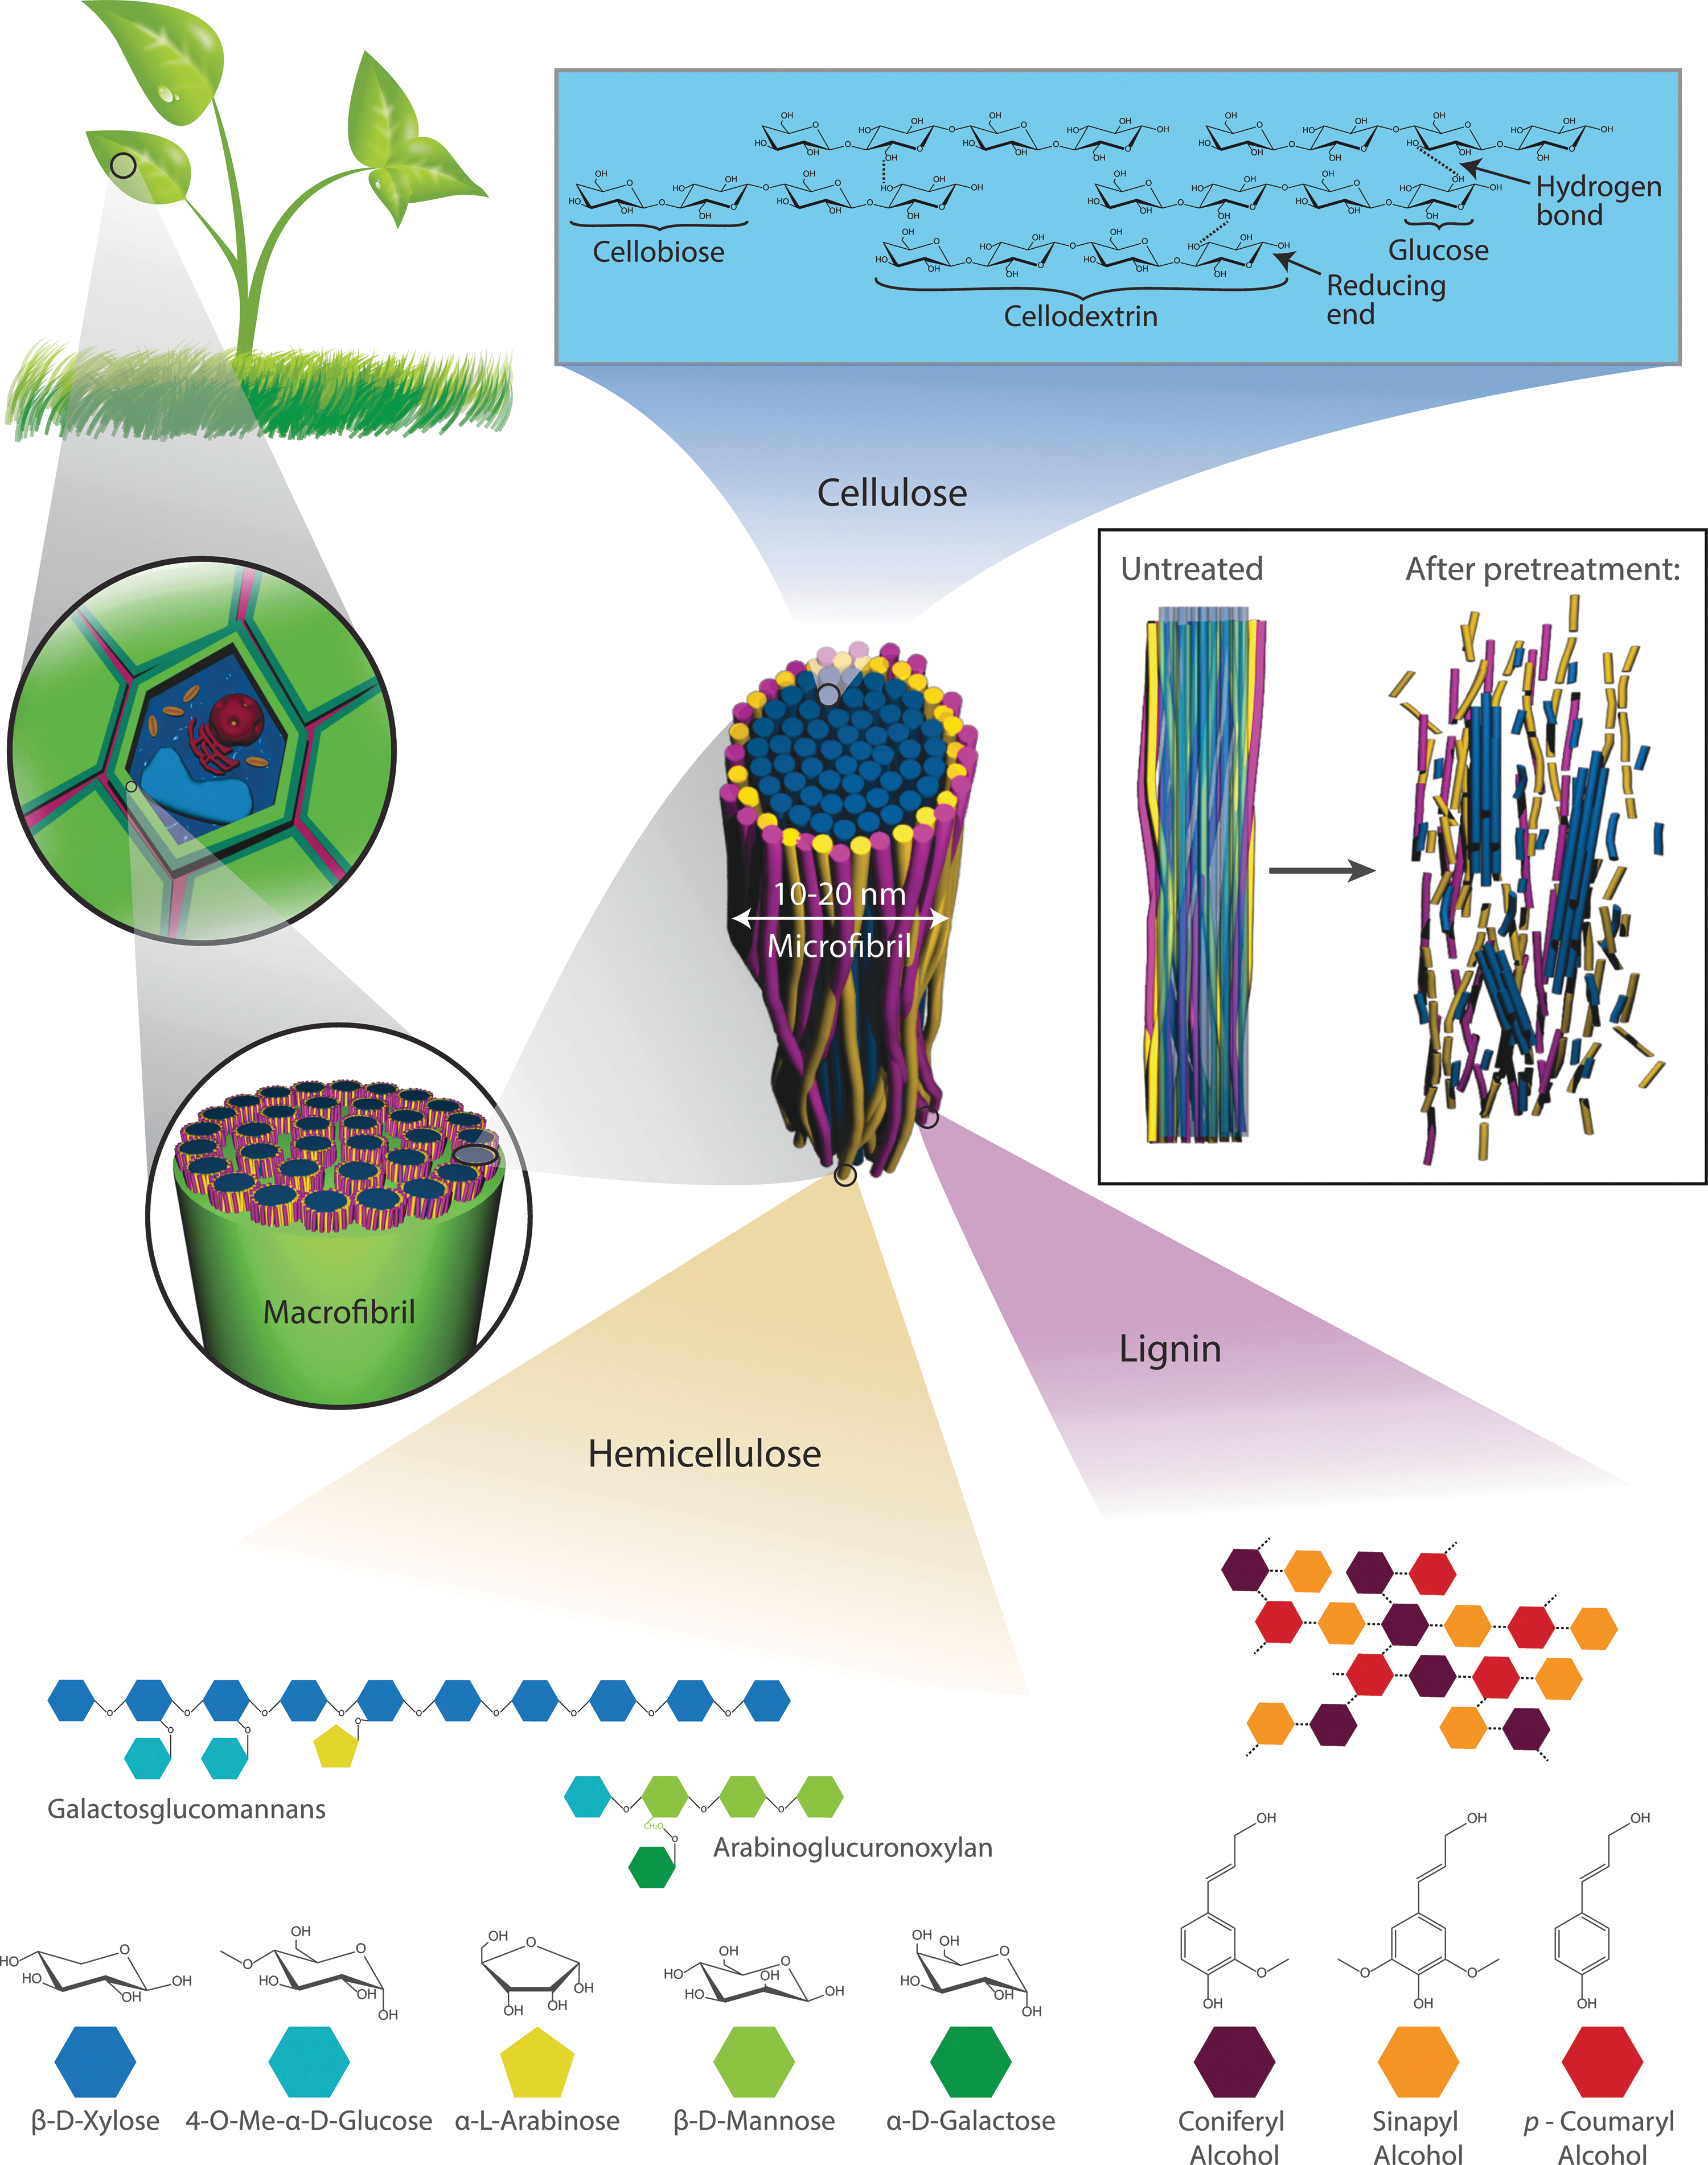
Lignocellulosic biomass is composed of cellulose, hemicellulose, and lignin. Cellulose forms the crystalline core of microfibrils, while lignin and hemicellulose, polymers made up of 5- and 6-carbon sugars, surround the microfibrils and interconnect them via hydrogen bonds to form macrofibrils. Pretreatment breaks hydrogen and glycosidic bonds to enlarge the accessible area.
Due to the tightly packed nature of lignocellulosic components, biomass has to undergo pretreatment before effective hydrolysis can occur. Pretreatment methods can be physical (mostly application of heat and pressure) or chemical (exposure to acid or alkaline solutions). While some are intended for lignin or hemicellulose removal, all methods increase the accessible surface area by altering the lignin structure, breaking the hydrogen bonds between lignin, hemicelluloses, and cellulose and creating porous cavities within the remaining structures (Fig. 1). In one approach, pretreatment transforms the crystalline cellulose into amorphous structures and soluble sugars for the production of biofuels and bioproducts. In another, the pretreatment and partial hydrolysis of crystalline material can lead to the production of structural nanomaterials, such as cellulose nanocrystals (CNCs), cellulose nanospheres, or microfibrilated cellulose, which are important components of sustainable biocomposites. 6 A variety of pretreatments and their effect on lignocellulose are summarized in Table 1. 7
Physical and Chemical Pretreatment Methods and their Effects on the Structure of Lignocellulosic Biomass a
Reproduced from Mosier N. Features of promising technologies for pretreatment of lignocellulosic biomass. Bioresour Technol 2005;96:673–686.
■: major effect;  : minor effect; □: no effect; ND: not determined.
A crucial process for the efficient conversion of biomass is the depolymerization of cellulose, which proves to be a challenge due to the insolubility of cellulose in water and the high crystallinity of the cellulose microfibers. One direct approach is to break the glycosidic bonds with the help of concentrated strong acids at high temperature and pressure. 8 The downside to this method is the formation of toxic byproducts, which might remain in the carbohydrate products and affect the fermenting yeast or bacteria. A second, preferred approach is the production of soluble sugars through enzymatic hydrolysis, which has been comprehensively reviewed by Kumar et al. 9 With these soluble sugars, both conversion to alcohols by yeast or synthesis of hydrocarbons through genetically altered microorganisms are possible.
Different types of enzymes can catalyze the hydrolysis of cellulosic material: exocellulases; processive enzymes that hydrolyze the cellulose chains from either the reducing or the non-reducing end; and endocellulases, which cleave β(1→4) bonds randomly along the cellulose chain. 10,11 A schematic of the hydrolysis process for an exocellulase is shown in Fig. 2. 12,13 Knowledge of the fundamental workings of these enzymes and changes in the cellulose structure at nanoscale are required to understand biomass conversion and design more efficient saccharification methods that can be scaled to industrial settings. This insight can most effectively be gained by direct observation of the process of cellulose hydrolysis and cellulase action at the nanoscale. Single-molecule (SM) imaging methods provide the means required to perform such observations in real time, with single or multiple enzyme components, and under environmental conditions that are relevant for industrial processes.

SM Methods
SM methods aim to ascertain the position, motion, and activity of single particles, and to follow these over time. The resulting SM tracks provide detailed information on the binding and diffusive and catalytic behavior of individual molecules and can provide evidence of heterogeneous or rare subpopulations that would otherwise be averaged and obscured by ensemble measurements. Depending on the imaging method, SM visualization can be done indirectly by imaging the emissions from fluorescently labeled molecules attached to the particles of interest (i.e., SM fluorescence microscopy) or directly by observing the topography presented by the molecules of interest (i.e., high-speed atomic force microscopy [HS-AFM]).
Fluorescence Microscopy
In most cases of SM fluorescence microscopy the molecules to be tracked (e.g., cellulose or cellulose-associated enzymes) are non-fluorescent and have to be made visible by labeling them with fluorescent dyes. The type of fluorescent dye (e.g., organic, fluorescent protein, quantum dot) and labeling method have to be carefully chosen to ensure that the activity and diffusive properties of the molecules remain unchanged. 12,13 Microscopes used for SM fluorescence microscopy, regardless of the technique, are set up in a similar fashion, encompassing an illumination source, excitation and emission filters, an objective, a sample stage, and a highly sensitive detector. 14
The simplest and most widely used tool is the epifluorescence microscope. In epifluorescence, the microscope illuminates a large sample volume, typically on the order of hundreds of micrometers in the transverse direction and tens of micrometers in the axial dimension. In this configuration, a thick portion of the sample is illuminated, and fluorescence from all regions (in- and out-of-focus) is collected simultaneously by an objective. Then, a high-sensitivity detector (either an electron multiplication charge-coupled device or a complementary metal-oxide semiconductor camera) images the emitted fluorescence. This setup offers temporal resolutions down to microseconds, but is limited spatially by the camera pixel size and the Rayleigh criterion, which states that in order for two emission sources to be distinguishable from each other their separation must be greater than ∼λ/2NA, where λ is the wavelength of the emitted light and NA is the numerical aperture of the objective (a parameter estimating its collection efficiency). Despite this limitation, epifluorescence microscopy is still widely used due to its versatility and simplicity. 15,16 Apart from limited resolution, a key issue with epifluorescence is the fast photobleaching of the sample due to the large illumination volume.
In confocal scanning microscopy, both problems with resolution and photobleaching are addressed by tightly focusing the excitation light and illuminating a small diffraction-limited volume in the sample. The fluorescence emitted from the illuminated volume is collected through the objective and focused through a pinhole aperture that rejects light emitted from out-of-focus planes. Finally, an avalanche photodiode or a photomultiplier tube collects the in-focus fluorescence and converts it into an intensity signal. The combination of the small illumination volume of the diffraction-limited spot and the pinhole aperture significantly enhances the contrast in the SM images, also referred to as signal-to-noise ratio (SNR). By scanning the illumination volume over the sample and recording the signal for each position, a two- or three-dimensional fluorescence image is reconstructed. Additional advantages of this method are high axial and transverse resolution, while the principal downside is a temporal resolution limited to the second to minute regime. 17
A different approach to reduce the size of the illumination volume and thereby limit the background noise is total internal reflection fluorescence (TIRF) microscopy. The goal of this configuration is to excite the sample fluorophores with an evanescent light wave that arises as laser light hits the glass/water (sample) interface at incidence angles above the critical angle. Super-critical angle incidence can be achieved in two ways: through an external prism (prism-based TIRF), or through the objective (objective-based TIRF). 18,19 TIRF produces a wide but very shallow (50–200-nm) sample illumination and therefore results in less signal from out-of-focus objects (higher SNR) and higher axial resolution. 20 The temporal resolution remains in the range of milli- to microseconds. TIRF's main limitation is the ability to image only thin slices of the sample located at the glass/sample interface. A further extension of TIRF illumination is defocused orientation and position imaging (DOPI), which makes use of the polarized light emitted by the fluorophore. This emission is affected by planar dielectric substrates, such as cellulose nanocrystals, and produces an asymmetric emission profile when imaged slightly out of focus. Böhmer et al. published a comprehensive review of DOPI. 21
Due to its advantages (i.e., high SNR and temporal resolution), TIRF has become the preferred mode of illumination for SM experimentation. In SM fluorescence microscopy data analysis, each particle in the image has to be detected and localized. To do this, the images undergo thresholding to reduce background and possible false detection. A theoretical point-spread function (PSF) is fitted to the emission profile of each identified particle, and the location of their intensity maxima is recorded with sub-pixel precision (∼10 nm). In practice, the theoretical PSF can be approximated by a two-dimensional Gaussian. Using as many sequential images as can be captured in the experiment, the position of each particle can then be linked. This step poses a problem of high complexity, especially for high-density emission sources. 22 Over the last 20 years, computing power and tracking algorithms have greatly improved. Cheezum et al. previously provided an overview of different approaches, and Sibarita presented a review summarizing recent developments. 23,24 Having obtained the tracks of each particle, the dynamic properties can be determined through mean-square displacement analysis or by studying their displacement probability distribution function. 25,26 Transport phenomena such as heterogeneous motion can be characterized using these methods.
SM fluorescence microscopy makes it possible to probe molecular movement in detail under sparse emitter conditions. However, this method encounters diffraction limitations when imaging samples that contain a high density of emitters. In recent years, a series of techniques have emerged designed to yield images with resolutions below the diffraction limit. These techniques, collectively known as super-resolution microscopy or nanoscopy, have revolutionized the way that biological systems can be studied at nanoscale, and the impact has been so great that pioneers in the field were recently awarded the Nobel Prize for chemistry. The techniques developed to produce super-resolution images can be divided into those that condition the illumination profile and those that condition the emission from fluorescent molecules. Stimulated emission-depletion (STED) and saturated structured illumination microscopy (SSIM) are both methods that condition the illumination profile of the incident light. In STED, the monochromatic excitation beam is accompanied by a second beam that depletes the excited fluorophore population in a doughnut-shaped area around the excitation volume. This reduces the size of the excitation volume, effectively improving the lateral resolution of the microscope. 27 SSIM makes use of the non-linear dependency of fluorescence on the excitation intensity. Moiré patterns can be observed with an intensity-modulated laser beam, and these patterns can be converted to spatial information through computational methods, improving the spatial resolution by 5–10 fold. 28 On the other hand, photo-activated localization microscopy (PALM) and stochastic optical reconstruction microscopy (STORM) are methods that employ the physicochemical properties of fluorophores to condition their emission. 29,30 Using the photoswitching of fluorophores as an advantage and modulating the intensity of the lasers used for primary excitation and pumping, PALM and STORM set most fluorescent molecules within a sample to a non-emissive or “dark” state, creating an image of sparse emitters. Over a period of time, a large number of images of the same structure are taken with only few fluorescent sources randomly switching on and emitting in each frame. These individual molecules can then be localized with the help of SM detection and localization algorithms with resolutions of less than 20 nm (Fig. 3). 14 The super-resolution images are reconstructed by additively plotting the positions of all the localized emitters to reveal the underlying structural details of the sample.
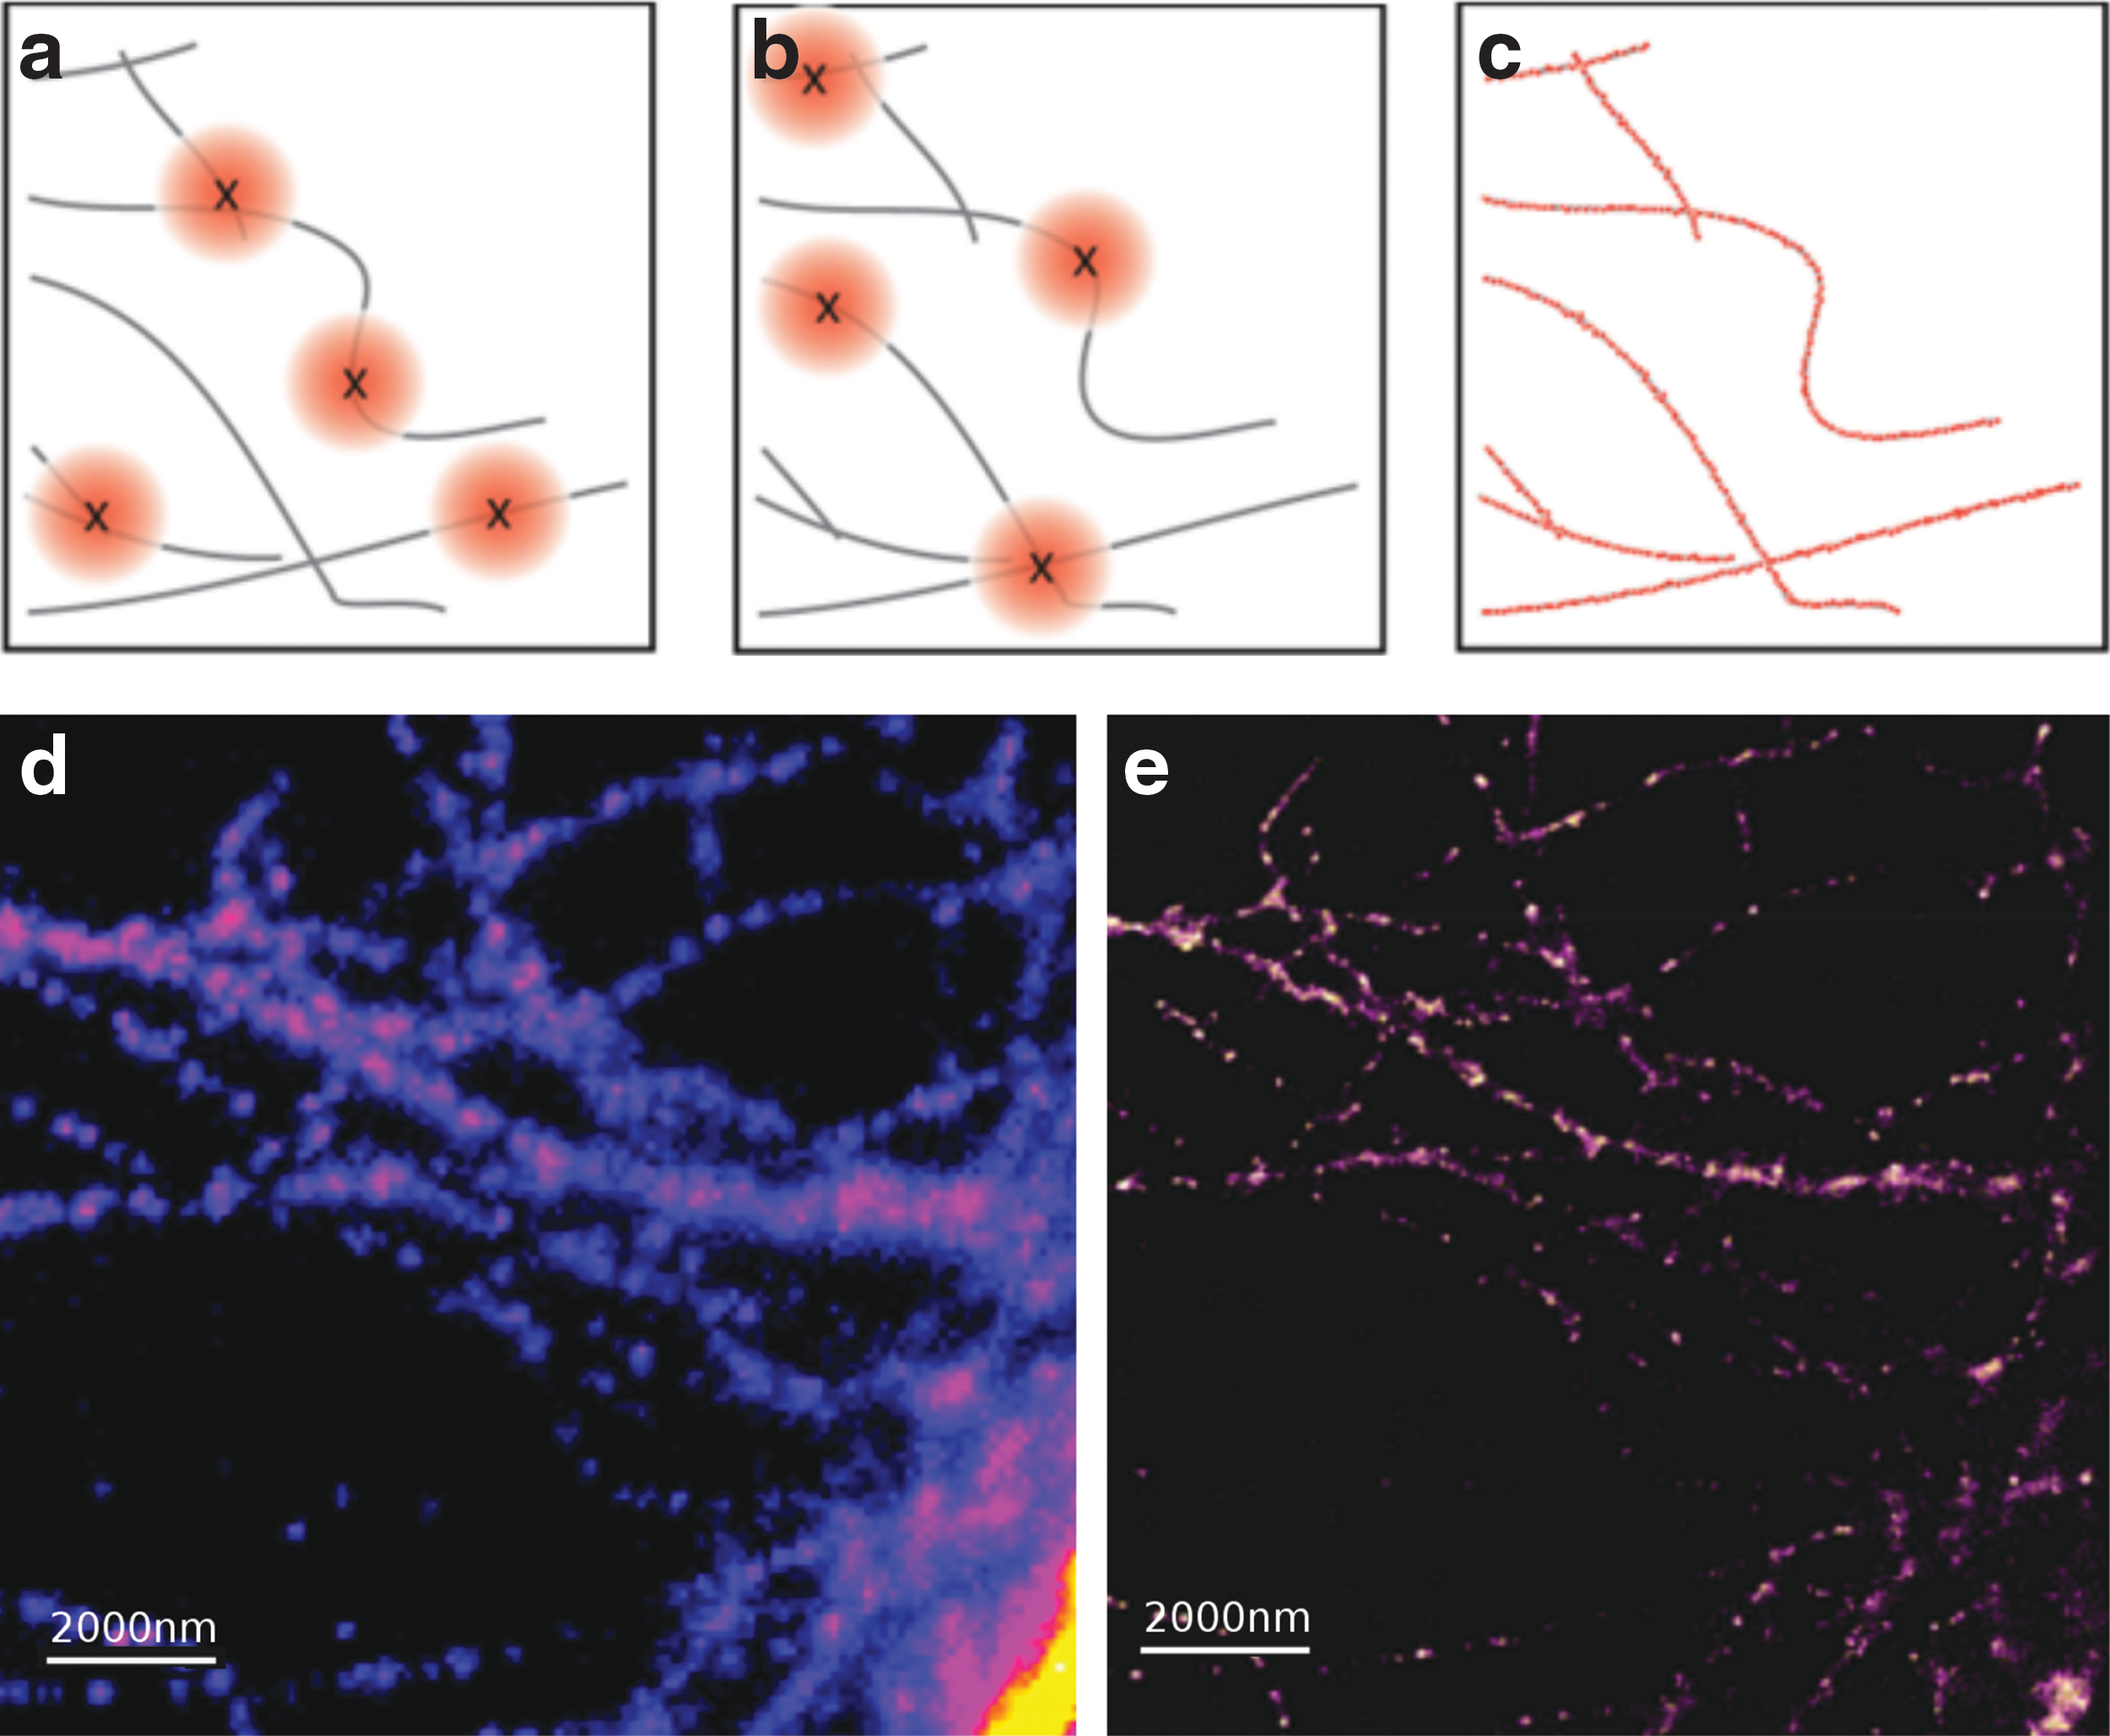
Principle of super-resolution fluorescence microscopy on a labeled cellulose structure.
Atomic Force Microscopy
The atomic force microscope has also played a crucial role in the advances of SM microscopy. Atomic force microscopy (AFM) reports on surface topography by scanning a cantilever with an ultra-fine tip (∼10 nm radius) across the surface of the sample and sensing the attractive or repulsive forces between the tip and the surface. 31 To record the cantilever deflection, a laser beam is reflected off the back of the cantilever onto a sectioned photodiode. Deformation of the cantilever results in a change in signal, which is recorded for every position on the sample. This can be done in contact mode, where the amplitude of deflection corresponds to the applied force on the tip, or in non-contact or tapping mode, where the tip oscillates above the sample. In tapping mode, both the frequency and amplitude serve as signal and correspond to the distance from the sample surface and its viscoelastic characteristics. During scanning, the tip is often held at a constant distance from the sample by means of a feedback loop, and the displacement of the piezoelectric stage in vertical direction is recorded. The tip geometry biases the sample topology in the acquired images, but this can be corrected through image reconstruction. 32 Even though the tip sizes are one to two orders or magnitude larger than the molecules of interest, this technique has very high axial (down to 0.1 nm) and lateral (down to 0.5 nm) resolutions. 30 In the past, AFM was poorly suited to observe enzymatic dynamics because image acquisition took up to several minutes. This changed in 2001 when Ando et al. introduced an AFM setup featuring cantilevers with high-resonance frequencies and low spring constants that could image one frame in 80 ms in aqueous solution. 33 At present, HS-AFM is not only a precise structural analysis tool, but it can also be used to observe the dynamics of enzymes with resolutions below optical methods (including super-resolution methods). 26,34 Because of its ability to measure forces in the nano-Newton scale, the method has already played a large role in understanding protein folding kinetics, enzyme activity, and DNA structure. 35 Despite the tremendous improvements over the last decade, HS-AFM is still limited in the acquisition area by the scanning time required to acquire one frame and in the density of molecules that can be present on the sample. Additionally, because measurement entails mechanical interaction of the AFM tip with the sample, it is unclear whether experimental results are biased by the tip.
Applying SM Methods to Study Cellulose
On a molecular level, the enzymatic hydrolysis of cellulose and the evolution of cellulosic structures are far from understood. Although it is still a young field, SM tracking and super-resolution imaging techniques have already contributed to our understanding of biomass saccharification in important ways. The optimization of cellulolytic cocktails requires the in-depth understanding of the fundamental mechanisms underlying cellulose hydrolysis. To date, most of the research involving SM techniques has focused on the molecular binding and motion of cellulases on crystalline cellulose surfaces, such as cellulose Iα or IIII. These movements can now be observed directly, thereby avoiding the averaging effects of ensemble measurements. This means it is possible to visualize the different states the enzymes assume when in contact with the cellulosic substrate.
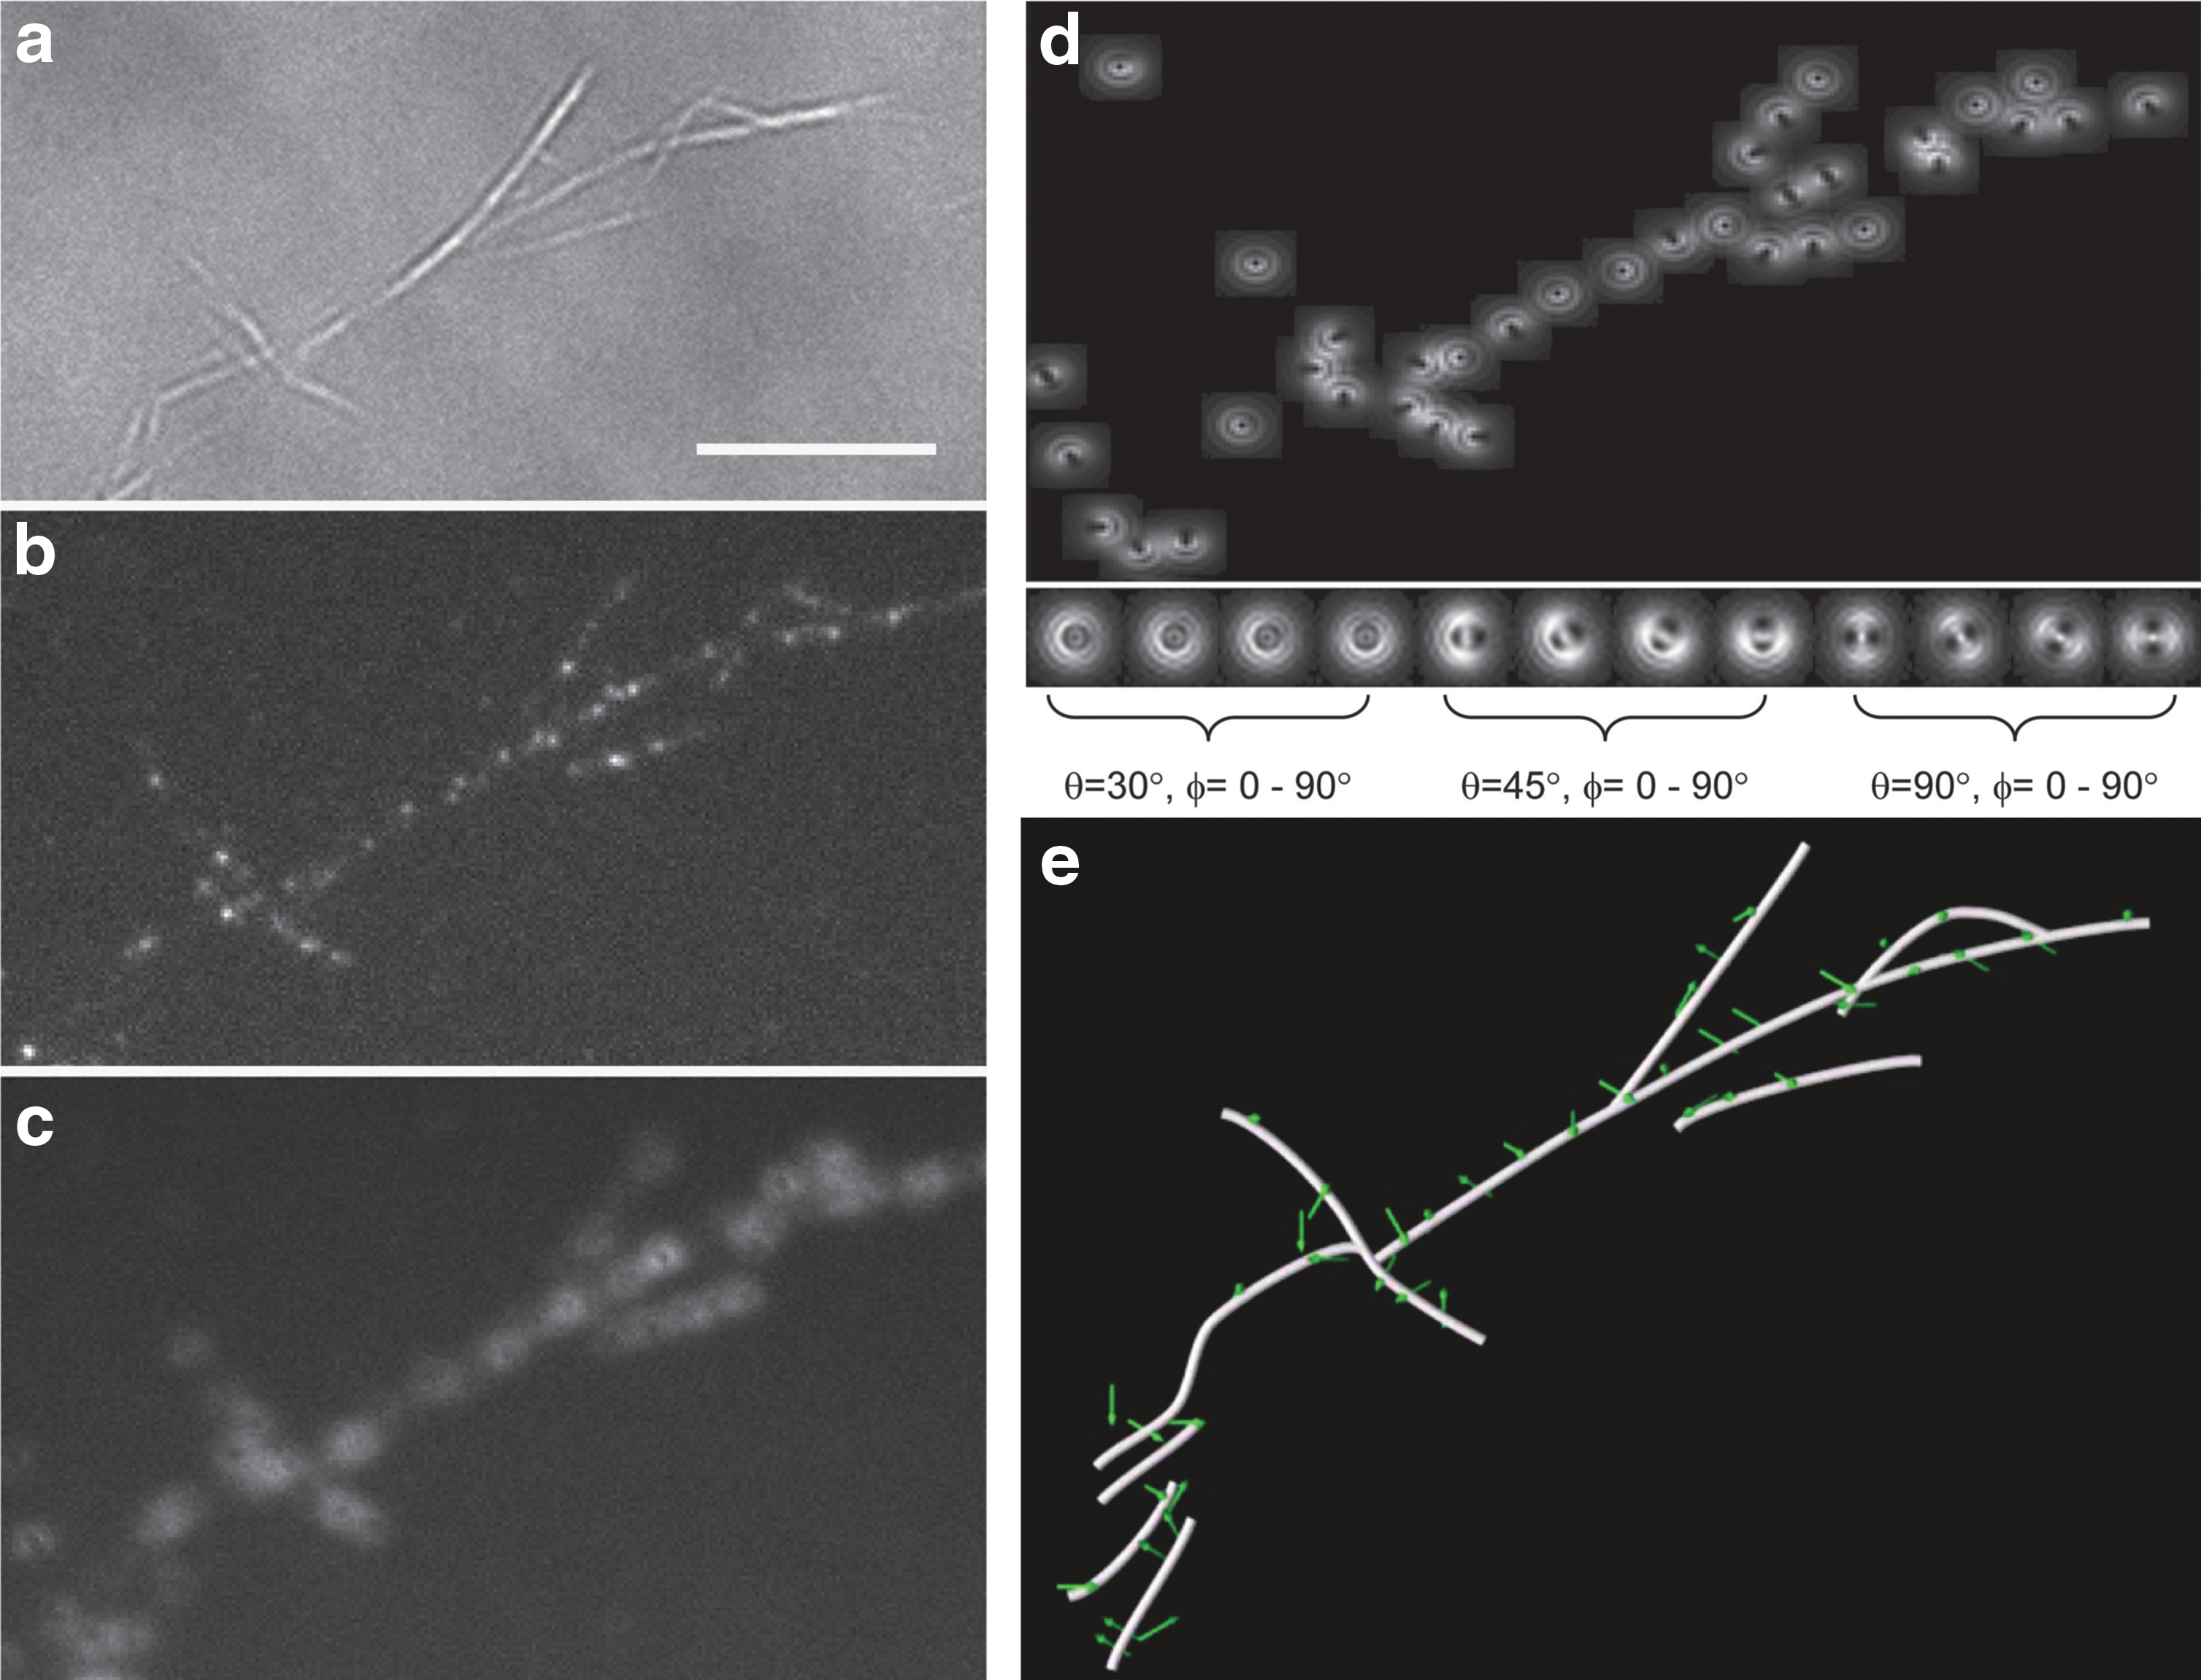
Dagel et al. analyzed the binding orientation and nearest neighbor spacing of binding sites for genetically engineered Clostridium thermocellum CBH3, a family 3 cellobiohydrolase. 36,37 After green fluorescent protein (GFP) tagging and binding to Valonia cellulose nanocrystals, CBH3 molecules were imaged using the DOPI method to determine their orientation. First, in-focus locations of individual CBH3 molecules were obtained by SM imaging, and white-light imaging was performed to colocalize them with the cellulose microfibrils. Comparing the defocused images to theoretical models and combining them with the in-focus images, the three-dimensional orientations of the CtCBH3-GFP were obtained (Fig. 4). 33 A systematic cross-orientation of ≈70° relative to the cellulose crystal basis was observed. The CBH3 molecules showed a preferred binding opposite to the 〈110〉 faces of the Valonia nanocrystals. Using an mCherry dye capable of photo-activation, the relative location of the binding sites of CtCBH3 was also determined with the super-resolution method PALM; the nearest neighbor binding sites had a minimum spacing of ∼20 nm along and perpendicular to the fiber axis. The findings of this in situ study are consistent with previous results from transmission electron microscopy experiments conducted by Xu et al. 38 These SM imaging experiments demonstrated that CtCBH3 enzymes display a preference for binding orientation and show a tendency for a minimal separation distance.
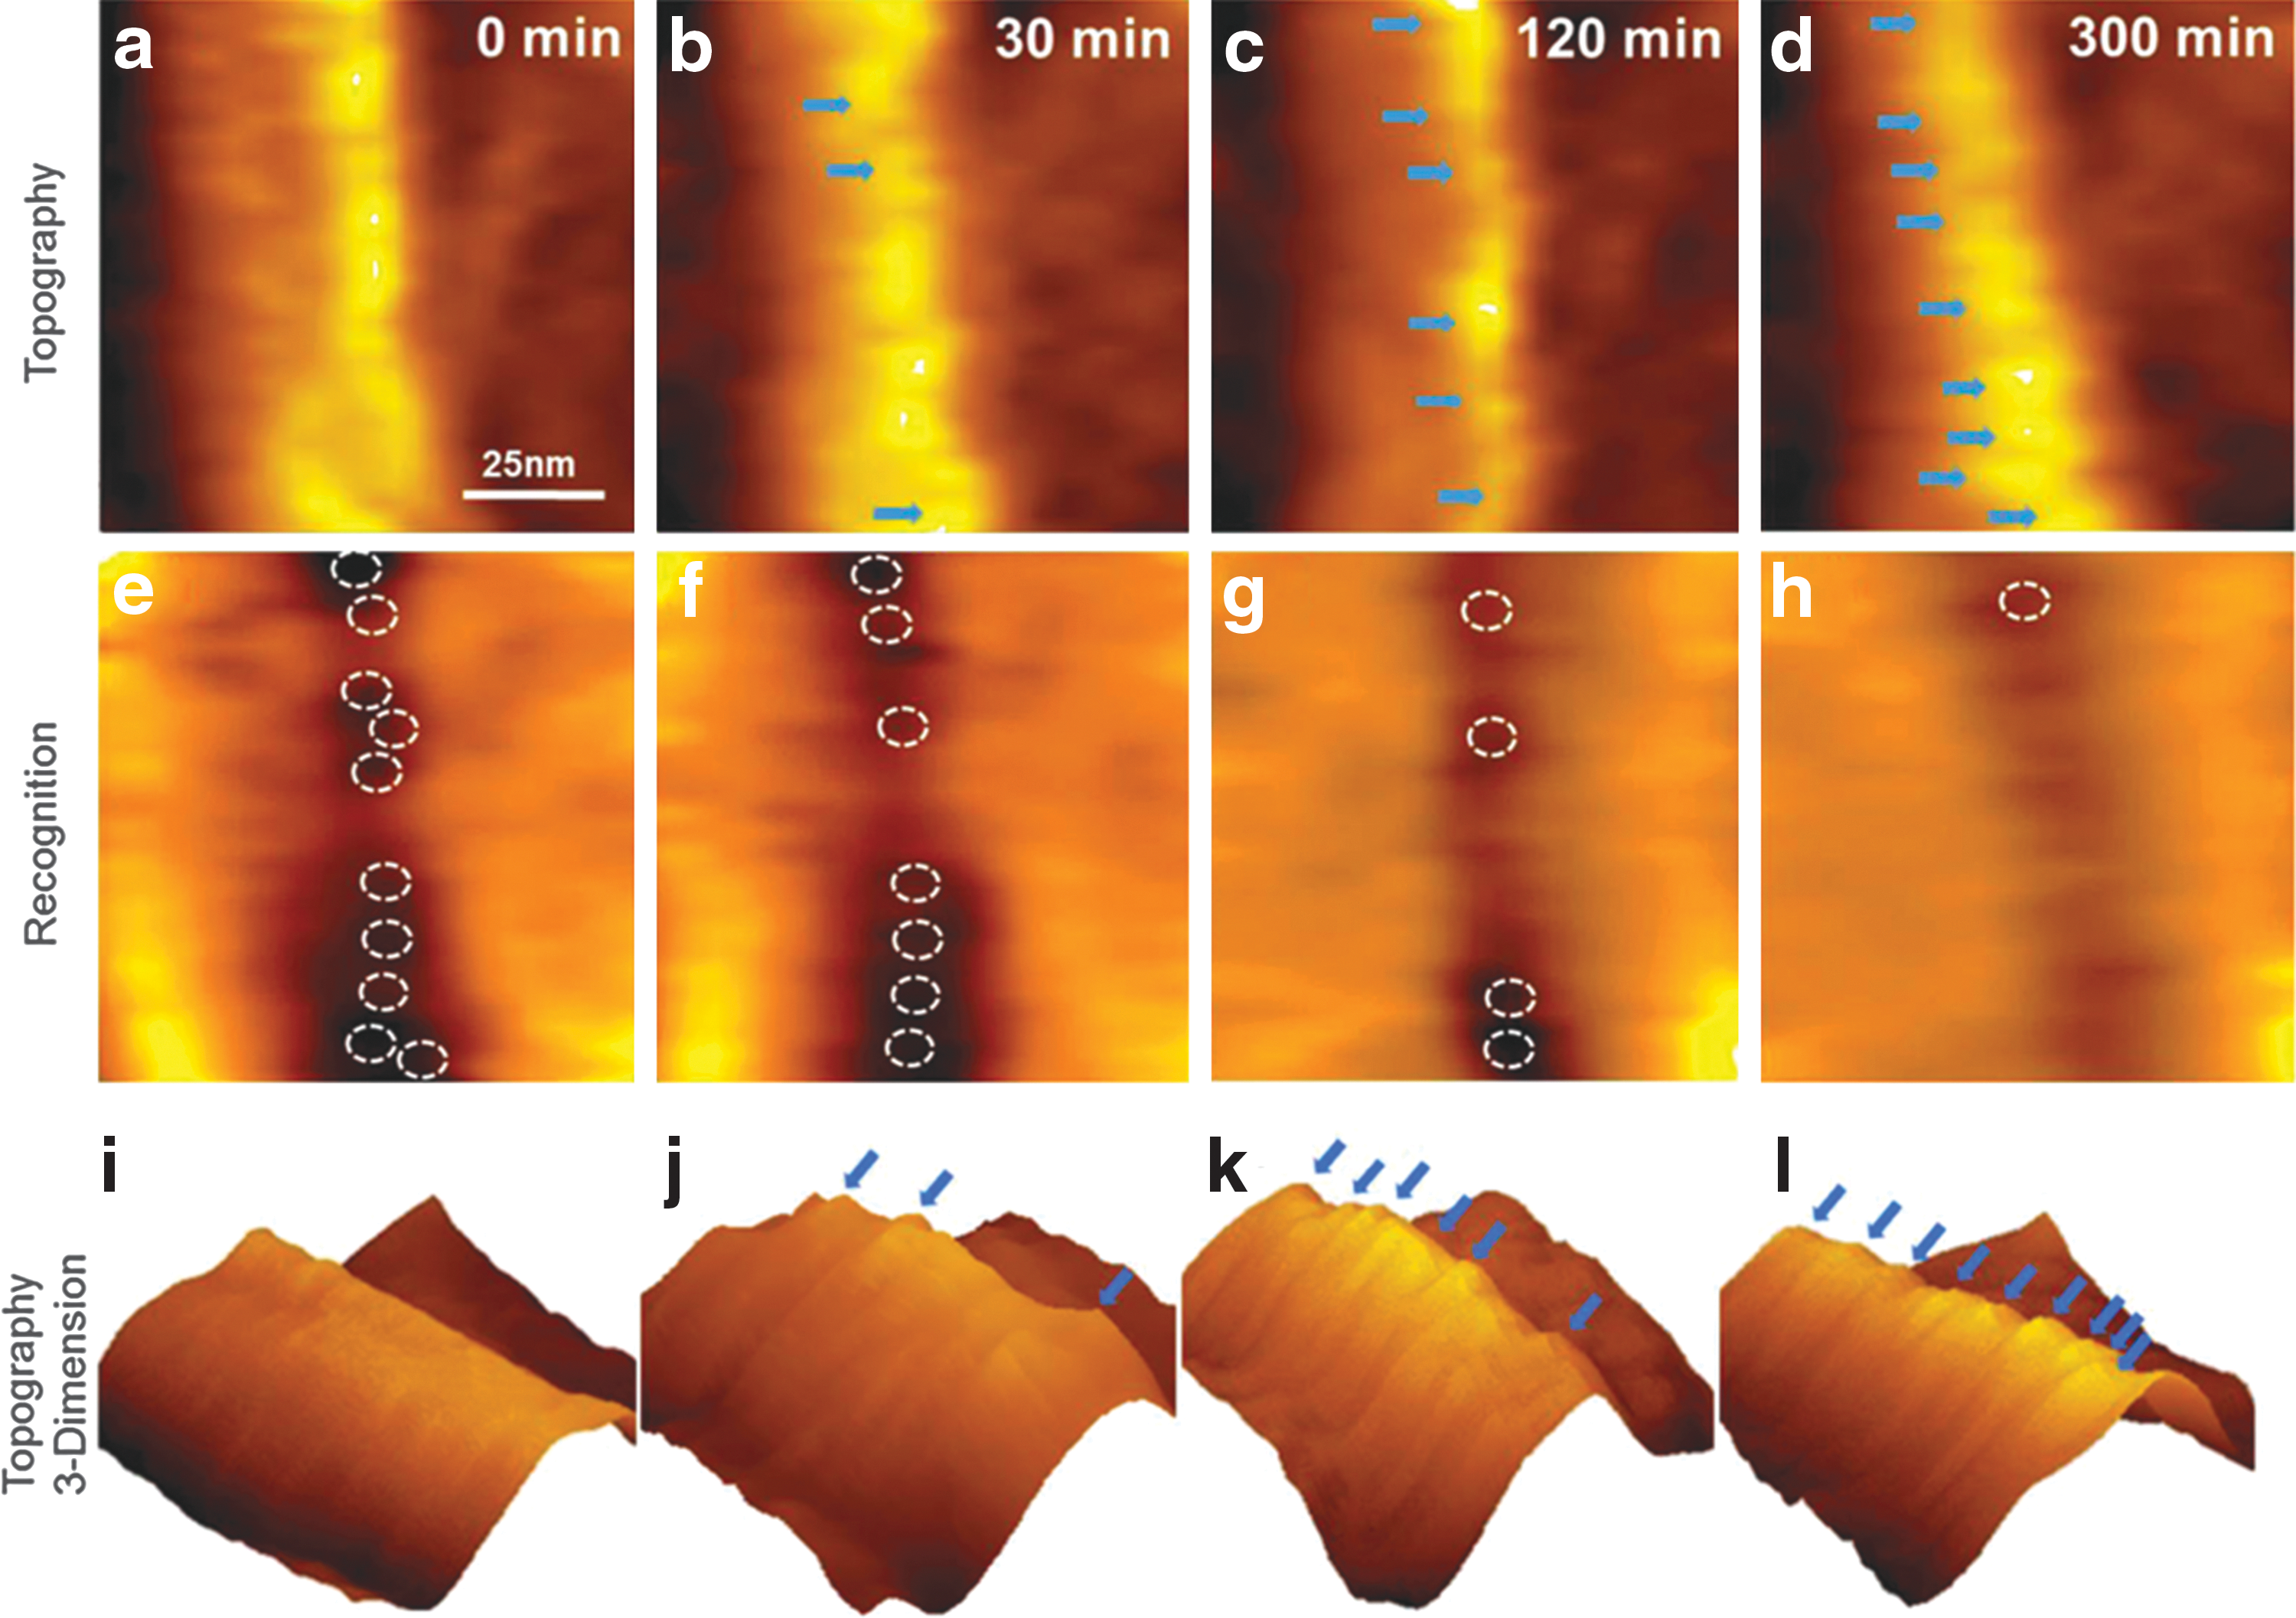
Zhang et al., in 2014, also reported a minimum spacing of binding sites for the carbohydrate binding module CBM3a from C. thermocellum. 39,40 Making use of the high resolution of AFM, binding onto crystalline cellulose fibers was monitored over 3–8 h by a combination of topography AFM and binding-site recognition, which was done by functionalizing the AFM tip to bind to free sites. After taking images without enzymes, potential binding sites were located through calculation. 39 In concentrations up to 3.38 μM, the enzymes bound to the surface until saturation occurred. Figure 5 shows the appearance of bound enzymes and the coinciding disappearance of the calculated binding sites. 40 The enzymes appeared to bind in a regular fashion onto the crystalline fibrils with spacings of 5–10 nm. This confirms that CtCBH3 sites tend to have a minimum separation when binding to cellulose.
Moran-Mirabal et al. conducted a thorough investigation of the dynamic behavior of Thermobifida fusca Cel5A (endoglucanase), Cel6B (non-reducing-end-directed exocellulase), and Cel9A (processive endoglucanase). 41 Each enzyme was labeled through a solid-phase labeling process with either the organic dye AF488 or AF647. 12 Bacterial microcrystalline cellulose labeled with 5-(4,6-dichlorotriazinyl)-amino fluorescein (DTAF) was used as the cellulose substrate. For better photostability, a reducing and oxidizing buffer was used during imaging. 42 The cellulase behavior was observed in two experimental microscopy setups: fluorescence recovery after photobleaching (FRAP) and TIRF. Each experiment was performed at two temperatures: 23°C (room temperature) and 45°C (close to the optimal temperature for catalytic activity at 50°C). FRAP was used under three sample conditions to determine the binding and diffusion dynamics of the cellulase on cellulose microfibrils and mats. First images were acquired with an excess of enzymes in solution. After photobleaching, quick fluorescence recovery was observed, which was attributed to the unbinding and rebinding of cellulases. After the unbound enzymes were washed away and the FRAP experiments repeated, the recovery was significantly reduced, as expected since enzyme exchange with solution was no longer possible. However, slight recovery was observed after the full photobleaching of isolated fibrils, which led to the conclusion that binding is highly reversible. Constant buffer flow was applied to eliminate the effect of unbinding and rebinding. Under these conditions, no recovery could be observed for partly and fully photobleached isolated fibrils. These results point to limited surface diffusion once an enzyme is in a bound state.
For direct visualization and to assess the diffusive behavior of cellulases, SM TIRF imaging of dilute Cel5A, Cel6B, and Cel9A bound to cellulose microfibrils was performed. Through fitting and tracking algorithms, localization resolutions of 14–23 nm at 23°C and 25–33 nm at 45°C were achieved. At 23°C, the percentage of immobile particles was 63% for Cel5A and 88% for both Cel6B and Cel9A. Not much change was observed at 45°C for Cel6B and Cel9A (75% and 73%, respectively), but with Cel5A, the amount of immobile enzymes decreased to 39%. Looking at the individual tracks, Cel5A and Cel9A both showed three distinct states: fast hopping, slow sliding due to surface diffusion, and immobility. In contrast, Cel6B did not display sliding on the surface. Some sample tracks of mobile enzymes can be seen in Fig. 6. Combining the results from FRAP and TIRF experiments, it was concluded that T. fusca cellulases exhibit limited surface diffusion. A model was presented in which three distinct states of the enzymes are possible: strongly bound via carbohydrate binding module (CBM), sometimes with engaged catalytic domain (CD); loosely bound via either CBM or CD; and unbound. Processive catalytic motion could not be observed in these experiments because the localization uncertainty was larger than the processive step size (one cellobiose unit equals ∼1 nm).
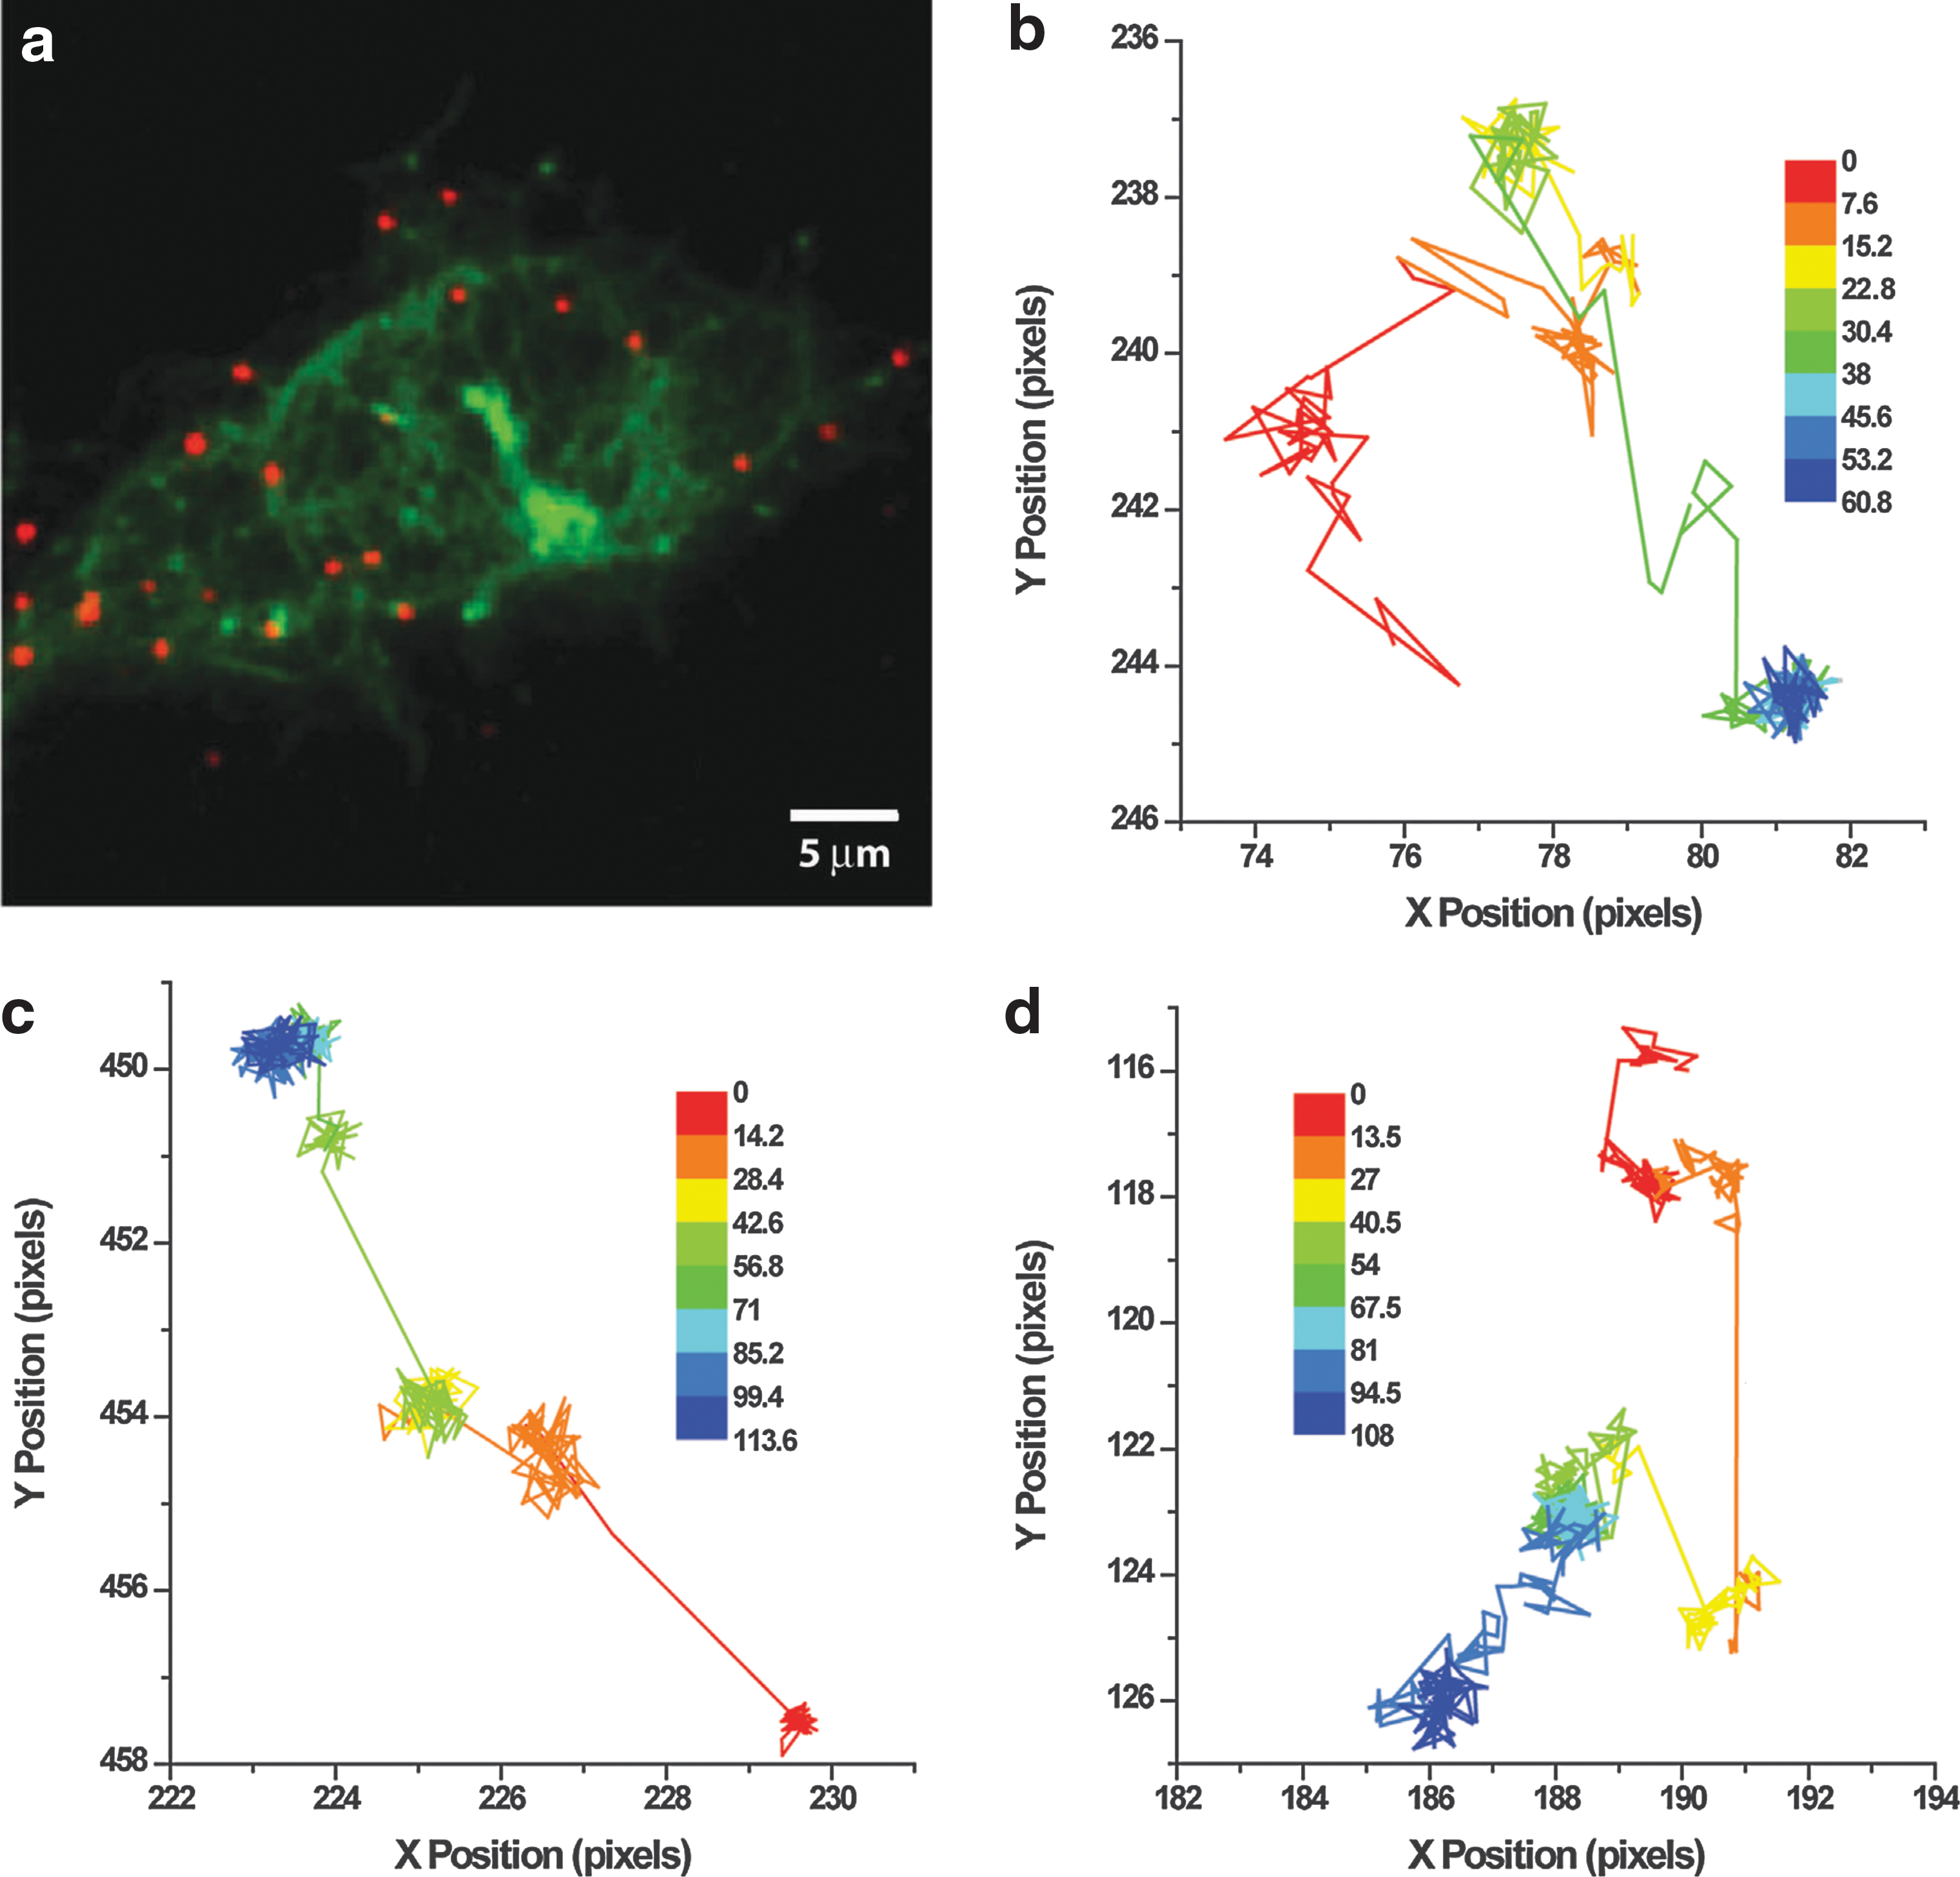
Similarly, Jung et al. used prism-based TIRF to study the behavior of Cy5-labeled Trichoderma reseii Cel7A (reducing-end-directed exocellulase) on DTAF-labeled cellulose fibrils. 43,44 Laser-excitation sources with wavelengths 488 nm and 633 nm allowed the simultaneous imaging of both the cellulose substrate and the cellulolytic enzymes. Imaging was done at room temperature, yielding a resolution of 15 nm. Although no distinct binding sites on the cellulose were expected, seemingly random areas showed extensive binding, while others displayed little to none. Concerning the dynamics of the enzymes, over 90% of the bound cellulase remained stationary within the experimental resolution. Only about 5% displayed a rapid sliding motion between stationary intervals, which was described as a stop-and-go motion similar to the hopping behavior previously observed by Moran-Mirabal et al. 41 The velocities measured varied between 80–350 nm/s, which would suggest that the enzymes observed moved along the cellulose surface without catalysis. Whether or not a small number of enzymatic turnovers happen in the bound state could not be answered, since one turnover event is below the resolution of SM localization and tracking.
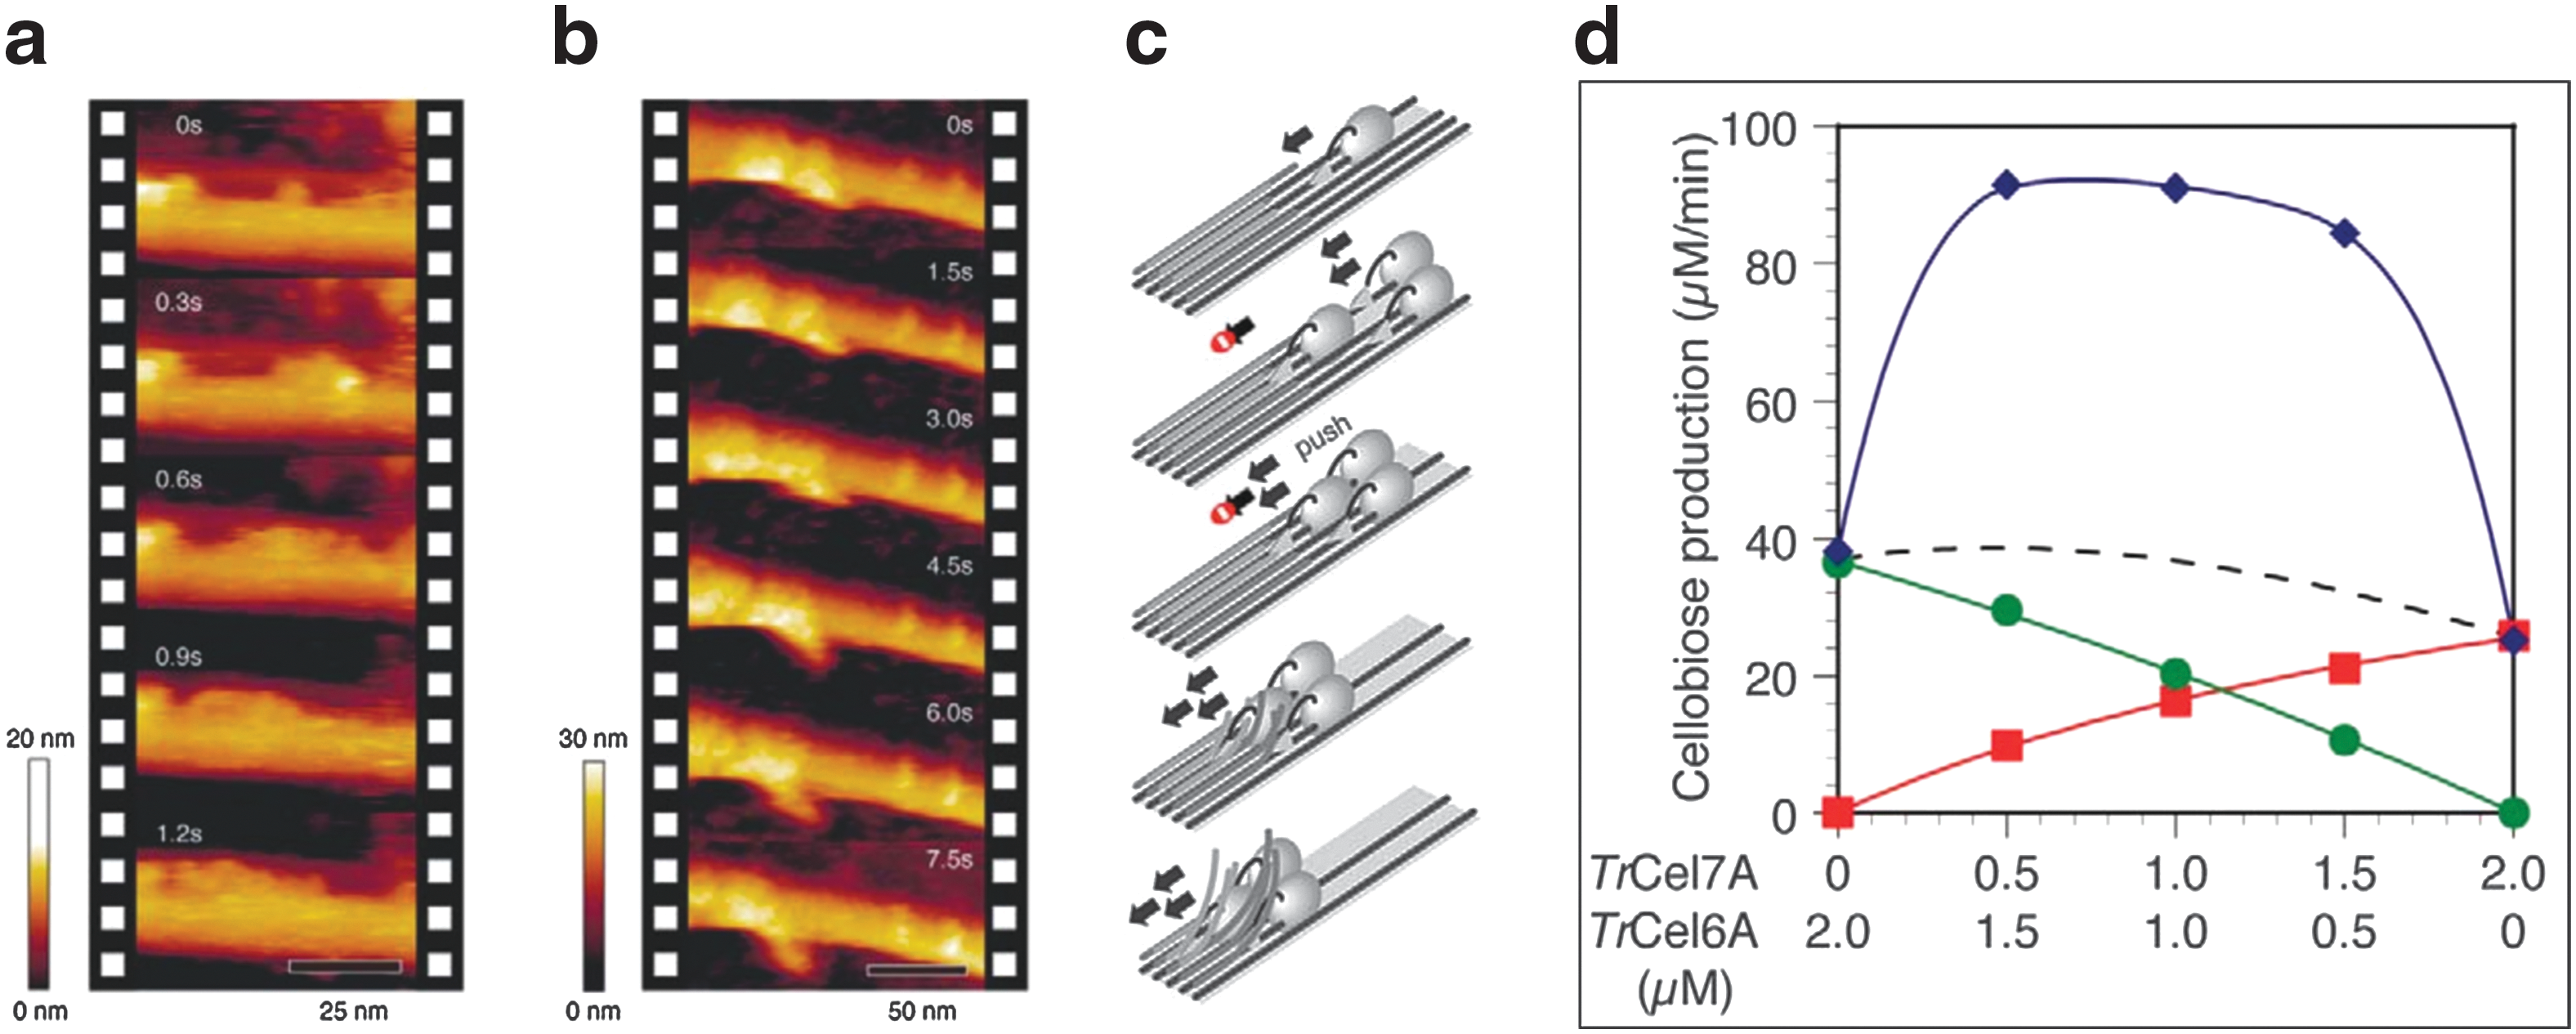
In 2009, Igarashi et al. were able for the first time to monitor directly the processive movement of T. reseii Cel7A with the help of HS-AFM. 34 At concentrations of 2–20 μM, they observed an average velocity of 3.5±1.1 nm/s. They refined this finding in 2011 after seeing a stop-and-go motion with speeds of up to 7.1±3.9 nm/s. 45 They also observed molecular congestion of TrCel7A enzymes, slowing the motion down to a halt. This traffic-jam-like behavior can be observed in Fig. 7a–c. 45 When using a controlled mixture of TrCel6A (non-reducing-end-directed exocellulase) and TrCel7A, a synergistic effect seemed to take place as seen in Fig. 7d. 45 These effects of enzymatic interactions are not yet understood and will require well-designed experiments with higher statistical value, but Igarashi et al. were able to demonstrate a behavior of cellulase that had not yet been observed.
By combining HS-AFM and TIRF, Shibafuji et al. recently showed a concentration dependence of SM Cy3-TrCel7A hydrolysis on cellulose Iα and IIII substrates. 46 The observations were done at 5 frames/s for 120–160 s. Previously, cellulose Iα and IIII had been reported to have large differences in hydrolysis efficiency. 47 Here the results displayed high dependence on enzyme concentration, where at low concentration the susceptibility to hydrolysis was similar on both substrates. A model was proposed where at low concentrations binding sites for enzymes were available in abundance both on cellulose Iα and IIII. At higher concentration, the binding sites on the hydrophobic 〈110〉 surfaces of Iα were fewer compared to the hydrophobic 〈110〉 and moderately hydrophobic 〈100〉 surfaces of cellulose IIII resulting in better hydrolysis of IIII and “traffic jams” on Iα, as previously reported. 45
Conclusions
Recent improvements in high-resolution imaging techniques and the pioneering work using them to study cellulase-cellulose interactions at the single-molecule level have laid the foundation for a detailed analysis of the nanoscale behavior of cellulolytic enzymes. In this way, SM fluorescence and HS-AFM imaging have started to unravel the fundamental mechanisms of the enzymatic hydrolysis of biomass. While these SM methods provide the means required for investigating fundamental molecular mechanisms, they have often led to additional unanswered questions, such as the effect of synergism, cellulose allomorph, and crystalline cellulose accessibility on binding and hydrolytic activity. We anticipate that the implementation of robust localization and tracking algorithms, super-resolution techniques, and the development of better imaging buffers will lead to increased observation times that yield better statistics on SM tracks, increasing the predictive power of such experiments and revealing the molecular states that the enzymes exist in when bound to cellulose. 22,23,48 Utilizing enzyme types labeled with spectrally distinct fluorophores and imaging on multi-channel setups could then address questions on synergism and binding competition. In addition, the ability to study systems in which the enzyme types and ratios are well determined, and the environmental parameters (e.g., temperature, pH) are carefully controlled with near-molecular resolution, will aid in the development of more efficient cellulolytic cocktails. In conclusion, single-molecule methods have proven to be promising avenues for the study of cellulase-cellulose interactions and cellulose nanostructure, and will certainly contribute to a better understanding of the underlying mechanisms of enzymatic lignocellulose hydrolysis.
Footnotes
Author Disclosure Statement
No competing financial interests exist.