
Abstract
Moist yeast is a byproduct of the ethanol industry with potential applications in the animal feed and food industries. Presently, knowledge of moist yeast's rheological properties is limited, despite it being crucial for the design and optimization of unit operations involved in the processing of this raw material. The work presented here is a study of the rheological behavior of yeast paste at different solid concentrations (0.15, 0.25, 0.35, 0.45, 0.55, and 0.64 g/mL) and temperatures (20, 30, 40, 50, 60, 70, and 80°C) using a concentric-cylinder rheometer. The experimental results were evaluated using four rheological models. The Power Law model was the best fit, demonstrating pseudoplastic behavior in all concentrations studied. In addition, the dependence of the flow behavior index and the flow consistency index of the Power Law model on temperature and solid concentration was also successfully modeled through a quadratic model and an Arrhenius-type equation, respectively.
Introduction
The traditional methods of producing first-generation bioethanol have been based on starch crops like corn and wheat or from sugar crops like sugarcane and sugar beet. The implementation of new technologies has enabled substantial improvements in the industrial production and yield of these first-generation biofuels. 1,2 Brazil is the world leader in the production of sugarcane ethanol with positive growth projections for the coming years, due mainly to growth in domestic consumption. By 2019, Brazil's biofuel production is expected to reach 58.8 billion liters, which is about twice the 30 billion liters of domestic consumption recorded in 2008. 3
During industrial processing, sugarcane is subjected to milling, washing, chopping, shredding, crushing, and extraction of the cane juice. After removal, the syrup goes through evaporation and cooling crystallization, leaving clear crystals. The molasses is separated by centrifugation and submitted to pasteurization and fermentation processes, which normally take 4–12 h. After fermentation, the ethanol is recovered from the broth via distillation. 4,5 The residue from the fermentation process, Saccharomyces cerevisiae moist yeast, has multiple potential uses: to produce biogas, recycled to the field; or used for animal feed. 6,7 Figure 1 shows a schematic representation of the unit operations used to obtain the dry inactive yeast from the moist yeast by fermentation. 8,9 Centrifugation of the moist yeast separates the yeast paste from the clarified wine, which is then distilled. The yeast paste can be subjected to two processes to obtain the dry inactive yeast: 1) about 0.55–0.60 g/mL yeast paste is passed directly through a spray-drying process (Fig. 1a); or 2) the yeast paste is diluted with water, subjected to an alcohol-extraction process, and is then taken out of the process at its same initial concentration.

Process conversion of moist yeast to dry inactive yeast paste.
The processes for obtaining subproducts in the first-generation ethanol industry, as well as the characteristics of the material, differ from one production approach to another, and as of yet, available literature is very limited and experimental results are inconsistent. For example, the mass concentration of the yeast solutions can affect the decanting or settling unit operations. High viscosity also limits the flow, interfering in the design and components of systems such as pipes, pumps, heat exchangers, and evaporators. 10 –13 Therefore, studying the rheological properties of these materials can provide information about hydrodynamic effects, heat, and mass transfer performance in biorefinery equipment, and the kinetics of cell growth and fermentation, making such analysis a prerequisite for industrial design and process optimization. 14 –17 According to Khare and Niranjan, process performance is assessed by measuring the efficiency of liquid flow and, at the same time, is closely linked to mass transfer. 11 Given that liquid dispersion characteristics in high-viscosity liquids are markedly different than in low-viscosity liquids, the data are analyzed in the context of whether or not Newtonian or non-Newtonian fluid behavior exists. 18,19
Based on this overview, it is evident that studies of the rheological behavior of moist yeast or yeast paste from ethanol production are lacking. Thus, the present study aims to investigate the rheological behavior of yeast paste as a function of the mass concentration and temperature, contributing experimental data for use in process control, industrial design, and modeling.
Materials and Methods
Raw Material
S. cerevisiae yeast paste was acquired from the sugarcane ethanol industry in São José do Rio Preto City, Brazil. Samples with a concentration of about 0.70 g/g, alcohol content of 7.21o Gay-Lussac (GL), cellular viability of 91%, yeast concentration of 4.08×10⁸ cell/mL, and power flocculation ≤20% were obtained from the same batch after fermentation and centrifugation.
Sample Preparation
Sample preparation was carried out in weight (dry basis) per volume (w/v %), using the initial concentration of yeast paste as a reference. Different weights of the yeast paste were diluted in Eppendorf tubes (Hamburg, Germany) with 20 mL of distilled water to obtain concentrations of 0.05, 0.15, 0.25, 0.35, 0.45, 0.55, and 0.64 g/mL. All tubes were mixed using a V1 Plus vortex mixer (Boeco, Hamburg) to ensure complete solubilization and were then quickly placed in the rheometer for experimental analysis. To ensure minimum alteration of the samples, they were maintained at a temperature of 10±3°C during the preparation process.
Rheology Study
The shear stress of the yeast paste samples at the different mass concentrations was determined at temperatures of 20–80°C using the TA Instruments model AR 2000 rheometer (New Castle, DE) with a conical end concentric geometry cylinder (rotor radius=14 mm, cup radius=15 mm) under controlled conditions. Shear stress was measured in the range of 1–315.5/s of shear rate at each temperature and concentration studied. The temperature increase was programmed at cycles of 10°C in intervals of 15 min to avoid structural alteration of the sample. The rheometer had been previously calibrated with ethylene glycol and chlorobenzene to ensure correct functionality. 20 All rheological measurements were carried out in triplicate, and the data were analyzed with the TA Instruments software.
Mathematical Modeling and Statistical Analysis
Mathematical and statistical analyses were carried out using functions from Matlab version 7.1 (The MathWorks Inc., Natick, MA):
where τ is the shear stress (Pa),
Once the model with the best fit was obtained, a study effect of temperature and solid concentration on the model parameters was undertaken using an Arrhenius-type relationship, as shown in Equation 5:
25
where A0 is an empirical constant, Ea is the activation energy (J/mol), R is the universal gas constant (8.314 J/mol/K) and T is the temperature (oC). 26,27
When the Arrhenius-type relationship showed poor statistical correlation, a statistical approach was carried out to determine the effect of the variables on the parameters by a multiway analysis of variance using the anova function, with α=95%. After verification of the significance of the variables, the corresponding best-fit models were developed using the stepwise regression method from the stepwisefit function. The stepwisefit function was based on the addition or deletion of the model terms being evaluated using a significance test (p<0.05). 28
As shown in Equations 6 and 7, the adjusted coefficient of determination (R
2
adj
) and the mean relative error (MRE) were used to evaluate whether the model was a good fit and the accuracy of the estimation, respectively:
where R 2 is the coefficient of determination between experimental and estimated values by the corresponding model, Y and Y* represent the experimental and the estimated values, respectively, m is the number of experimental values, and mp is the number of model parameters.
Results and Discussion
Rheological Behavior of Inactive Yeast Paste
The experimental results indicating the shear stress that yeast paste at concentrations of 0.15, 0.25, 0.35, 0.45, 0.55, and 0.64 g/mL is subjected to at different shear rates and temperatures of 20, 30, 40, 50, 60, 70, and 80°C are presented in Figure 2. As shown, τ values started in the range of 0.109–43.440 Pa for x=0.15 g/mL and increased gradually to 8.484–808.111 for x=0.64 g/mL. The temperature influenced the experimental results, since at each level of mass concentration the shear stress decreased as the temperature increased, within the range of sheer rates studied. This behavior was previously reported in products such as broth cultures of S. cerevisiae, fruit juices and purées, concentrated pineapple juice, clarified banana juice, and mold suspensions. 19,26,27,29,30 Moreover, the morphology of the microorganism also influenced the physical characteristics of the fermentation medium, with viscosity used as a parameter for process monitoring and regulation. 31 This can be attributed to the accumulation of biomass or biosynthesized products (i.e., extracellular polysaccharides, protein molecules), resulting in continuous modification of the medium's rheological properties and a more homogenous appearance at high concentrations. 32,33 Thus, the use of theoretical and empirical models correlating to the rheological behavior of the inactive yeast paste is, undoubtedly, an important tool to characterize these materials.

Experimental values of the shear stress of yeast paste as a function of temperature and shear rate at concentrations of 0.15(), 0.25( ), 0.35(
 ), 0.45(
 ), 0.55(
 ), and 0.64(
 ) g/mL. Color images available online at
Rheological Modeling Results
In this study, the experimental shear stress of yeast was modeled using the Newton, Power Law, Herschel-Buckley, and Bingham models at different temperature and concentration levels. Poor statistical performance was observed for the Newton (R2 adj ≥0.962 and MRE ≤54.784%) and Bingham (R2 adj ≥0.961 and MRE ≤47.540%) models, since their parameters failed to describe the experimental values of the yeast paste. The Herschel-Buckley model seemed to show good accuracy, with R2 adj ≥0.957; but in solid concentrations above 35 g/mL, MRE values were above 48.273%, indicating low accuracy of the model. The Power Law model gave the best accuracy in describing the rheological behavior of yeast paste. Tables 1 and 2 present the statistical validation results and model parameters, respectively.
Statistical Validation of the Power Law Model
Parameter Results of the Power Law Model
In Table 1, the values of R2 adj (≥0.999) and MRE (≤3.400%) show the precision of the Power Law model, which is depicted graphically in a normal distribution of the experimental and calculated data shown in Fig. 3. The data included in Table 2 demonstrate that the flow consistency index (k) of the Power Law model also decreased gradually as the temperature increased for each mass concentration (x) and temperature level; k increases when x increases, with this increase nearly doubling from one x value to the next. Moreover, the flow behavior index (η), ranging from 0.801–0.585, was evidence of pseudoplastic behavior. These results were similar to those previously reported by Senapati et al., Mechetti et al., and Telis-Romero et al. for sugarcane molasses, coal combustion products, and binary and ternary solutions of ethylene glycol, sodium phosphate, and water. 13,34,35
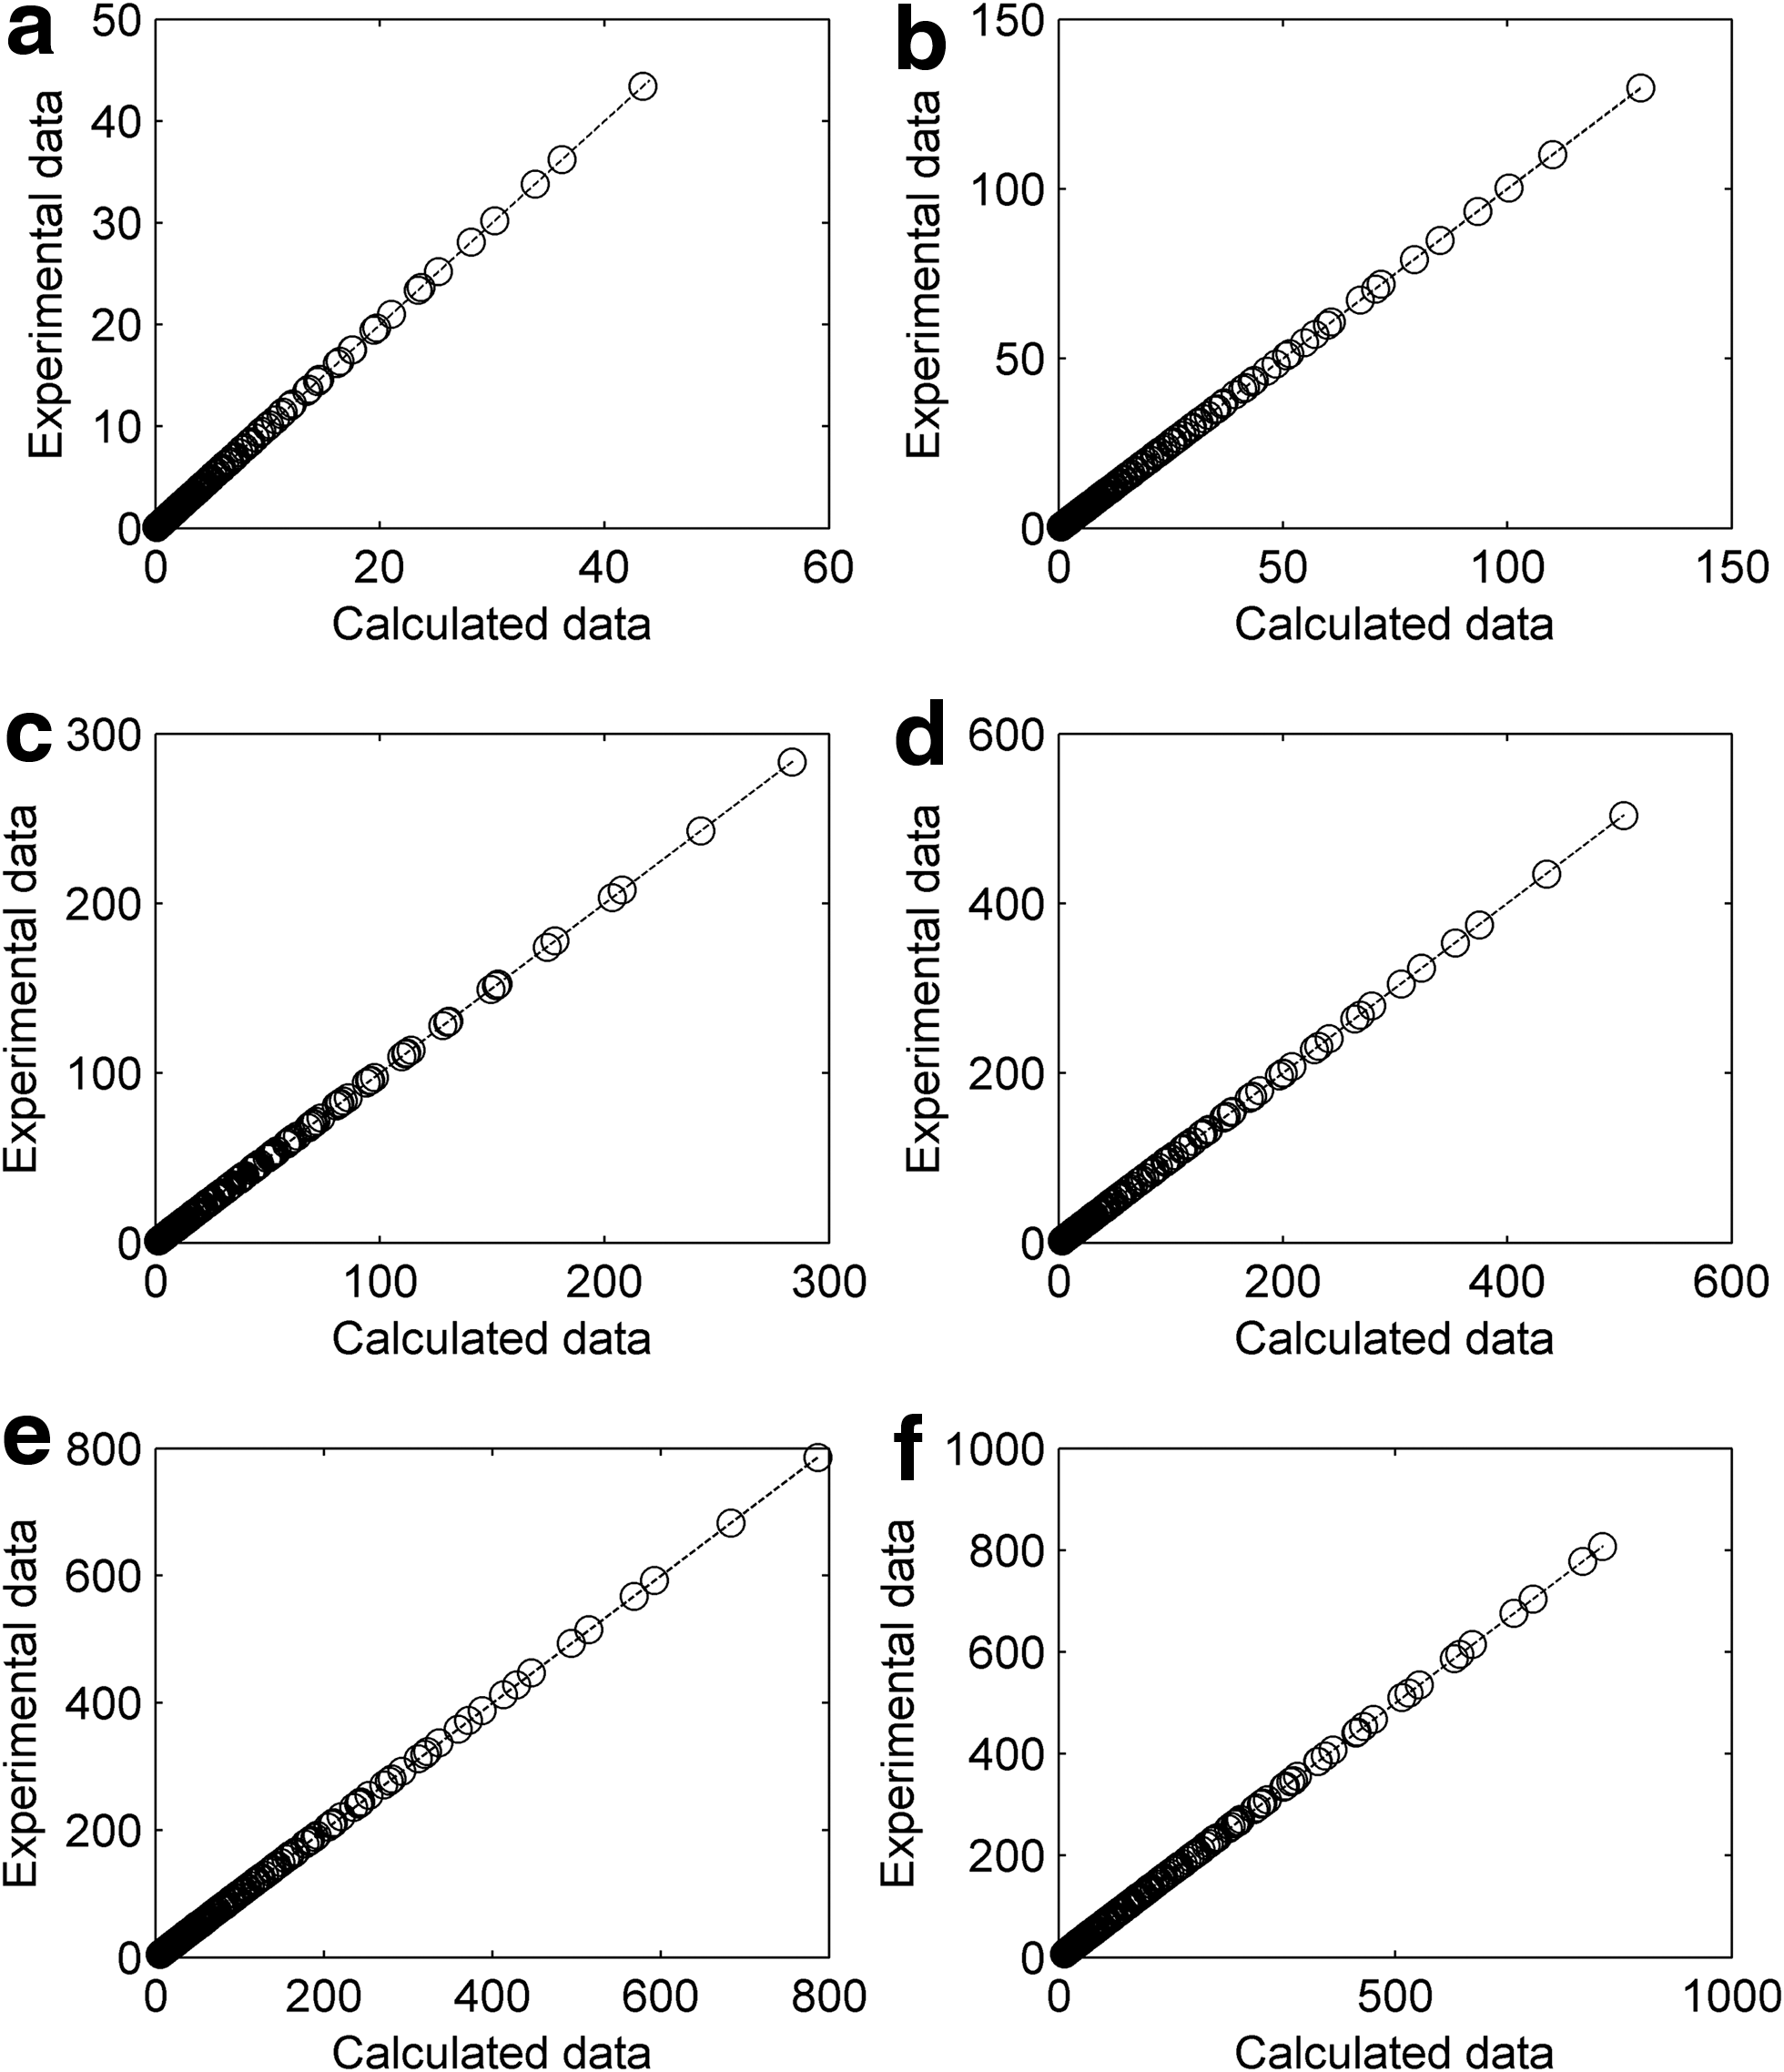
Normal distribution between experimental and calculated shear stress data by the Power Law model at concentrations of 0.15
Few studies have quantified the influence of biomass accumulation on broth rheology, although some studies have demonstrated that increasing the mass concentration increases rheological behavior.
31,36
The nature of the microorganism's surface and the temperature also play an important role in any study of rheological behavior of biological suspensions, although these parameters are difficult to quantify.
37
However, the rheological parameters of the Power Law model (k and η), made it possible to study the influence of temperature and mass concentration on these variables. A significance test was first used to determine the variables' effects on the rheological parameters, with the results shown in Table 3. The influence of solid concentration was greater than that of temperature for both k and η, indicating that a model design based on the solid concentration or on both variables can be considered. Flow behavior index values were tested initially using an Arrhenius-type model, showing a poor statistical correlation (R2
adj
=0.001, MRE=87.036%). Therefore, a model was proposed through the stepwisefit function, leading to a polynomial model as a function of the solid concentration and temperature, as shown in Equation 8:
Significance Test Results of the Temperature and Solid Concentration Variables on the Power Law Model Parameters
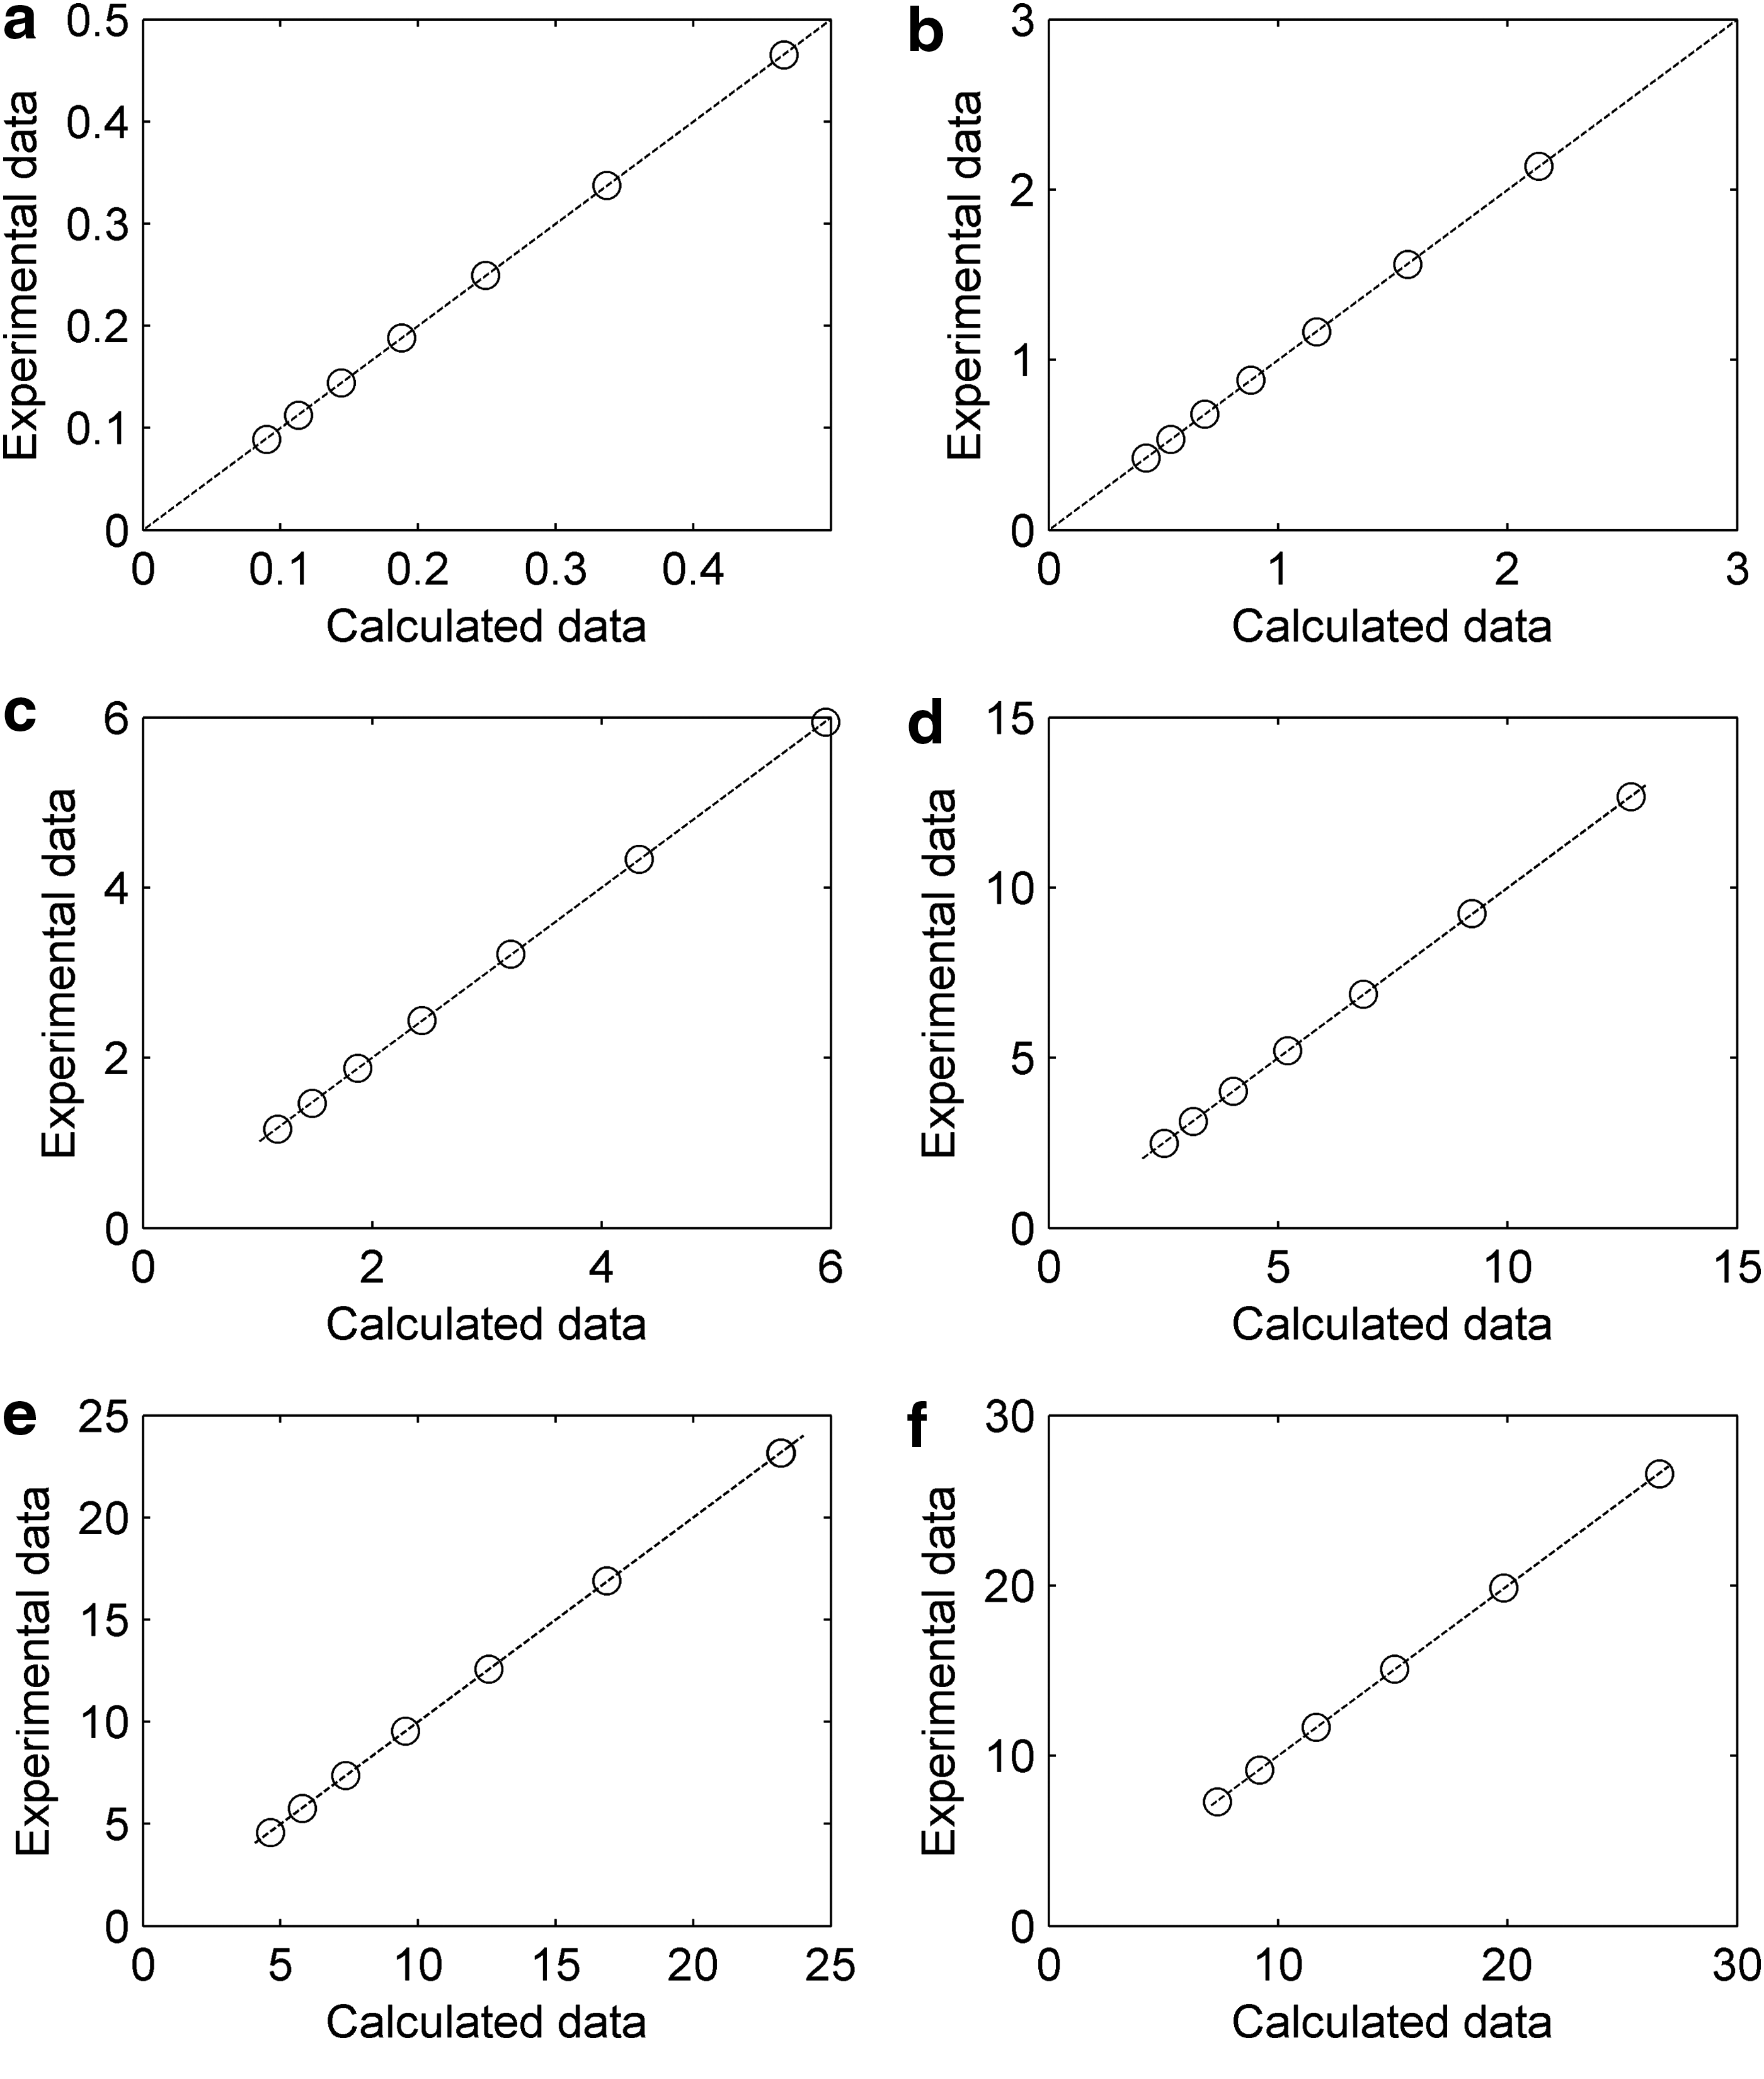
with values of R2 adj =0.993 and MRE=0.633%. Figure 4 shows the correlation between the experimental and calculated data of η by the polynomial model.

Normal distribution between experimental and calculated flow behavior index by a polynomial model as a function of solid concentration and temperature.
For the flow consistency index, an Arrhenius-type equation was obtained at each solid concentration level with the results yielding good accuracy (Table 4). Figure 5 shows the correlation between the experimental and calculated data of k by the Arrhenius-type model. The activation energy was calculated in the range of 2,770–2,858 J/mol (Table 4), showing low variability for all the levels of solid concentration studied. Ea values indicate that the temperature effect on yeast paste does not cause changes in structure. The results obtained for Ea can be attributed to components such as proteins, sugars, and minerals in the inactive yeast paste, which, at high temperatures, affect the viscosity of the paste, causing it to behave as a simple solution (e.g., sugarcane juice). 38 A similar trend was observed for sugarcane molasses and rice brans. 34,39 The Ea values indicate that yeast paste, when subjected to industrial processes, will behave like a fluid, even if it is exposed to high temperature processes such as alcohol extraction (90°C) and spray drying (≥100°C) (Fig. 1). At industrial levels, pump and pipe designs for moving this material can have the same characteristics for both low and high concentrations, although the problem of calculating pump power can only be solved by considering the high concentration. These results are consistent with those observed in the sugarcane-ethanol processing industry and can be used to supplement the data in the existing literature. Although some authors have recognized the importance of the rheological properties of yeast paste, the use of statistical procedures and mathematical modeling to correlate the effects of temperature and solid concentration has rarely been addressed.
Normal distribution between experimental and calculated flow behavior index of the Power Law model at concentrations of 0.15
Temperature Effect on the Flow Consistency Index of the Power Law Model
Conclusions
A rheological study of inactive yeast paste at different mass concentrations and temperatures was carried out using a concentric-cylinder rheometer. Experimental results show an increase of shear stress as the mass concentration increases at all shear rates and temperatures studied. Four rheological models (Newton, Power Law, Herschel-Buckley, and Bingham) were evaluated, and the Power Law model was found to be the best fit. The Power Law model describes pseudoplastic behavior at mass concentrations of 0.15–0.64 g/mL of inactive yeast paste and, through an Arrhenius-type model and statistical approach, it was possible to study the effects of the temperature and mass concentration on k and η, respectively. These results support the conclusion that understanding the rheological behavior of inactive yeast paste provides important information for the design and construction of equipment, as well as for the development of control systems in the ethanol industry.
Footnotes
Acknowledgments
The authors are grateful for the financial support received from the National Council of Technological and Scientific Development (CNPq - project number 402102/2012-6) for this doctoral project.
Author Disclosure Statement.
No competing financial interests exist.