
Abstract
Understanding biomass pore structural changes during enzymatic hydrolysis is critical for elucidating the intrinsic hydrolysis reaction mechanisms and interactions between cell wall degrading enzymes (CWDEs) and biomass. Mixed hardwoods (MHW) and switchgrass (SG) were pretreated using biphasic carbon dioxide (CO2) and water (H2O) at 200 bar and 210°C. Resulting samples were hydrolyzed by CWDE mixtures, and the reducing sugar yield was measured by high performance liquid chromatography at different hydrolysis time points. Hydrolyzed biomass was treated with protease to remove bound CWDEs, and the treated biomass accessible pore volume was measured using a size-exclusion chromatography system. The influence of biomass drying was evaluated by measuring the pore size distribution of dried biomass samples by rehydrating and repacking them into the chromatography system. Results showed a 30% initial decline of specific pore volume for both pretreated MHW and SG after the first 2 h of hydrolysis, which correlated well with hydrolysis rates that decreased by 26.3% and 36.3% for pretreated MHW and SG, respectively, 2 h after the reaction started. Temporal pore volume measurements obtained during enzymatic hydrolysis clearly showed that CWDEs had reduced accessibility to the substrates over the course of the reaction. Also, particle size analyses of the substrates after reaction with CWDEs revealed a shift in the particle size distribution toward smaller particles. This is another way that CWDEs modify the biomass structure. Finally, results from drying experiments showed that drying could universally decrease the accessible porous volume of pretreated and hydrolyzed biomass by up to 80%, which suggested that drying could cause the irreversible collapse of pores.
Introduction
A strong linear correlation between accessible pore surface area and the initial rate and extent of hydrolysis has been documented for a wide range of biomass substrates. 1 –4 This is consistent with the heterogeneous catalysis framework that defines the transport and binding of cell wall degrading enzymes (CWDEs) to the various insoluble cellulosic fibers, mats, and particles that represent the three-dimensional structure of cellulosic biomass. 5 –8 However, the CWDEs-cellulose reaction system differs from the classical heterogeneous catalysis framework in that the CWDEs are modifying the three-dimensional structure of the particles through the fragmentation of cellulosic particles and by altering the local density of the biomass. 5, 9, 10 This would imply that the accessibility of the biomass to CWDEs is likely to change dramatically over the course of enzymatic hydrolysis, and that understanding these temporal changes in accessibility is essential for elucidating the CWDEs-cellulose reaction system.
Physical and morphological modifications of biomass substrate during the enzymatic hydrolysis process have been investigated using different technologies. 5,9,11 Using a particle counter, it was found that Avicel PH102 particles (FMC BioPolymer, Philadephia, PA) that passed through the 150-mesh sieve and were collected on the 200-mesh sieve underwent physical fragmentation. This was observed by the increase in the numbers of cellulose particles and the shift in the particle volume distribution towards the smaller size range. It was also reported that endoglucanases played the main role in cellulose fragmentation, although both endoglucanases and exoglucanases are capable of fragmenting cellulose. 9,10 Another study, using fluorescence imaging and a confocal microscopy system, revealed smaller particles being generated, but also a 40% reduction in the bacterial microcrystalline cellulose (BMCC) particle density, without significant change in the particle shape and size after 8 h of hydrolysis. 5,12 From these observations it was concluded that the density of the BMCC decreases over the course of the reaction. Atomic force microscopy (AFM) has also been used to visualize biomass surface modification by CWDEs. 13 An AFM study showed that the CWDEs became gridlocked on the cellulose fibrils and attributed this to the roughness of the crystalline cellulose surface. 14 Other AFM studies showed that the CWDEs system preferentially degraded the amorphous regions over the high crystalline regions of the ionic liquid-treated Avicel, thus yielding a change in the surface morphology of cellulose microfibrils. 11,15
Solute exclusion has been proven to be a particularly effective method for estimating accessible pore volume and pore surface area. 1,16 –19 In this method, inert probes are eluted through a column packed with the substrate of interest. Analysis of the elution data can yield accessible pore volume of the packed substrate for different sized polyethylene glycol (PEG) probes, the most commonly used inert probes, which are comparable in size to CWDEs. In addition, this method avoids the intensive drying of the biomass, which is required to measure the nitrogen adsorption surface area and can cause internal pore structure collapse. 18,20,21
Many of the previous pore volume studies were “initial condition” studies in which pore volume distribution results from solute-exclusion chromatography were used to investigate the relationship between initial pore structure and the extent of initial hydrolysis. Here we report on temporal changes in pore volume distribution during the course of enzymatic hydrolysis for pretreated and hydrolyzed mixed hardwoods (MHW) and switchgrass (SG). A biomass hydrolysis model that integrates pore structure changes and hydrolysis mechanisms is proposed. In addition, we assess and quantify the influence of drying on biomass pore structure.
Materials and Methods
Biomass Pretreatment and Enzymatic Hydrolysis
Field-dried MHW and SG were size reduced using a hammermill (Schutte Buffalo LLC, Buffalo, NY) with a 3/8-inch (0.95-cm) screen. Next, 60 g of MHW or SG biomass were mixed with deionized water to obtain the desired solids content of 40% (wt) for biphasic carbon dioxide (CO2) and water (H2O) pretreatment. 22 The resulting 150-g slurry was loaded into a 1-L stirred reactor. Liquid CO2 was then loaded into the reactor to achieve a pressure of 200 bar and heated to 210°C. The reactor contents were mixed to ensure uniform reactor conditions. The inner reactor temperature was maintained at 210±3°C for 10 min. The reaction was then stopped by flowing cold water through a cooling coil within the reactor to achieve a rapid drop in the reactor temperature and pressure before slowly venting the CO2.
Pretreated biomass samples (20 g, wet) were extensively washed with deionized water and placed in 250-mL Nalgene (Thermo Scientific, Waltham, MA) shake flasks. These samples were hydrolyzed in a 10% (wt) solution of 50 mM sodium acetate buffer (pH 4.8) with 15 filter paper unit (FPU)/g cellulose of Spezyme CP1 cellulases (Genencor, Copenhagen, Denmark), 30 (mg protein)/(g cellulose) of Multifect1 xylanase (Genecor, Rochester, NY), and 30 cellobiose unit (CBU)/g cellulose of Novo188 β-glucosidase (Novozyme, Davis, CA) at 50°C in a New Brunswick Shaker-Incubator (New Brunswick Scientific, Enfield, CT) operating at 180 rpm. Samples of 150 μL were taken at 1, 2, 4, 6, 8, 12, 24, and 48 h. Hydrolysis was ended by heating the samples at 95°C for 5 min. Samples were analyzed for glucose, xylose, mannose, arabinose, furfural, and 5-hydroxymethylfurfural (5-HMF) using a Shimadzu (Kyoto, Japan) liquid chromatography system with an Aminex 87P-column (Biorad, Hercules, CA).
Proteinase K Treatment and Separation
Hydrolyzed biomass samples were loaded onto a Millipore glass vacuum filtration system with a 0.2-μm filter (EMD Millipore, Billerica, MA) to separate the biomass solids from the samples. The biomass solids were washed with 100 mL deionized water. This process was repeated three times before the biomass solids were rinsed with 30 mM Tris-HCl buffer (pH 8.2). The collected samples were washed and stored for later protein determination. The biomass solids were then treated with 0.1 mg/mL Proteinase K (Thermo Scientific) in 100 mL Tris-HCl buffer (pH 8.2) at 37°C for 2 h to remove bound CWDEs. CaCl2 (3 mM) was added to the buffer to increase its stability. Proteinase K has a molecular weight of 28.9 kDa and a diameter of 4.6 nm, which makes it comparable in size to many cellulases. 23 –28
The 100-mL Proteinase K-treated biomass solids were loaded onto the vacuum filtration system to separate the solids, which were washed with 100-mL deionized water. The process was repeated three times, and the resulting samples of wash solution were collected and assayed to determine protein concentration. The biomass solids were collected and prepared for solute-exclusion column packing. To assess the degree of CWDEs removal by proteinase K, one-tenth of the biomass samples were again incubated with 10 ml Tris-HCl buffer only at 37°C for 2 h. Liquid was separated by vacuum filtration, and the solids were washed with 10 mL deionized water two times and stored at 4°C before column packing. All the resulting wash solution samples were collected for protein measurement.
Determination of Residual Protein Concentration
Liquid samples were filtered through 0.22-μm Spin-X centrifuge tube filters (Sigma-Aldrich, St. Louis, MO) and prepared for loading onto a sodium dodecyl sulfate-polyacrylamide gel electrophoresis (SDS-PAGE) gel and for protein determination using Bradford reagent. 29 –31 Following filtration, 30-μL liquid samples were mixed with 10 μL 4X SDS loading dye (4% β-mercaptoethanol, 0.16% bromophenol blue, 24% glycerol, 8% SDS, 0.4 M DL-dithiothreitol, 200 mM Tris-Cl, and 0.02 M PMSF) and heated to 95°C for 3 min using a heating block. Electrophoresis was performed in a vertical precast Ready Gel (BioRad). A 10-μL sample was loaded into each well of the gel. The same volume of SeeBlu Plus-2 pre-stained standard marker (Life Technologies, Carlsbad, CA) was added in a separate well along with the samples. The gel was composed of 12% resolving gel and 4% stacking gel and was run at a constant voltage of 120 volts for 40 min. After electrophoretic separation, the gel was stained with Coomassie Brilliant Blue R250 (Bio-Rad Laboratories) for 30 min at room temperature and subsequently destained in deionized water overnight.
The concentration of CWDEs in liquid samples was also quantitatively determined by Bradford assay using Coomassie Plus protein assay reagent and bovine serum albumin standards (Thermo Scientific). After transfer of 150 μL of dye reagent and 150 μL standard/unknown sample solution to Costar microplate (Corning, Inc., Corning, NY) wells, mixing, and incubation at room temperature for 15 min, absorbance at 595 nm of the standards, blanks, and unknown samples was measured using a Synergy 2 spectrophotometer (Biotek, Winooski, VT). A standard curve was created by plotting the 595-nm absorbance of standard versus the protein concentration to determine the unknown sample concentration.
Biomass Column Packing and Pore Size Measurements
A Tricorn high-performance column (GE Healthcare, Piscataway, NJ) with 10 mm inner diameter and 100 mm length was packed with pretreated and hydrolyzed mixed hardwood (PHMHW) and switchgrass (PHSG). A flow adapter with 7-μm frit screens was attached to the bottom of the column. Three hydrolysis times—2, 8, and 48 h—were used to generate PHMHW and PHSG for pore volume determination. Biomass separated by vacuum filtration was loaded into the column through a funnel connected to the top of the column. Approximately 3 g (dry weight) of biomass was packed into the column. When the column was filled to within about 0.5 cm of the top, the funnel was removed and the top flow adapter with 7-μm frit screens was attached. The column was then mounted on a rack and stored in the refrigerator at 4°C for use.
The setup of the solute-exclusion column and pump/detector system is as described in Yang et al. 19 Polyethylene tubing was connected from a 2-L glass feed bottle to an online degasser and pump module to remove gas bubbles from the system. Fluorinated ethylene propylene tubing was used to connect the pump module to the bottom of the column, and the top of the column to the refractive index (RI) detector to determine PEG concentrations.
Before loading solute into the column, 500 mL of degassed MilliQ (EMD Millipore, Billerica, MA) water was pumped through the column to remove trapped air and soluble materials that might contribute a signal as the eluted volume passed the RI detector. The data acquisition system was initiated when the pump module started to deliver aqueous (4 g/L) PEG solutions from a feed bottle at 2 mL/min, and it was stopped when the concentration of the effluent reached a constant peak value. Then the feed bottle was filled with MilliQ water and the pump was turned on to start the elution process. The elution data were monitored until the RI value reached a constant value near 0. After completion of the measurements with the probes, the biomass was dried and weighed. As described in Yang et al., the total accessible volume (VT) for a certain solute is
where M is the initial mass of the solute in the column, Ci is solute concentration, C0 is the influent solute concentration, m is the number of elution aliquots measured for RI, and Vi is a constant volume for each elution aliquot. 19
Biomass Size Distribution Measurements
PHMHW and PHSG particle size distribution were obtained using the Sonic sifter model L3P (Advantech Manufacturing, Inc., New Berlin, WI). A vertical column of air separated particles by oscillating in a periodic vertical motion. This sifting method produces very little abrasion, which is important for retaining the biomass integrity used in the experiment. 32 Five sieves with opening sizes from 75–2,000 μm were used with amplitude of 8 on the sifter; 2–3 grams of biomass were loaded and sieved for 3 min. The mass difference of each sieve before and after sieving was determined for retained biomass.
Results
Enzymatic Hydrolysis Results for Pretreated Switchgrass and Hardwood
Percent conversions of substrate into glucose values for PHSG and PHMHW measured over 48 hours are shown in Fig. 1. PHSG plateaued after 12 h of hydrolysis, whereas it took 24 h for PHMHW to reach a plateau. PHSG demonstrated a faster initial hydrolysis rate for the first 6 h. In addition, PHSG exhibited the highest percent conversion—70% compared to 45% for PHMHW. At 48 h, PHSG had a 91% glucose conversion compared to 85% for PHMHW. Both substrates exhibited the standard drop-off in hydrolysis rate that has been reported extensively in the literature. 33 –37
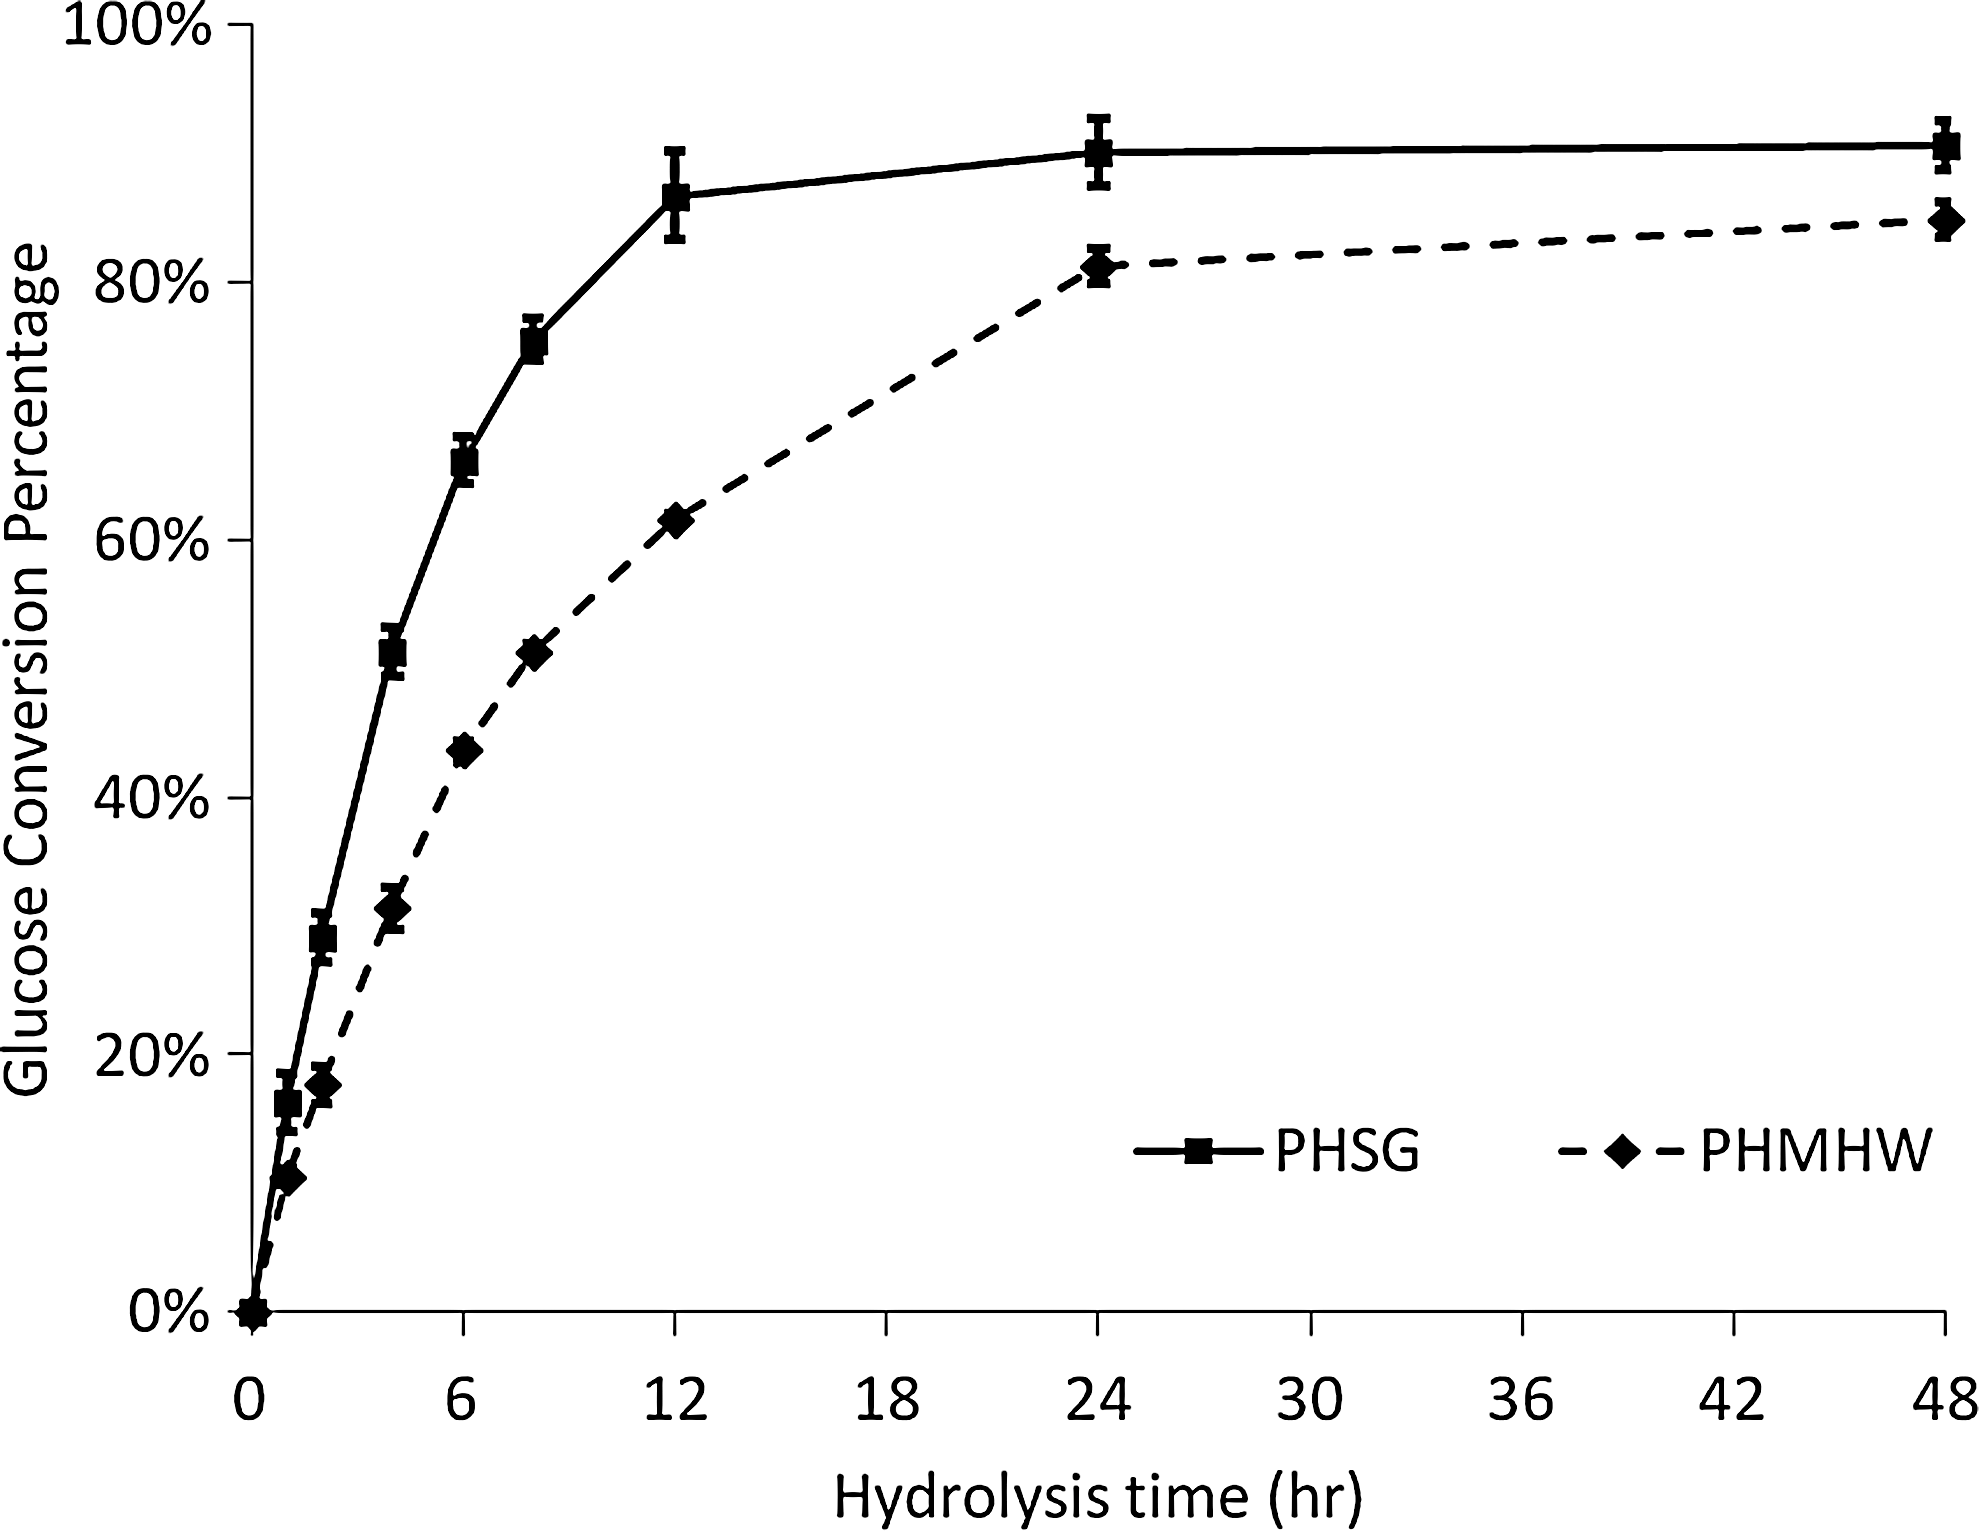
Glucose conversion percentages as a function of hydrolysis time for PHSG and PHMHW.
A closer look at the PHMHW revealed that slopes of the curves in Fig. 1 change rapidly over the course of the experiment. Three different hydrolysis rates can be extracted from the data set that would represent fast, moderate, and slow reaction rates. For PHSG, the time intervals that capture these rates are 0–2, 2–6, and 6–12 h for fast, moderate, and slow rates, respectively. The corresponding time intervals for PHMHW are 0–2, 2–6, and 6–24 h. The resulting hydrolysis rates for these intervals are listed in Table 1. For PHSG, the moderate rate is one-third lower than the fast hydrolysis rates, while for PHMHW the moderate rate is one-quarter lower. The slow hydrolysis rate is three-quarters lower than the fast rate for both PHSG and PHMHW. The fast rate for PHSG is one-quarter higher than that for PHMHW, whereas the differences in the hydrolysis rate between the moderate and slow rates for the two substrates are on the order of 5–8%. These results are consistent with Zhu et al., who reported that the plant biomass recalcitrance (PBR) of woody biomass is greater than that of herbaceous biomass. 38 PBR is related to the physical pore structure, chemical components, and their distributions within the plant cell wall, though it has never been quantitatively defined in the biomass research community. 39
Comparison of the Hydrolysis Rate of PHMHW and PHSG a
PHMHW, pretreated and hydrolyzed mixed hardwoods; PHSG, pretreated and hydrolyzed switchgrass
Proteinase K Treatment of Biomass to Remove Bound CWDES
CWDE-treated biomass samples were loaded onto a Millipore All-Glass vacuum filtration system with a 0.22-μm filter (EMD Millipore) to separate the liquid and solid fractions. The solids fractions were washed three times with deionized water. The liquid fractions were collected and filtered through a 0.22-μm filter before loading onto an SDS-PAGE gel and compared with a SeeBlu Plus-2 marker to reveal the unbound CWDEs (Fig. 2A1, A2 & A3). A2 and A3 showed significantly lighter bands than A1. Thus, we conclude that the bulk of the unbound CWDEs in the supernatant were removed.

SDS-PAGE gel of supernatants separated from
Solid fraction samples were treated with Proteinase K, as described previously to remove CWDEs from the pore structure of the two substrates. Proteinase K molecular diameter of 4.6 nm places it between PEG3350 and PEG8000 in size—with molecular diameters of 3.68 and 5.43 nm, respectively—and comparable in size to Trichoderma reesei endoglucanases and exoglucanases. 24 –28 Thus, we concluded that it would have access to much of the pore volume that is accessible to CWDEs found in the commercial enzyme cocktails used in our study.
After the proteinase treatment, the solid and liquid fractions were separated using the vacuum filter system. The solids samples were washed twice with deionized water. The resulting three liquid samples were filtered and loaded on the SDS-PAGE gel (Fig. 2B1, B2 & B3). It is expected that during the 2-h Proteinase K treatment, the enzyme degrades and fragments both the bound and unbound CWDEs. As a result, the light-colored bands in Fig. 2B1, B2 & B3 indicate that only a very small amount of CWDEs existed in the supernatant after Proteinase K treatment and washing.
To assess the existence of bound CDWEs, the Proteinase K-treated and washed biomass was incubated with buffer in a shaker for 2 h. The solid was then separated and washed two times following the same procedure as described before. The resulting three liquid samples were filtered and loaded on the SDS-PAGE gel (Fig. 2C1, C2 & C3). If any significant amount of bound CWDEs still existed after proteinase K treatment, they would unbind and enter the supernatant in the aqueous system. In that case, bands of CWDEs, should be apparent on the SDS-PAGE gel, as shown in Fig. 2 A1 and B1. However, Fig. 2C1 shows no CWDE bands. These results, and the knowledge that Proteinase K is comparable in size to CWDEs and would have access to the same pore space, lead us to conclude that most of the CWDEs have been removed.
The CWDE concentrations in all nine liquid samples were also quantitatively determined by Bradford assay using Coomassie Plus protein assay reagent. Protein concentration in supernatant after the first separation of hydrolyzed biomass (A1) was 176 μg/mL. After Proteinase K treatment and buffer incubation, the protein concentration in supernatant (C1) drops to 3.5 μg/mL, a 98% decrease in concentration. The Bradford assay results agree with the results from SDS-PAGE gel; they showed that Proteinase K treatment and washing can effectively remove CWDEs from the system.
Specific Pore Volume of Hydrolyzed Biomass
Specific pore volumes, volume/g of material, and results obtained for hydrolyzed PHMHW and PHSG for all probes are shown in Fig. 3A and 3B, respectively. As the solute size increases, the specific pore volumes decrease for both substrates. Figure 3 also shows that the accessibility of both substrates drops rapidly during the first 2 h of hydrolysis. This drop is very acute for a probe of 5.4 nm—the nominal size of CWDEs—for both PHMHW and PHSG, as shown in Fig. 4. About a 30% drop in the accessible pore volume was observed during the first 2 h of hydrolysis for both substrates. However, after 2 h, the temporal patterns change dramatically, with the accessible pore volume for PHMHW approaching a constant value (0.55 mL/g), while it continues to decrease for PHSG. Over a period of 48 h, the accessible pore volume for PHSG decreases by 60% to 0.28 mL/g.
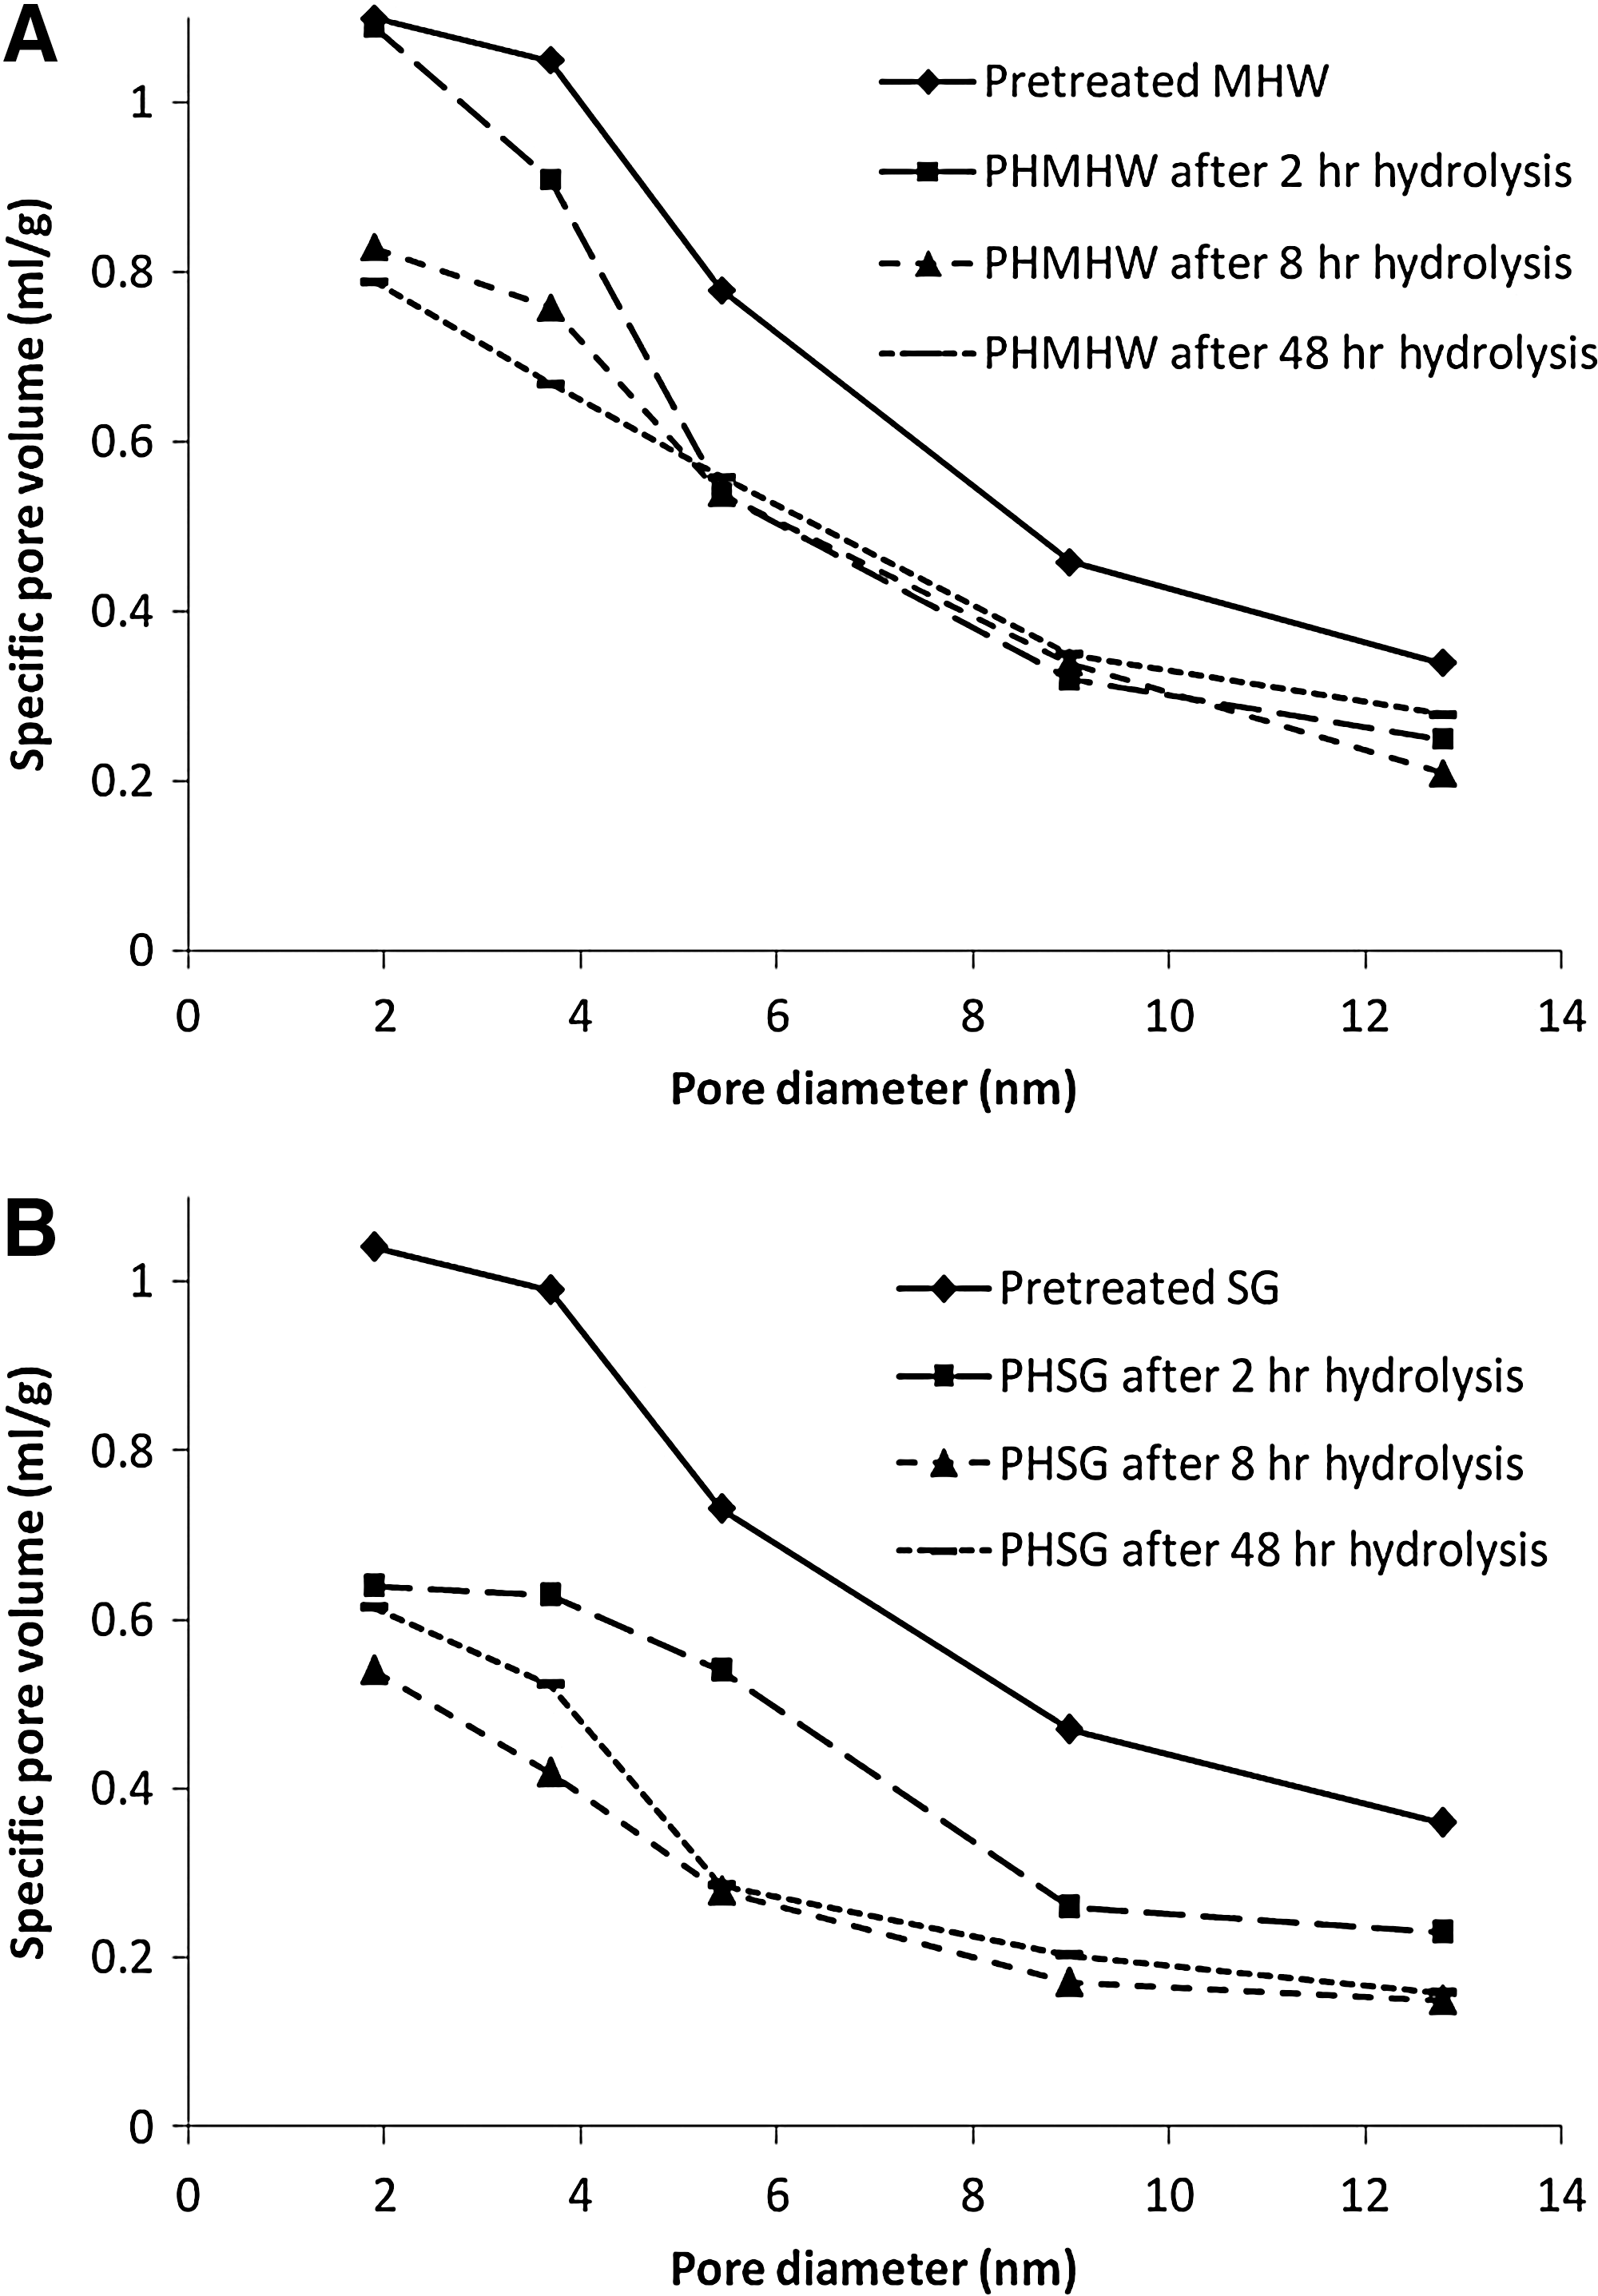
Specific pore volume as a function of probe size for pretreated and hydrolyzed
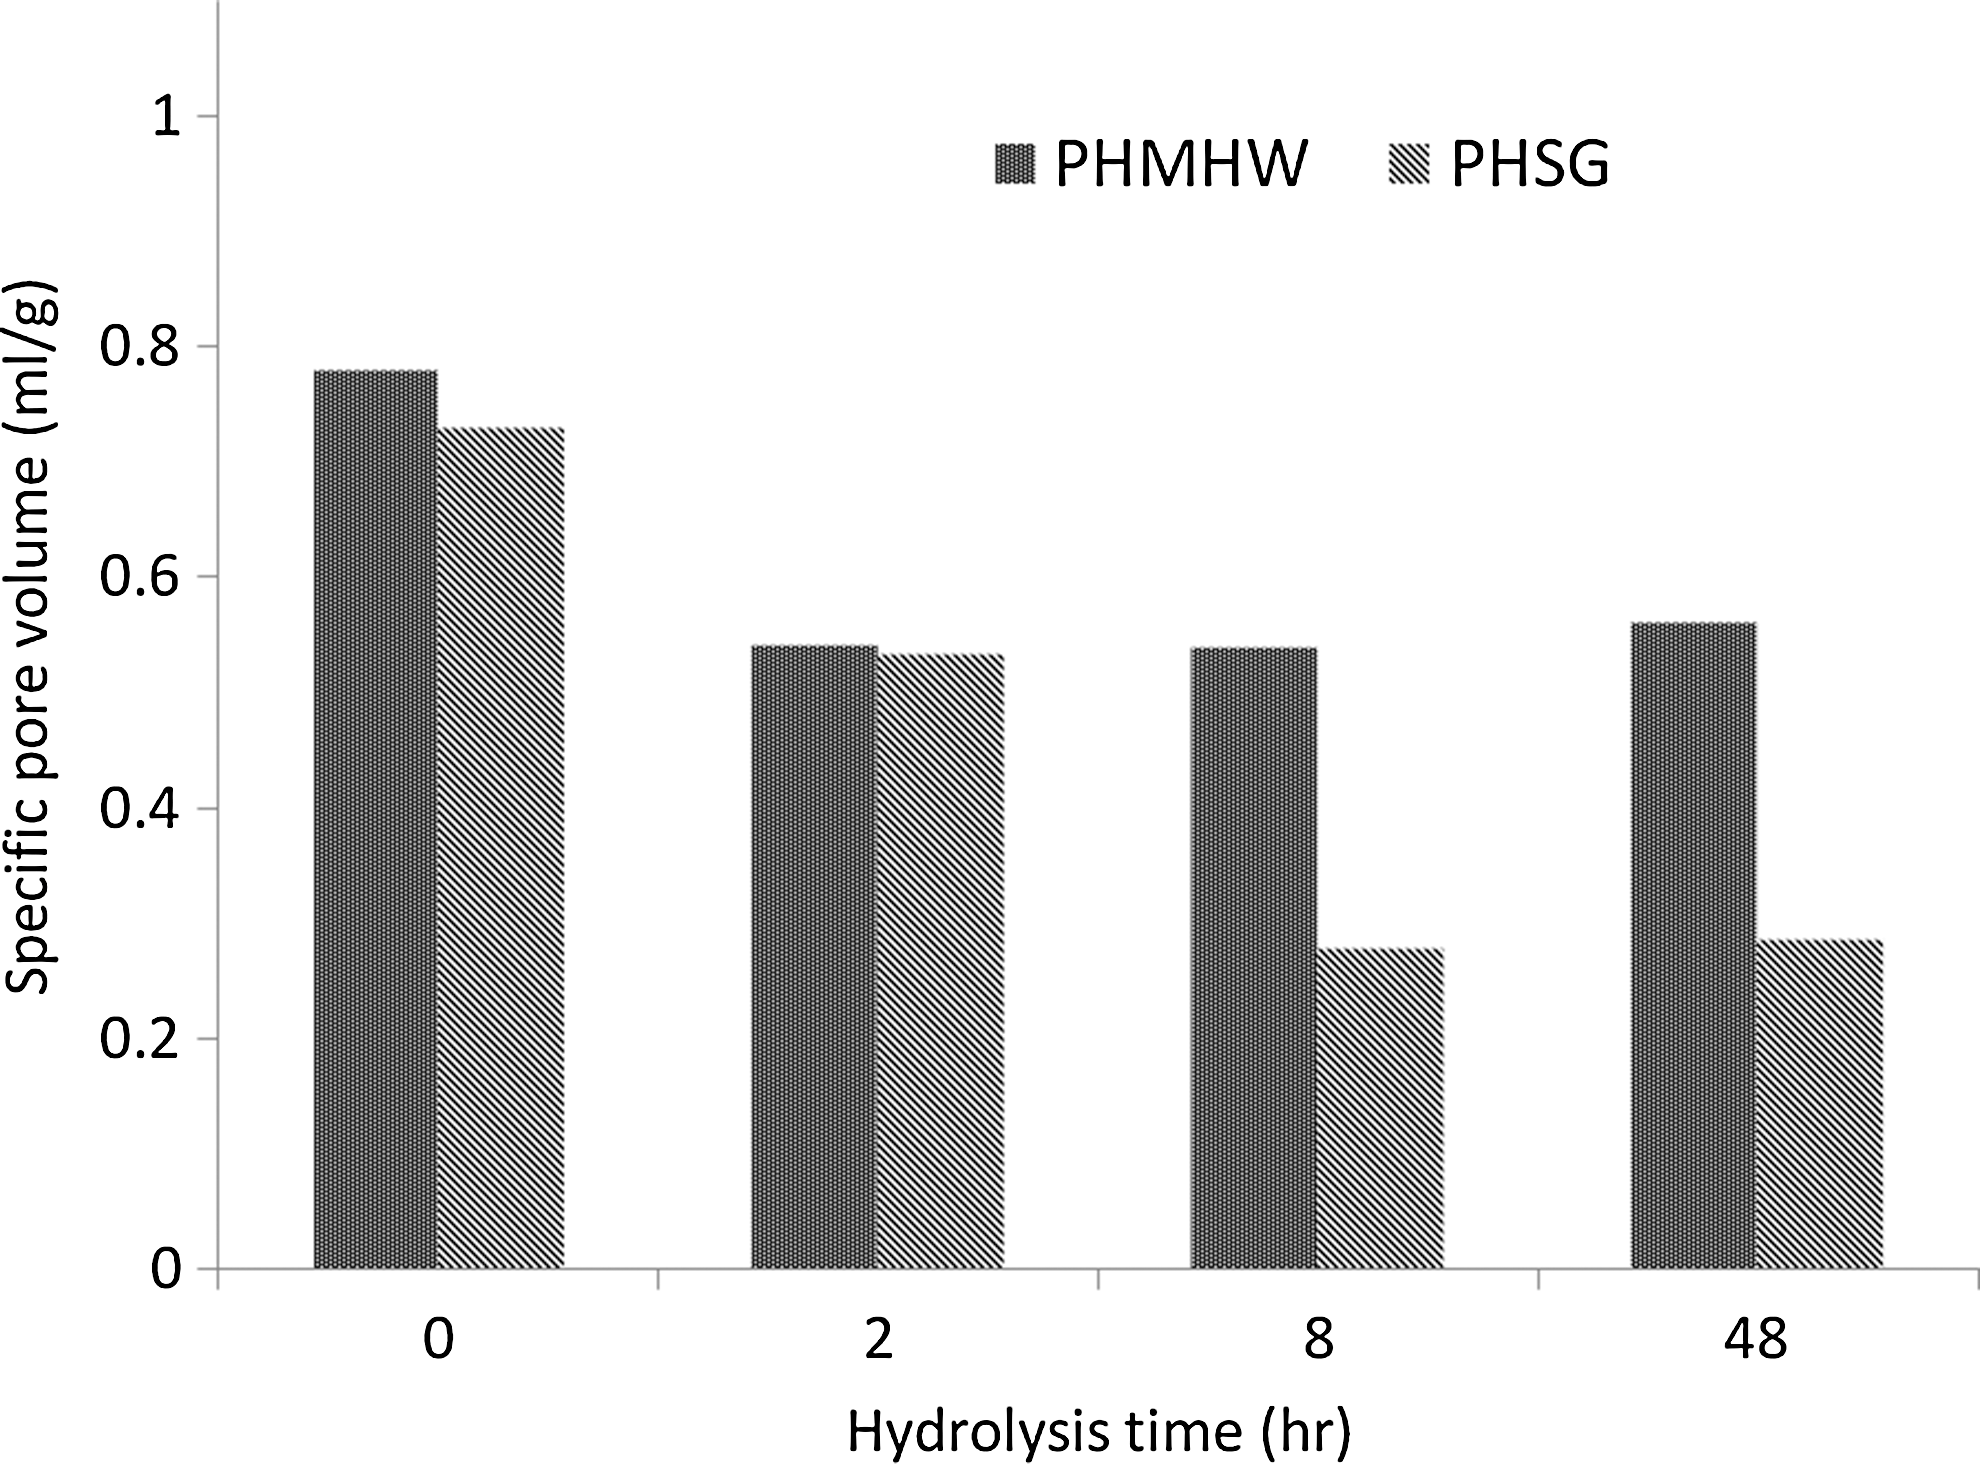
Relationship between specific pore volume available for 5.4-nm probe (PEG8000) and hydrolysis time for both pretreated mixed hardwoods and switchgrass.
As noted previously, there is a strong correlation between the accessibility of the substrate and the rate of hydrolysis. This is evident when we compare the hydrolysis rate data in Table 1 with the temporal change in specific pore volume shown in Fig. 4. The observed decrease in hydrolysis rate after 2 h—26.3 and 36.3% for PHMHW and PHSG, respectively—correlates well with the 30% initial decrease in accessible pore volume seen in Fig. 4. This is consistent with a heterogeneous catalysis framework, in which less-accessible pore volume means a less reactive surface area inside the cellulose particle for CWDEs to bind to and react on, which leads to an overall decrease in the reaction rate. Similarly, PHSG is consistent with a heterogeneous catalysis framework, in which the 60% decrease in the hydrolysis rates observed between the interval of 2–6 h and 6–24 h correlates well with the 54% decrease in accessible pore volume. However, there was no such correlation with PHMHW, for which the pore volume did not change after 2 h, but the reaction rate dropped 68%. This observation for PHMHW would suggest that some factor other than accessibility is responsible for the decrease in the hydrolysis rate, such as enzyme deactivation and increasing cellulose crystallinity. 40 –45
Biomass Particle Size Distribution
Weight fractions retained by sieving screens for PHMHW and PHSG are shown in Fig. 5. Five screens (75 μm, 500 μm, 710 μm, 1,000 μm, and 2,000 μm) were used, and biomass weight proportions retained on each screen are shown in different colors. When pretreated MHW and SG are hydrolyzed for an extended time, the size distributions for both materials shift toward the smaller particle size range. A similar Rosin-Rammler approach was used to calculate the mass-weighted sizes for PHMHW and PHSG in an earlier study. 19 The mass-weighted average sizes for 0-h, 2-h, 8-h, and 48-h hydrolyzed PHMHW were 821 μm, 526 μm, 461 μm, and 370 μm, respectively. A 36% and 55% decrease in average particle size was observed after 2 h and 48 h of hydrolysis, which clearly showed that hydrolysis can significantly reduce the biomass particle size. Similarly, the mass-weighted average sizes for 0-h, 2-h, 8-h, and 48-h hydrolyzed PHSG were 561 μm, 296 μm, 173 μm, and 159 μm, respectively. Average particle size was reduced by 47% in 2 h and, eventually, 72% in 48 h.
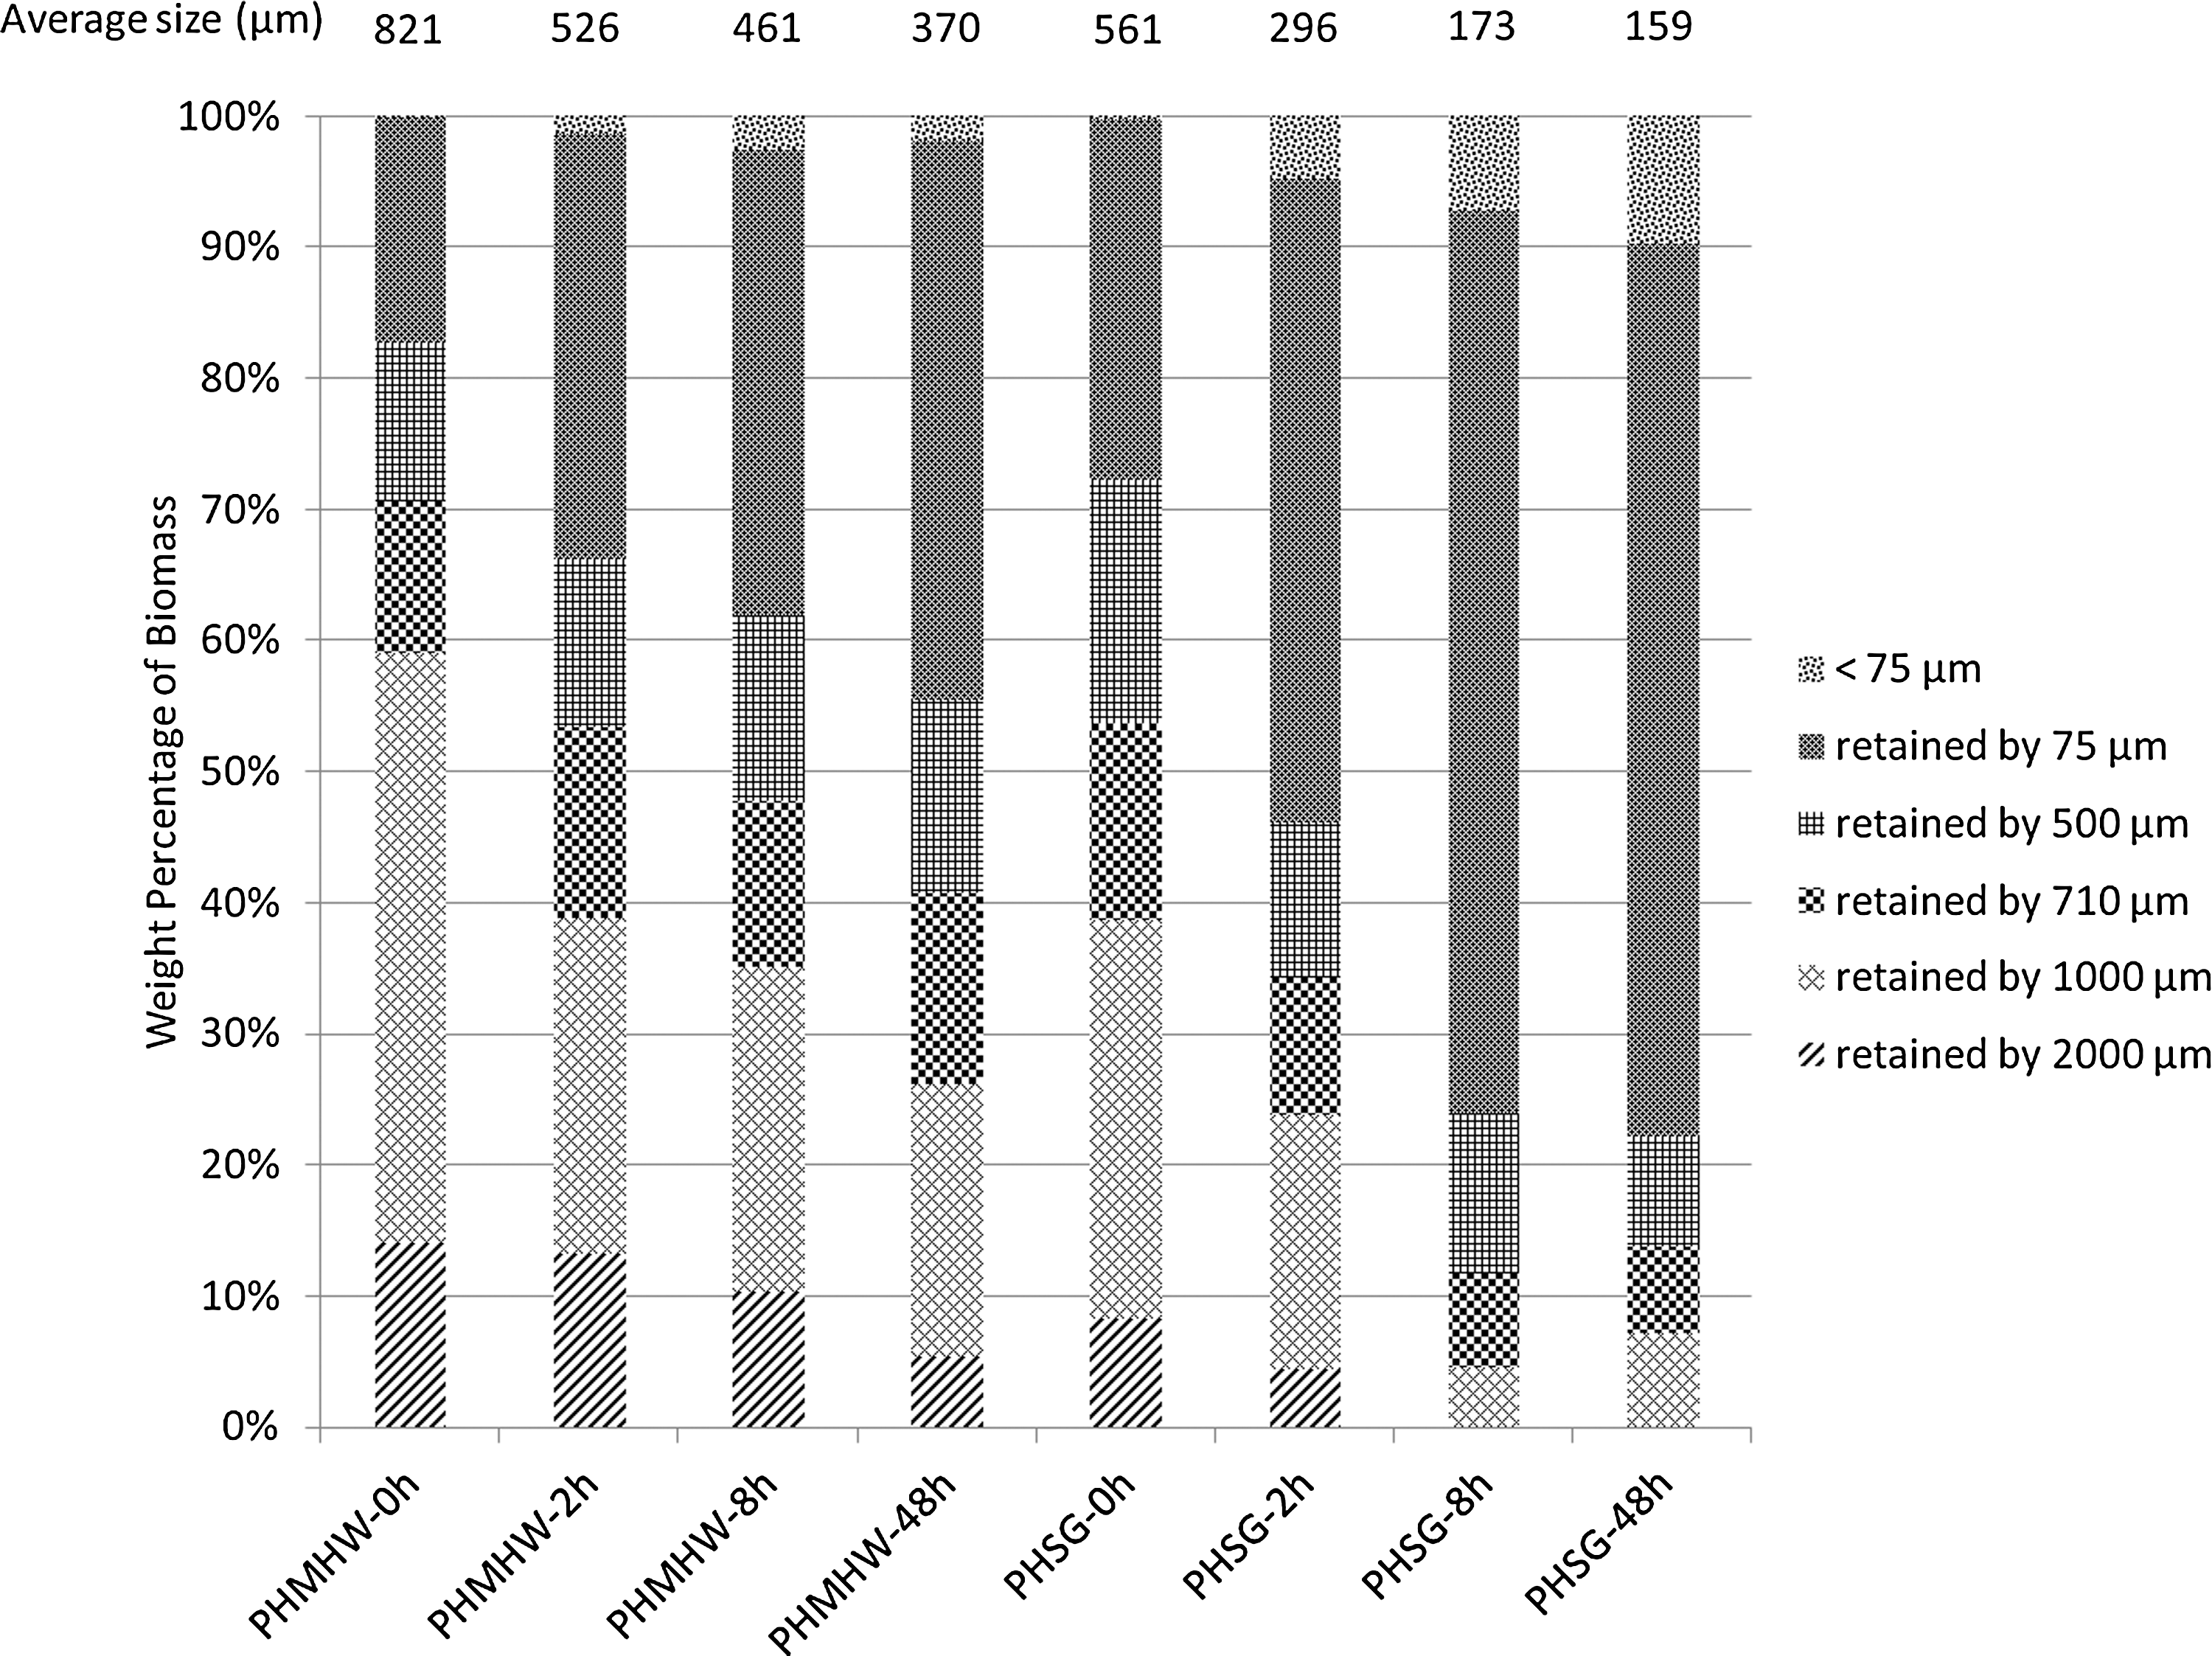
Weight percentages of biomass materials hydrolyzed for 0-48 h retained on different screen sizes (75 μm, 500 μm, 710 μm, 1,000 μm, and 2,000 μm).
The substrate-size reduction during hydrolysis can be due to the combination of two effects. CWDEs bound to the substrate's outer surface, as visualized by AFM, can degrade the surface layer and modify the surface morphology of cellulose microfibrils, thus reducing the size of substrate particles. 11,13 –15 Also, CWDEs diffusing and binding to the substrate inner pore surface can initiate hydrolysis within the particle pores, leading to density reduction and particle fragmentation. 9, 10, 12, 22 Small particles can be released from the large biomass in this process.
The Influence of Drying
Fig. 6 shows plots of specific pore volume versus probe size for dried and un-dried PHMHW and PHSG before hydrolysis and 2 h after hydrolysis. It is clear that drying significantly decreased specific pore volume for both PHMHW and PHSG. Over the probe size range of 1.89-12.78 nm, specific pore volumes for PHMHW decreased by 60–70%, while over the same pore size range for PHSG, most of the points saw a decrease by 30–50%.
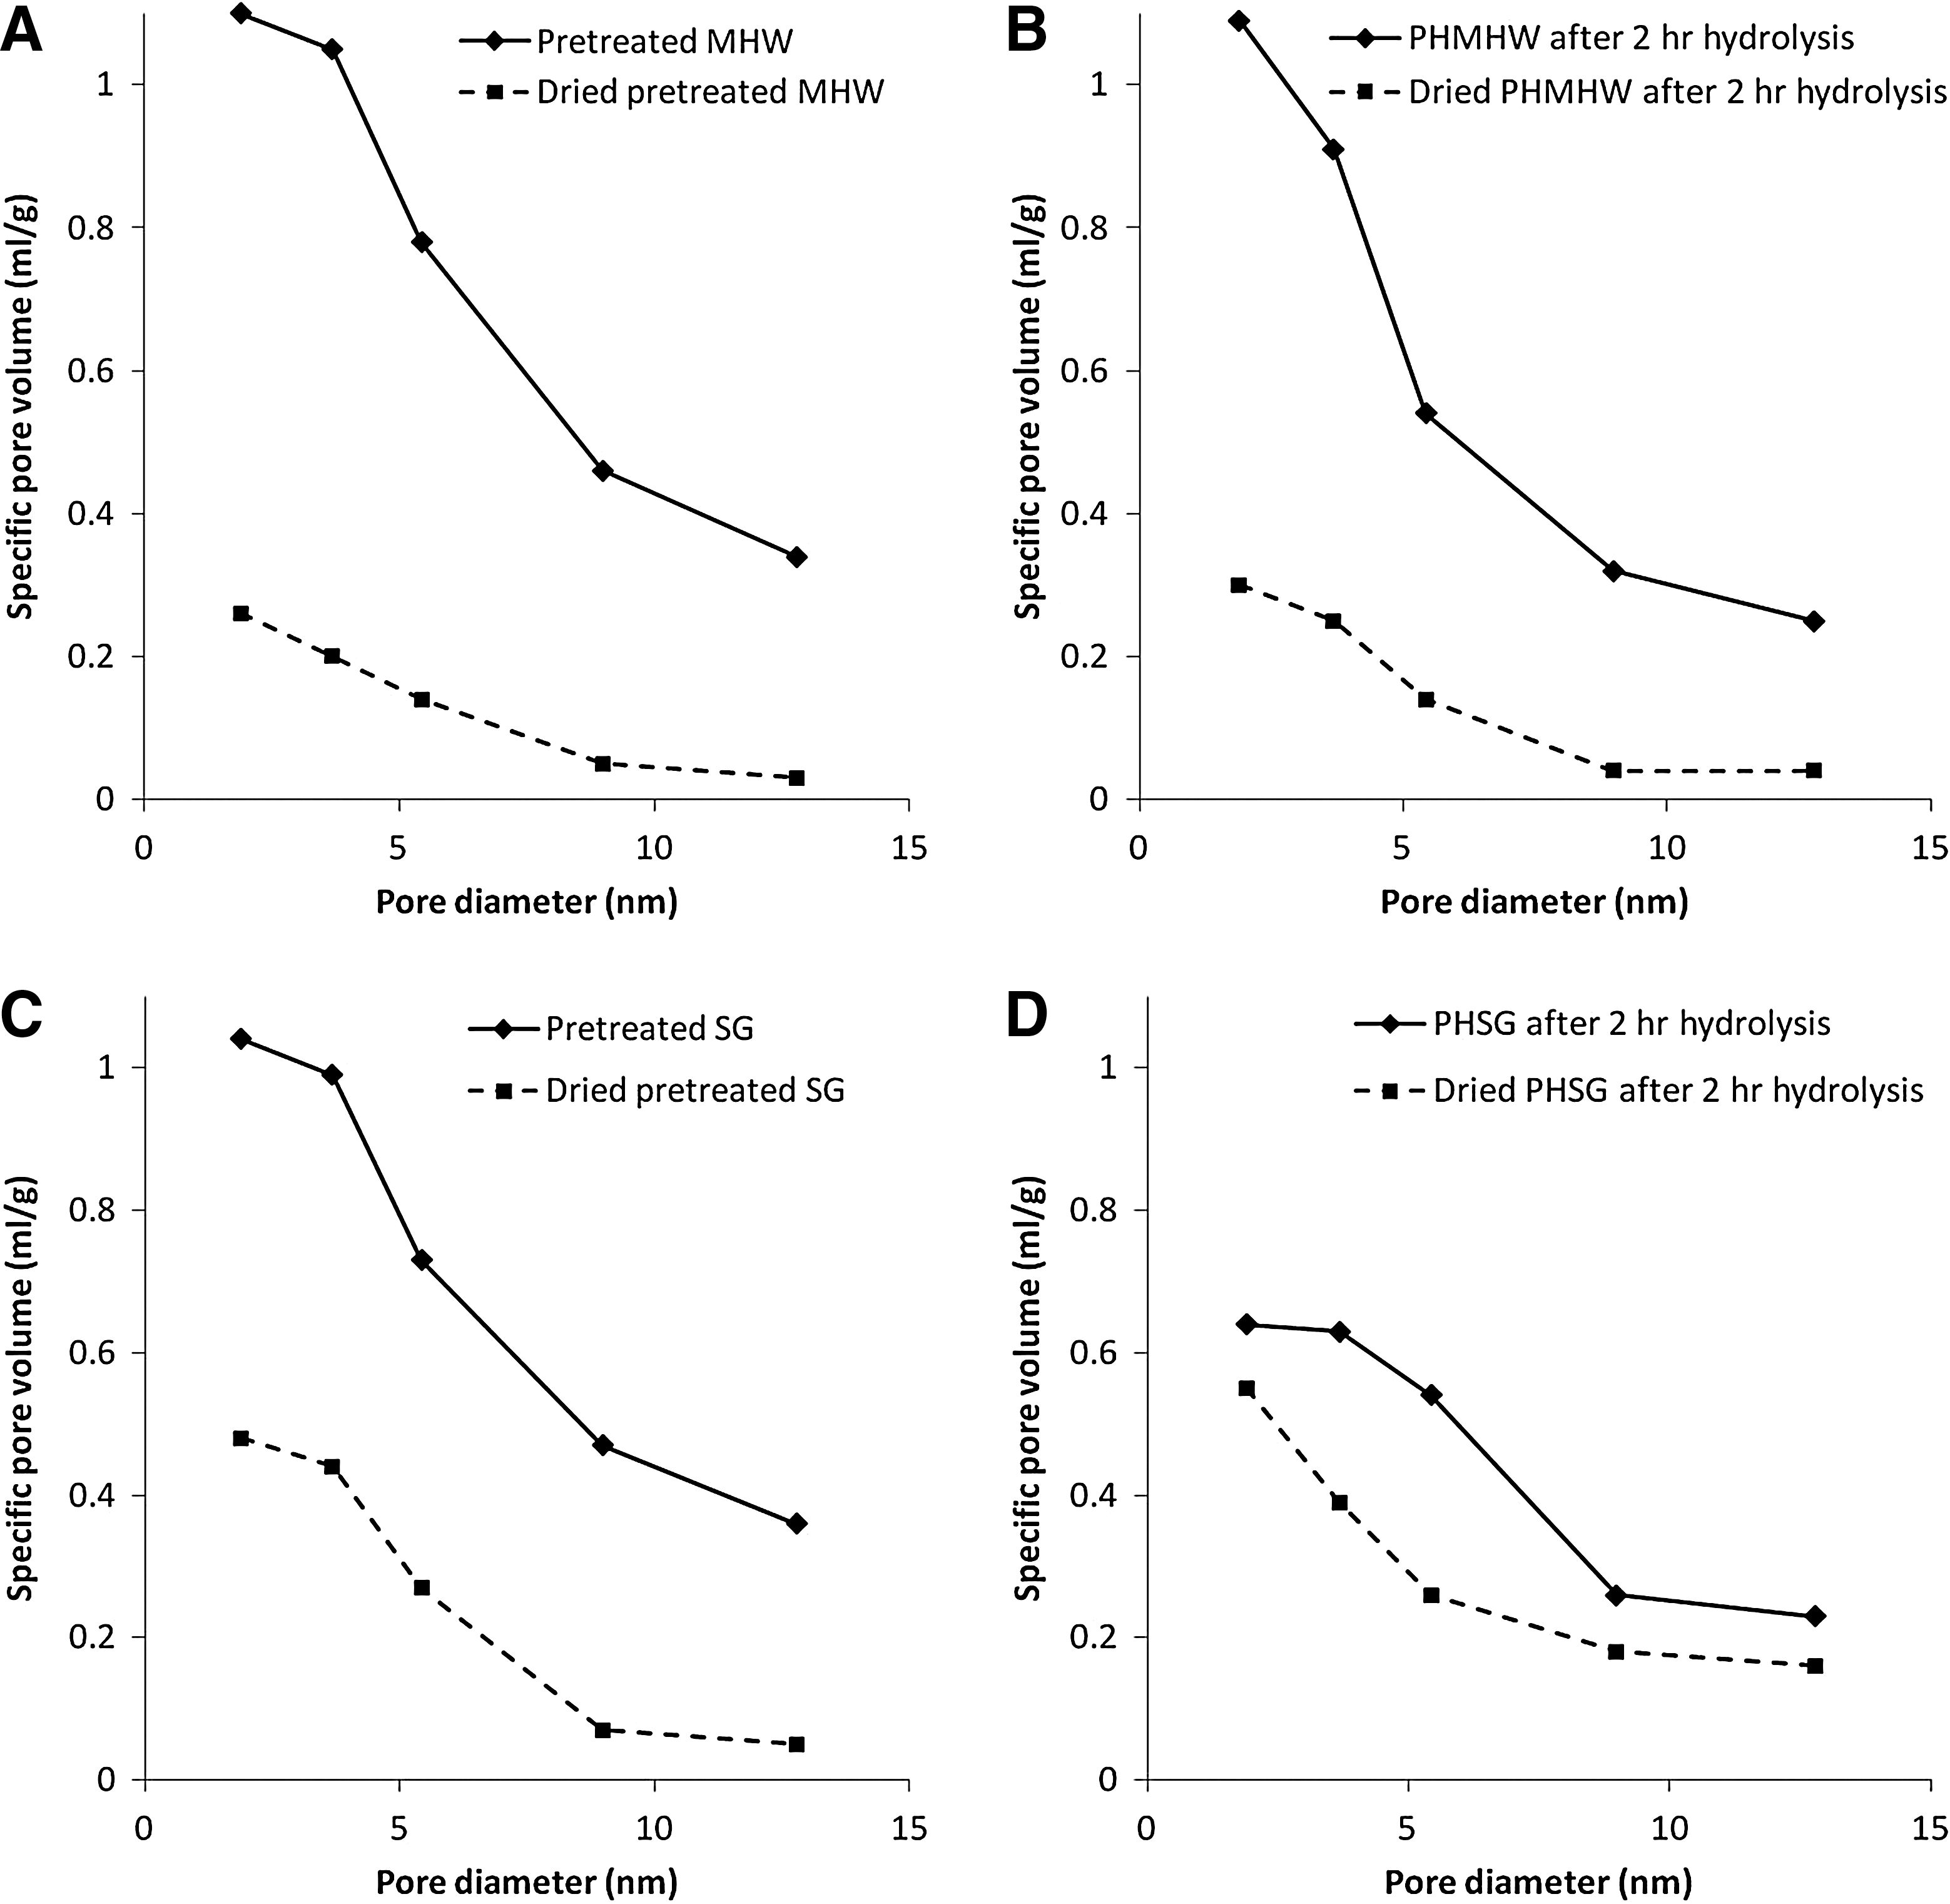
Specific pore volume as a function of probe size on
Fig. 7 compares the accessible pore volume for a 5.4 nm probe for wet and dried PHMHW and PHSG; this example was used to illustrate the pore-collapsing effect. Over a period of 48 h, the accessible pore volume for dried PHMHW stays at 0.15 mL/g, except at the 48-h point; for dried PHSG it is almost constant at 0.22 mL/g. This shows a 60–70% drop in the accessible pore volume for PHMHW. Due to the pore-volume drop as hydrolysis continues for wet PHSG, the difference between the dried PHSG and wet PHSG gradually narrows. Since the dried biomass samples were rehydrated after packing into the column for solute-exclusion measurement, this decrease in specific pore volume indicates that pore collapse due to drying is irreversible.
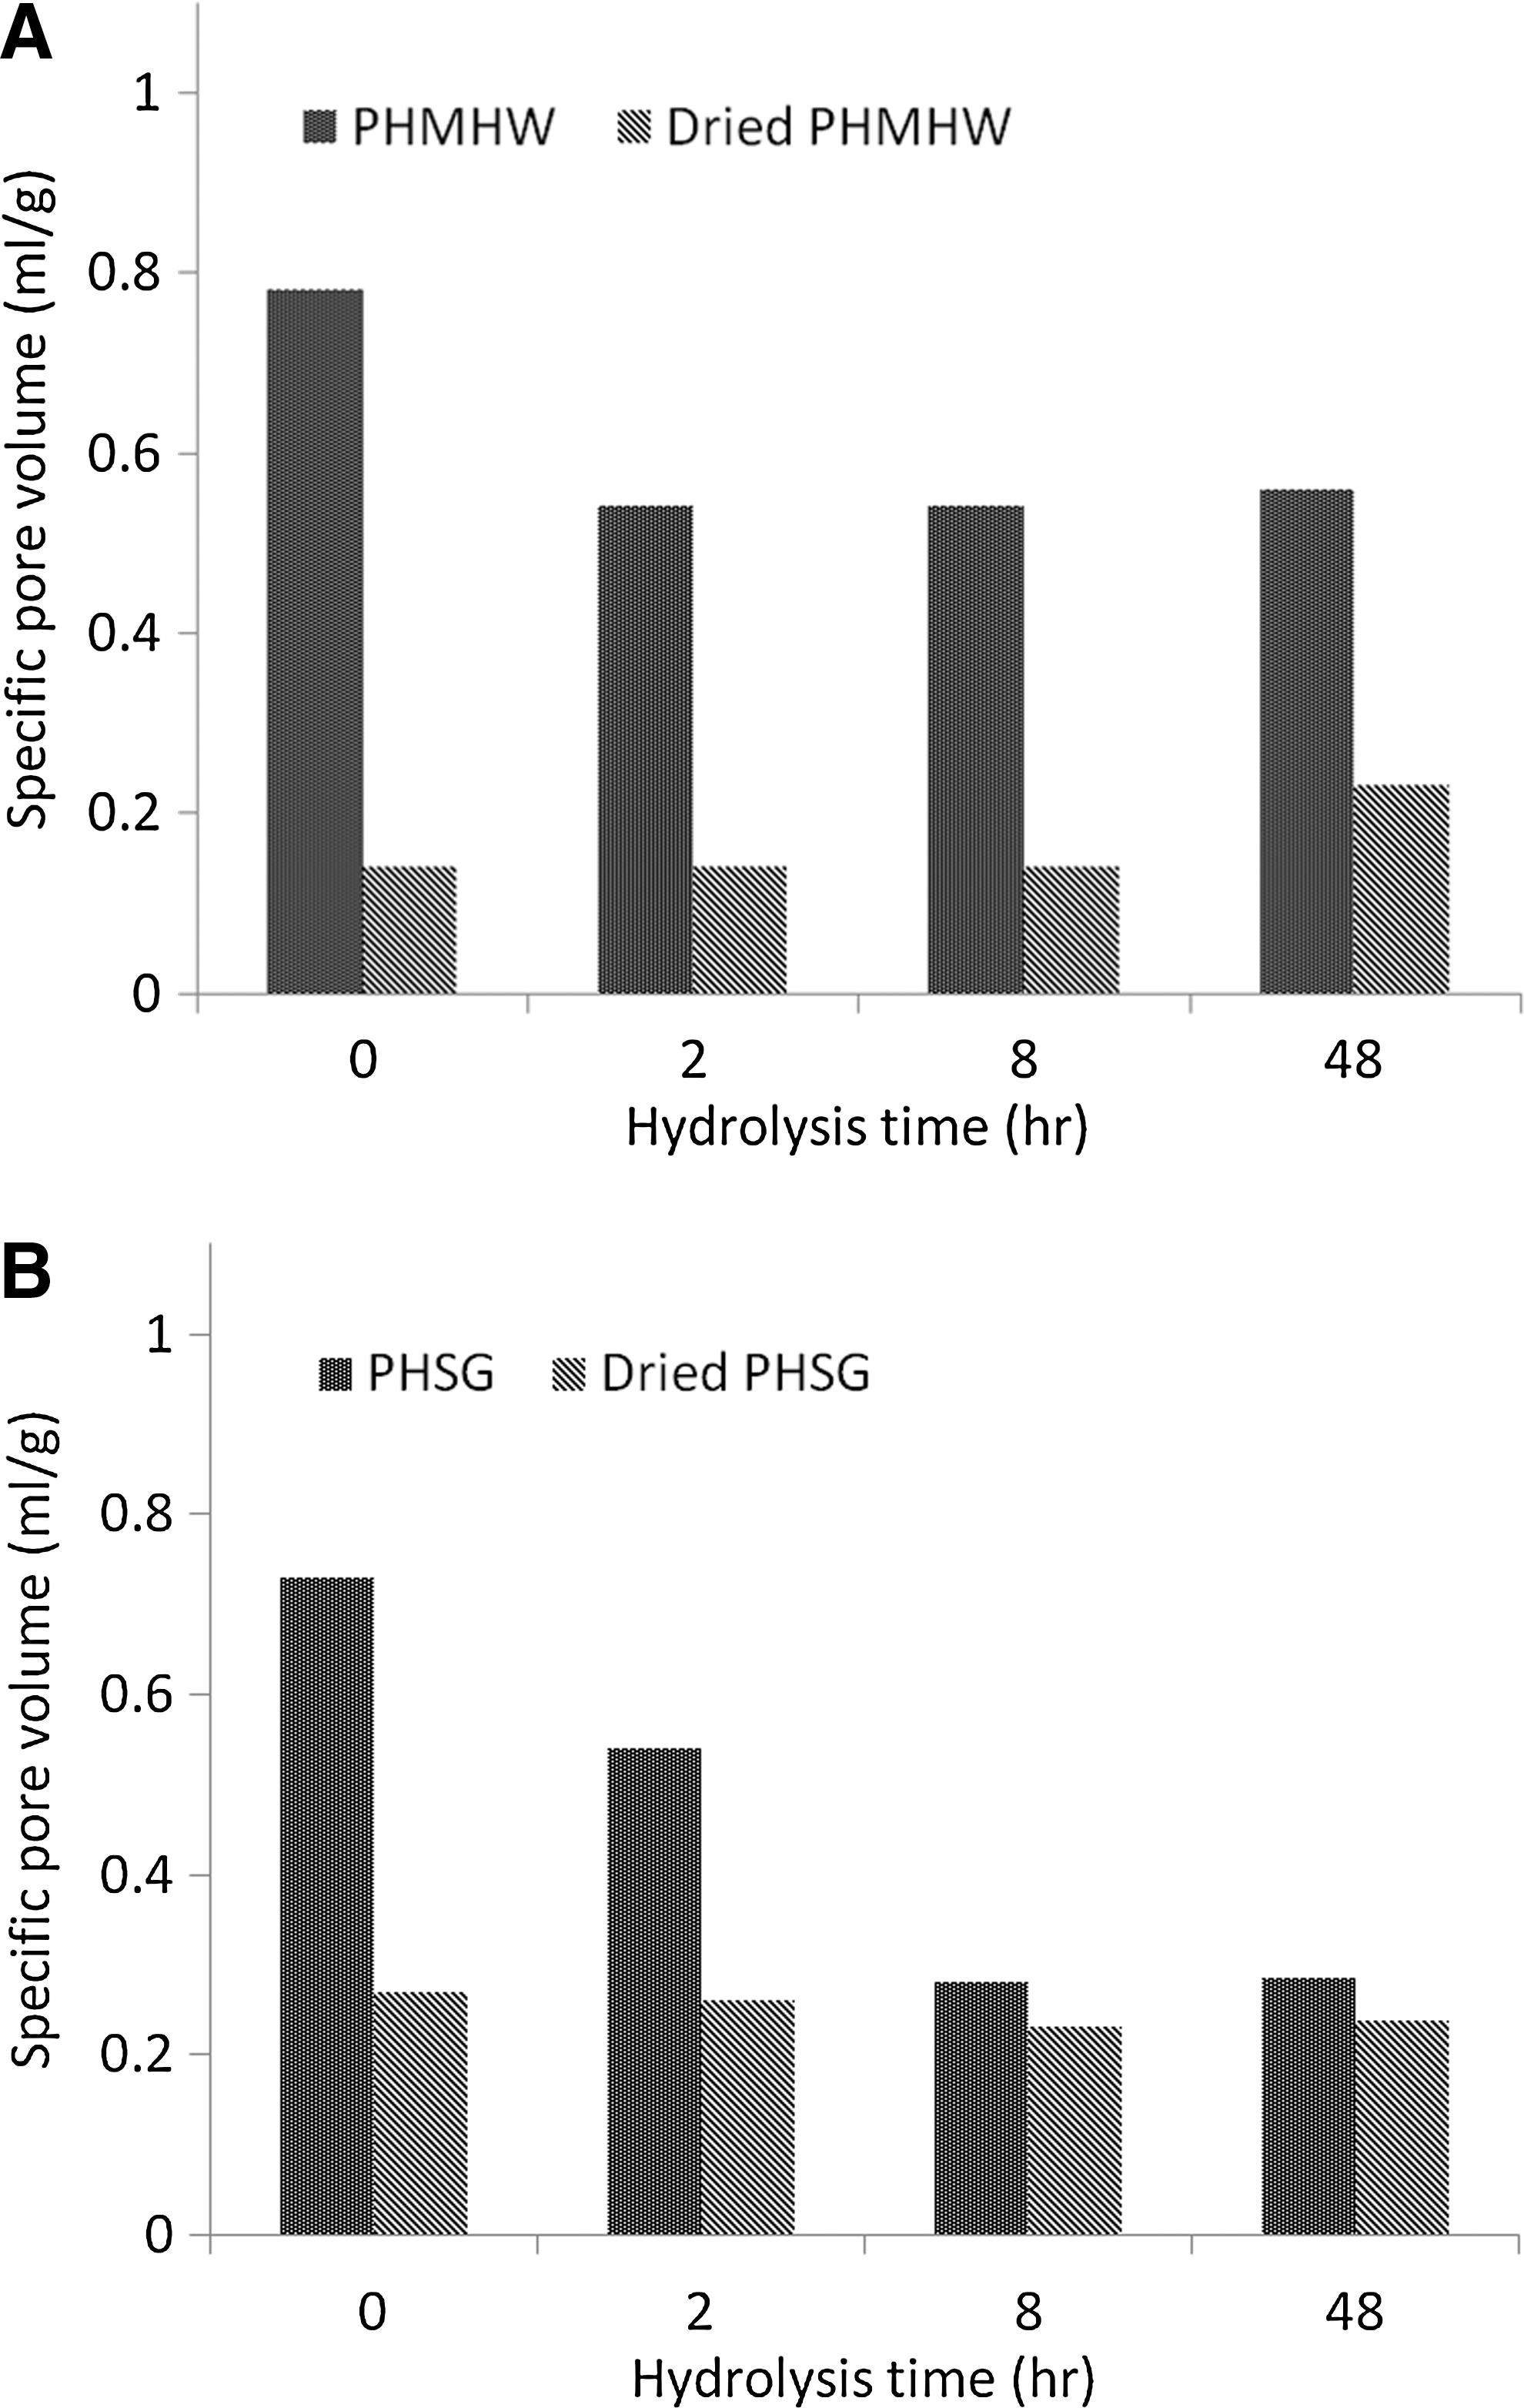
Relationship between specific pore volume available for 5.4-nm probe (PEG8000) and hydrolysis time for
Conclusions
It has been shown consistently that CWDEs acting on cellulosic biomass yields an initial high rate of hydrolysis followed by a declining rate. 33,35 –37 Enzyme deactivation, increasing cellulose crystallinity, and lignin content have been proposed as potential reasons for this loss of activity. 41 –50 The results of this study clearly show that CWDEs' accessibility to the substrates are reduced over the course of the reaction, and this reduction is one of the major factors in the decrease in hydrolysis rate over time.
The results presented here are derived from our biphasic CO2- and H2O-pretreatment platform, which is a relatively new approach for processing lignocellulosic biomass. This pretreatment method produces the comparable sugar yields at solids loading of 2–5 wt% that one would expect with uncatalyzed processes, such as steam explosion and hot water pretreatment, yet produces comparable sugar yields to those obtained with dilute acid over a solids loading range of 5–25 wt%. 51 This is achievable because at the pressures and temperatures at which the pretreatment is carried out, CO2 becomes carbonic acid and the resulting acid-hydrolysis process and slow pressure release provides a limited amount of explosive decompression. 52 Thus, we believe that the results reported here for our hybrid pretreatment method are relevant to other leading pretreatment processes.
It has been known for some time that CWDEs create smaller particles through surface erosion of substrates and fragmentation of particles. 9,10,53 Larger particles, like the ones used in this study, are known to exhibit a high rate and extent of fragmentation. 53 This fragmentation activity opens up the substrate and generates additional external surface area. However, as noted by Walker et al., the resulting increase in external surface area is still small relative to the internal surface area associated with the substrate pores. 10 The creation of smaller particles facilitates the diffusion of CWDEs into and out of the biomass pore structure, but this benefit is negated by the loss in reactive pore volume.
Our results show that drying overnight can universally and irreversibly cause biomass pore collapse and reduce the accessibility of CWDEs to the substrate. This is one of the reasons that previous cellulose hydrolysis studies carried out with model substrates such as Avicel, which has been subjected to intense drying, yielded low accessible pore volumes and CWDE-binding capacity. 18,54 Drying of pretreated biomass is not likely to occur in a biorefinery because it would add an additional processing cost and would lower the energy return on investment. However, drying to preserve samples or to prepare samples for mechanical particle-size reduction for experimental studies will yield a substrate that does not reflect the structural characteristics of biomass after thermo/chemical pretreatment.
Our study demonstrates that the solute-exclusion method is an effective strategy for measuring the accessibility of complex lignocellulosic materials. It also provides a means for documenting the temporal changes in accessibility. Understanding how the structural characteristics of lignocellulosic substrate change during pretreatment and enzymatic processing is essential for strengthening our understanding of these heterogeneous reaction systems.
Footnotes
Author Disclosure Statement
No competing financial interests exist.