
Abstract
Enzymatic hydrolysis of hardwood substrates yields soluble sugars, which are a carbon source for producing ethanol and butanol. However, as the substrate and water are mixed, a viscous, heterogeneous slurry forms. The result is reduced mixing performance, mass transfer, and enzyme-substrate contact, all of which negatively affect sugar titers. In this study, enzymatic hydrolysis of a hardwood substrate at 20 wt% was conducted in a 10L stirred tank reactor. We investigated the dynamic changes in slurry behavior, as well as the interactions among mixer design/operation and fed-batch strategies. The effects of the number and frequency of substrate additions, impeller configuration, and high and moderate agitation speeds were evaluated using torque measurements and in terms of glucan-to-glucose conversion. Fewer additions corresponds to batch operation and negatively impacted solids distribution, accurate torque readings, and glucan conversion. However, as the number of additions incrementally increased, glucan conversion increased, torque readings captured the resistance of the fluid to flow, and the solids distribution within the reactor improved. Moderate agitation speeds of 60 revolutions per minute (rpm), combined with smaller and more frequent fiber additions, led to increased glucan conversion and less torque resistance compared to similar experiments conducted at high rotational speeds (150 rpm), and the use of different impeller sizes and configurations impacted the distribution of the slurry. This work illustrates that the implementation of different fed-batch additions coupled with different impeller types and configurations promotes hardwood slurry blending, accommodates the increase in viscosity, and enables quantification of energy and power consumption.
Introduction
Lignocellulosic substrates are an alternative source of fermentable carbohydrates for the production of liquid fuels such as ethanol or butanol. 1,2 Enzymatic hydrolysis of substrates at high concentrations (>15 wt% dry solids by weight) can yield high concentrations of fermentable carbohydrates, reduce the costs associated with distillation, and maximize liquid fuels production. 3 However, when mixed, the solids and water form a viscous material, often described as a slurry. This physical change impacts mixing performance and enzyme distribution, which can decrease product yield.
Fed-batch strategies, conducted in larger reactors (>2 L), have been proposed to improve mixing limitations and enhance glucan-to-glucose conversion. Hodge et al. devised a fed-batch operation for corn stover based on kinetics studies. 4 Their experiment was conducted in a 7L stirred tank reactor (STR) with two marine impellers and an agitation rate of 400 rpm, which led to 50% and 80% conversion after 48 h and 192 h, respectively. Hennessey et al. also employed fed-batch operation with particle-size reduction using corn cobs in a 2L STR agitated at 300–500 rpm for 72 h. 5 The authors reported different conversions—41% and 65%—depending on the particle size of the feedstock. Other studies have also been conducted in fed-batch mode, but they involved substrates having low lignin content (<25%). 6,7 Hardwood substrates, on the other hand, are more resistant to enzymatic action due to their high lignin content. Di Risio et al. and Zhang et al. conducted separate hydrolysis and fermentation (SHF) experiments for hardwood substrates, and batch mode was used in both studies at larger scales (>200 L). 8,9 Although high-solids fed-batch enzymatic hydrolysis of delignified hardwood has been investigated, the effect of fed-batch operation in SHF with high steam-pretreated hardwood loadings in larger reactors has not been studied or reported in detail. 10 –12
Although fed-batch strategies have proven to be an alternative method for increasing sugar titers and managing the viscosity of the slurry, the operation and design of SHF reactors can still affect the final sugar concentration, as well as the process capital costs. Jorgensen et al. and Dasari et al. employed horizontal reactors to increase sugar titers. 13,14 Jorgensen et al. conducted simultaneous saccharification and fermentation (SSF) of wheat straw and reported a 32% glucan-to-glucose conversion after 24 h. Dasari et al. carried out SHF experiments for corn stover in an 8L scraped surface reactor at 2 rpm and reported 55% conversion after 48 h. Zhang et al. conducted SSF experiments for corn stover in STRs, varying the type and agitation speed, using a helical and Rushton impeller at 120 rpm and 200 rpm, respectively. 15 By comparing the power consumption (PC) profiles, the authors concluded that the helical impeller performed better than the Rushton impeller. However, PC is proportional to rotational speed, so given the trial conditions, the Rushton impeller would be expected to generate higher PC readings than the helical impeller. Moreover, Zhang et al. reported similar sugar titers when different impellers were employed during the 12 h of SHF. Based on the aforementioned studies, we hypothesize that employing different fed-batch strategies in a SHF configuration coupled with modifications in the impeller/reactor parameters will enhance the mixing of viscous hardwood slurries and increase sugar titers.
This study investigates the dynamic changes in slurry behavior during high total solids (>20 wt%) hardwood hydrolysis and, in particular, investigates the effects of mixer design/operation and fed-batch feeding of insoluble solids. The objective of this study is to produce data and gain insights into the interactions among design parameters in the reactor, such as enzyme, substrates, and the type and speed of impellers. The parameters are evaluated based on changes in torque profiles and glucan conversion during SHF.
Materials and Methods
Materials
Non-washed, pretreated mixed hardwood was provided by Mascoma Canada (Brampton, ON). The steam-explosion pretreatment was conducted at the company's pilot plant in Waterdown. 8 The continuous pretreatment reactor does not produce a pretreatment liquor. Detailed information about pretreatment conditions is not available, but the characterization protocol from National Renewable Energy Laboratory (NREL/TP-510-42618) was employed to determine carbohydrate composition of the pretreated substrate. 16 Table 1 presents the initial chemical characterization of the different pretreated substrates used in this study. The enzyme cocktail is a blend of cellulases (β-glucosidases and glucanases) and hemicellulases (manufacturer and composition not specified due to material transfer agreements). The total loading of enzyme is 0.05 g of enzyme solution per gram of total solids (0.01 g protein/g total solids). The protein content was measured using Bradford method.
Chemical Composition of Steam-Explosion Pretreated Hardwood Substrates a
Other components, including organic acids, ash, and other carbohydrates make up the balance of the fiber substrate.
Enzymatic Hydrolysis
Enzymatic hydrolysis was conducted at 50°C for 48 h in a 20L ChemGlass (Vineland, NJ) reactor with a working volume of 10L. The experiments began with the addition of enzymes to the reactor, which was prefilled with the water needed for the hydrolysis reaction. The enzymes were thoroughly mixed for approximately 10 min prior to the addition of the solids. Initially the solids comprised insoluble material; as the material was converted, the total solids content became a combination of soluble and insoluble solids. During the reaction, the total solids were incrementally increased at regular intervals over a period of 48 h by adding additional fiber. For instance, 10 additions were performed over a period of 12 h or less, depending on the trials, and additional fiber was added after 20 h of enzymatic hydrolysis until 20 wt% total solids was achieved. When needed, the pH was adjusted with the addition of 4 M NaOH or 3 M H3PO4 solution. On completion of the enzymatic hydrolysis, the reactor contents were cooled to room temperature. The liquid and solid portions were recovered by filtration and were weighed. The liquid samples were set aside for further sugar analysis using high-performance liquid chromatography (HPLC).
The fed-batch mode of operation was initially investigated at high rotational speeds (150 rpm). Three different feeding strategies were investigated: 3, 14, or 20 incremental additions of biomass, labeled as 1, 2, and 3, respectively. Table 2 presents a summary of the conditions for each trial.
Summary of Parameters and Results for Experiments Conducted in a 20L Chemglass Reactor a
The diameter of the Chemglass reactor is 10 in, the liquid height is 12 in, and the shaft diameter is 0.8 in. The impeller clearance for trials 1, 2, and 3 was 5 in, while for trials 4 and 5, it was 5 in and 2 in, respectively.
In trial 1, fiber was added at the beginning of hydrolysis (0 h), while the rest of the fiber was equally divided and added after 20 h. For trials 2–5, fiber was added hourly.
A, top (axial, 4 in OD) and bottom (axial, 6 in OD); B, top (axial, 6 in OD) and bottom (radial, 6 in OD); C, top (axial, 8 in OD) and bottom (radial, 6 in OD).
For trials 2, 3, and 5, the energy consumption was calculated for the entire enzymatic hydrolysis experiments, from 0-48 h.
Peak power consumption calculated at the endpoint addition for each of the trials using the peak torque value.
The enzymatic hydrolysis efficiency was calculated as follows
where mglucose produced (g) corresponds to the glucose produced from hydrolysis, f is the glucan fraction of dry biomass (Table 1), the constant 1.111 is the mass gain when glucan is converted into glucose, and m(dry biomass) (g) corresponds to the total mass of substrate used to produce a 20 wt% slurry. We tracked the mass added into the system over the entire course of hydrolysis. The total operating mass is comprised of the enzyme solution, fiber, water, and the pH control chemical. A representative density of the slurry was also measured. Using the density and operating mass, the liquid volume was obtained and used to calculate the mass of glucose in the system. It is worth noting that different studies have highlighted the uncertainty of measuring the glucose produced in high-solids enzymatic hydrolysis due to changes in the liquid fraction as hydrolysis proceeds. 4,17,18 Although this paper did not use the equations proposed by Hodge et al., potential differences in the liquid fraction were taken into account by directly measuring the slurry density (1.06–1.1 g/mL, depending on the experiment). 4 This procedure may present some uncertainties, but it does not materially impact the results or conclusions from this study.
Reactor Configuration
Two impeller types were used in this study: axial-flow and radial-flow teflon impellers (Chemglass). The impellers were mounted on a stainless steel shaft. The 20L Chemglass reactor is equipped with a DC motor, and the motor rotation was set to clockwise. An external controller (CG-2033-31, Chemglass) was used to control the direction and rotational speed of the motor and displayed two parameters: rotational speed and torque. The controller sent torque data every 10 sec to the Hyperterminal Windows XP software, which stored data for further analysis. Different impeller configurations were used, depending on the objectives of the trial. For instance, trial 1 used an upper axial-flow impeller (4 in outside diameter [OD]) with four rectangular blades (45° angle) and a bottom radial-flow impeller (6 in OD) with four rectangular blades (90° angle). Table 2 presents the impeller configurations employed in this study. The power consumption is calculated as follows:
where N is the shaft rotational speed (revolutions/s) and M is the torque in Newton-meter (Nm).
The energy consumption (kWh) is equal to the power consumption multiplied by the hydrolysis time. For trials 2, 3, and 5, the total energy consumption was calculated by numerically integrating the power consumption over the entire hydrolysis time (0–48 h) using the trapezoidal rule. The supplementary data show a plot of the power consumption as a function of the total hydrolysis time (Figs. S1, S2, S3; Supplementary data are available online at
Analytical Methods
The liquid samples were collected in 2-mL tubes and centrifuged at 3,000 rpm for 15 min (Galaxy 14D Centrifuge 37001-599; VWR, Radnor, PA). The liquid portion was filtered through a 0.22-μm syringe filter (Millex Syringe filters; Merck Millipore, Tullagreen, Cork, Ireland). The filtered liquid was later transferred to 2-mL HPLC vials (Agilent Technologies, Santa Clara, CA). The samples were analyzed using an Agilent 1200 Series HPLC and a Bio-Rad HPX-87H or HPX-87P column (Bio-Rad Laboratories, Hercules, CA) to determine concentrations of glucose, other carbohydrates, and organic acids. The HPLC column was operated at 85°C at a flow rate of 0.6 mL/min.
Results and Discussion
Effect of Fed-Batch Mode at High Rotational Speeds on Torque Profiles
Fed-batch mode has been utilized in previous studies of biomass hydrolysis using pretreated substrates such as corn stover, corn cobs, and barley straw. 4,5,19 Fed-batch operation positively impacts conversion and enables viscosity reduction. Therefore, we proposed to employ fed-batch strategies for steam-pretreated hardwood and observe its impact on the rheological changes of the slurry and glucan conversion.
In trial 1, 12 wt% insoluble solids were first added (0 h), and the remaining fiber, equally divided, was added after 20 h of hydrolysis to bring the total solids loading to 20 wt% (26.4 h). Note that the addition at the beginning of trial 1 represents a conventional batch-mode reaction, which is often employed for enzymatic hydrolysis of pretreated hardwood. 20,21 During the initial 10 h of enzymatic hydrolysis, aggregation of the fiber was observed on top of the slurry and at the wall of the reactors, which may be due to a lack of downward force from the axial impeller (4 in OD), coupled with the characteristic shear-thinning behavior of the slurry. 22 To minimize aggregation and improve enzyme-solids distribution, manual mixing was employed periodically. Owing to the solids aggregation at the walls, the torque profile for the first 10 h of hydrolysis only represented the central segment of the slurry, instead of representing the entire bulk of the slurry.
Figure 1A shows the torque profile for trial 1 after 20 h of initial enzymatic hydrolysis with 12 wt% total solids. At this time, a non-uniform slurry was still observed; only slurry close to the impeller was moving, creating a toroid-like shape. Manual mixing was thus employed prior to adding the next batch of fiber. The manual blending was captured via the torque measurements, which increased from 0.5 Nm to 0.88 Nm, with a maximum torque of 0.84 Nm and 1.43 Nm, corresponding to total solids loadings of 16 wt% (21.4 h) and 20 wt% (26.4 h), respectively.
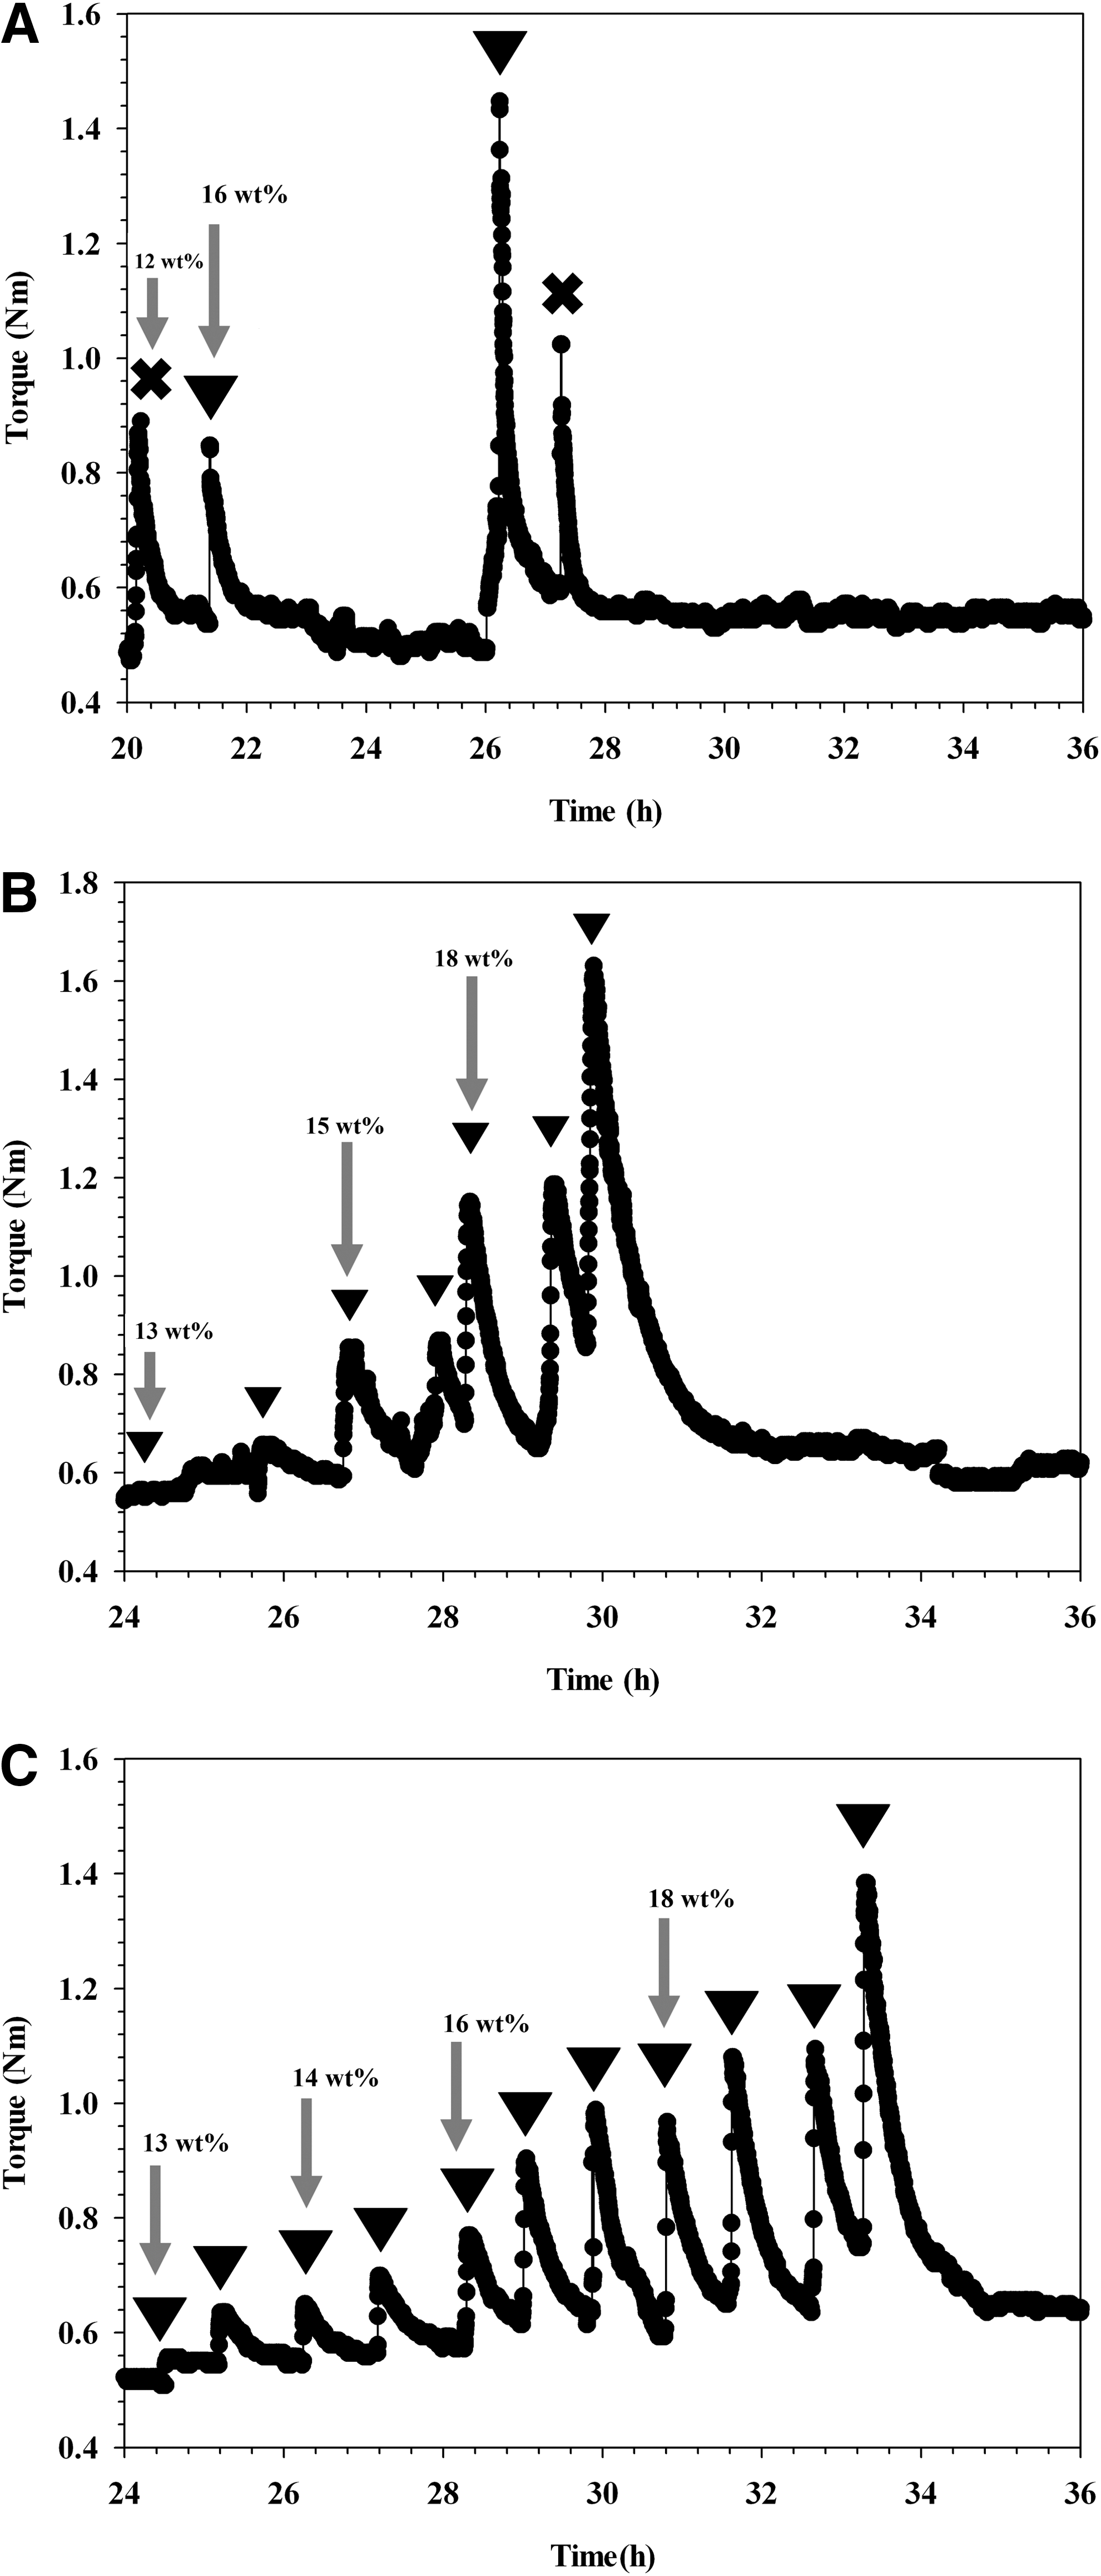
Torque profiles for trials
In trial 1, the final torque profile obtained with a 20 wt% total solids (26.4 h) is consistent with the torque profile reported by Samaniuk et al. during the enzymatic hydrolysis of filter paper at 20 wt%, measured using a torque rheometer (50 mL). 23 These authors reported a rapid torque increase at the start of the reaction, reaching values up to 4 Nm, followed by a drop to less than 0.5 Nm after 10 min. We also observed that the resistance of the slurry to mixing was greater when total solids loading reached 20 wt%; however, as enzymatic hydrolysis progressed, the resistance dropped due to the cleavage of polymer bonds by enzymes, reducing the fiber length and enabling liquefaction of the slurry. 13,24
To examine further the impact of fed-batch operation on the mixing and torque profiles of the slurry, the number of fiber additions was increased from 3 to 14 in trial 2. Seven hourly additions of fiber were performed, targeting an 11 wt% total solids content after 7 h, while the rest of the solids were added in seven equal amounts, commencing at 24 h, ultimately reaching 20 wt% total solids (29.9 h). We hypothesized that this strategy would provide more uniform mixing and improve solids distribution in the slurry, avoiding the formation of the toroid-like slurry rotation observed in trial 1. Moreover, changing the axial-flow impeller diameter (from 4 in to 6 in) was expected to increase the downward force on the fiber/slurry. We hypothesized that this would enhance blending of the low-density, pretreated fibers and reduce accumulation of fibers near/on the surface of the slurry. Visual inspection confirmed our hypotheses; smaller, more frequent additions of fiber improved mixing and eliminated the need for manual mixing during the first 10 h of enzymatic hydrolysis (data not shown).
Figure 1B presents the torque profile for trial 2 during the second phase of fiber addition. The data indicate that with each incremental addition of fiber into the slurry, the torque values increased initially, then dropped until more fiber was added. The highest torque value was 1.63 Nm (29.9 h) at 20 wt% total solids content.
In trial 3, the number of fiber additions was increased from 14 (trial 2) to 22, in which the slurry reached 12 wt% total solids content by hour 10 of hydrolysis, while the rest of the fiber was added in 11 equal increments commencing after 24 h of hydrolysis. Figure 1C presents the torque profile for trial 3 during the second phase of fiber addition. From 24-36 h of hydrolysis, the data show a progressive increase in peak torque as each subsequent batch of insoluble solids was added into the system. The highest torque value (1.4 Nm) was reached at a total solids loading of 20 wt% (33.5 h). Furthermore, comparing the torque values obtained during/following the final fiber additions for trials 2 and 3 (Figs. 1B-C) suggests that expanding the number of additions improved mixing and the rheological properties of the high-concentration slurry. In the limit, one could hypothesize that the continuous addition of fiber in the reactor would make it possible to reduce the torque further and decrease (or eliminate) the spikes observed in this study. Future studies should also explore the optimal amount of fiber and water for continuous fiber addition and how to add fiber into the system without affecting mixing. Benson et al. also reported that addition frequency and total duration of fiber (corn cobs) addition greatly influences the operation of fed-batch reactors. 25 They found that fiber addition every 105 min maintained a liquefied slurry, resulting in better mixing within the reactor. In addition, smaller and more frequent additions of fiber could control the release of glucose, reducing product inhibition. The performance of exoglucanases and endoglucanases would be negatively impacted by product inhibition, potentially decreasing the conversion rate of glucan to glucose. Unproductive adsorption of cellulases onto lignin and the inhibition of the enzymes by phenolics can also affect the enzymatic activity. 26 –29
Effect of Fed-Batch Operation on Enzymatic Hydrolysis of Pretreated Hardwood
Figure 2 illustrates the enzymatic conversion in trials 1 and 3. In trial 1, the glucan conversion was 12% after 2 h of hydrolysis and increased to 22% after 48 h of hydrolysis. By comparison, a progressive increase in glucan conversion was observed in trial 3, from 2% after the first hour of hydrolysis, to 25% after 48 h. These results indicate that the frequency and amount of solids added can affect the mixing performance, contributing to maintenance of an optimal pH or temperature for enzyme function.
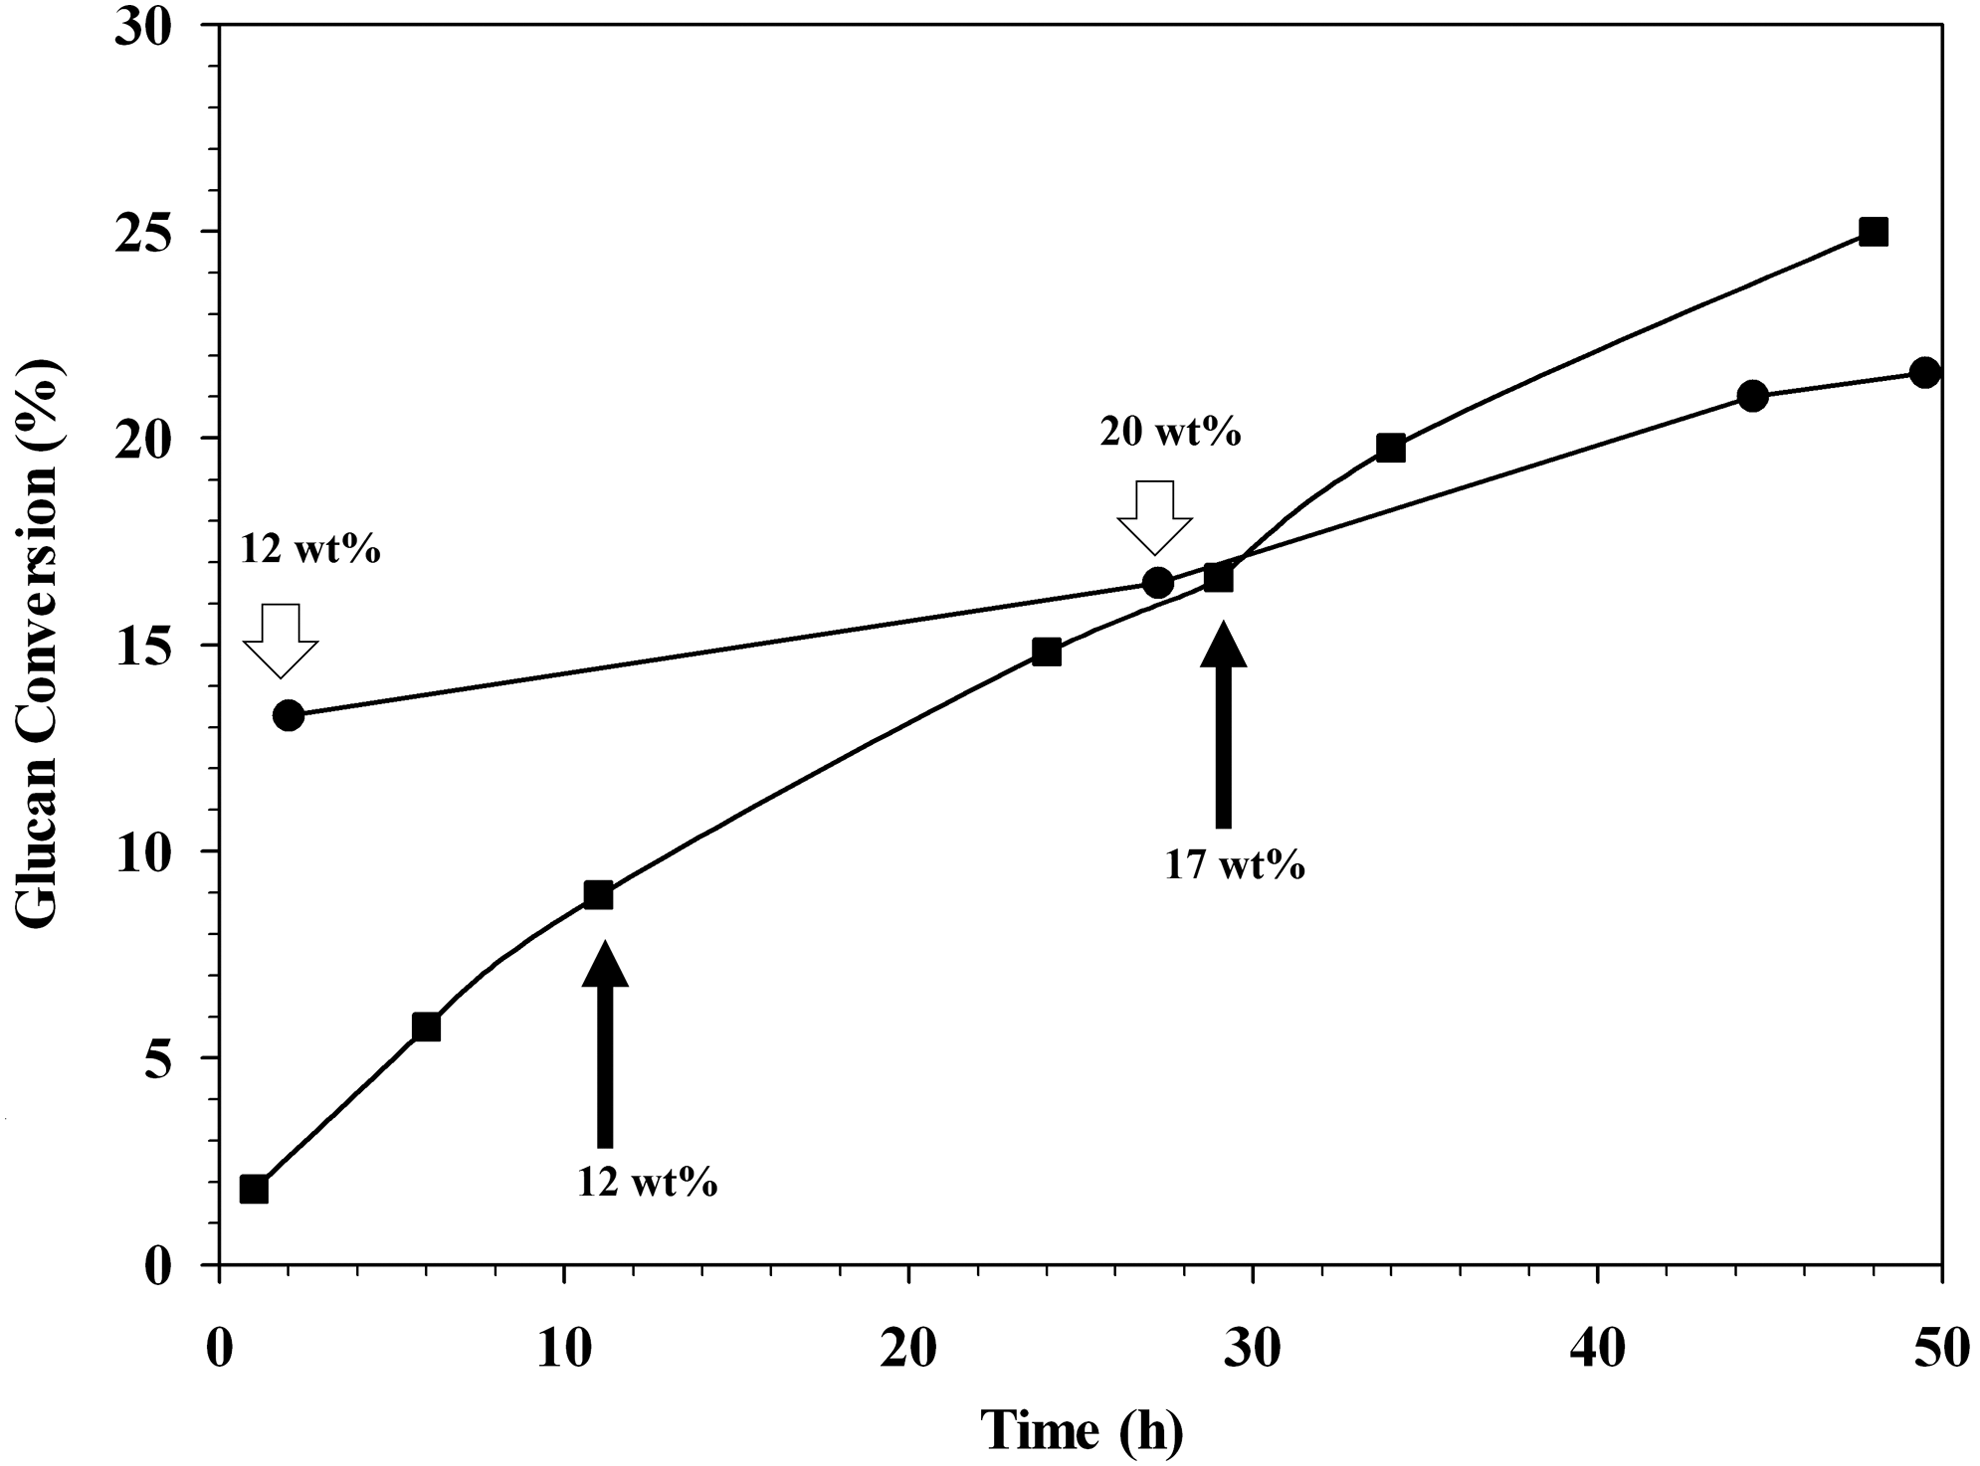
Effect of number and frequency of solids addition on the enzymatic hydrolysis of trials 1 and 3. The circles (•) and squares (■) represent the glucan conversion profile for trials 1 and 3, respectively. Rotational speed: 150 rpm. The arrows with wt% values indicate the total solids loading at that point in the experiment, based upon the fiber addition strategy employed.
Impact of Moderate Rotational Speeds on Mixing of the Slurry and Glucan Conversion
Previous high-solids enzymatic hydrolysis experiments have generally been conducted at high rotational speeds (120–500 rpm) in vertical stirred reactors and in rotary shakers. 5,15,20,21,30 High rotational speeds are often required to decrease the apparent viscosity of the slurry and to reduce stagnant areas in the system; however, a high agitation speed results in high energy consumption to maintain a homogeneous slurry and obtain adequate glucan conversion. Therefore, trials 4 and 5 were set up to identify the feasibility of decreasing the rotational speed while aiming to avoid stagnant zones.
Trial 4 used the same impeller configuration as in trial 3, but the rotational speed was decreased from 150 rpm to 60 rpm. Setting up and operating the reaction this way effectively blended the slurry up to the eighth addition of fiber (9.6 wt% total solids in the slurry). However, during the final two additions, solids agglomeration was prominent on the side walls and at the bottom of the reactor, indicating that the current impeller configuration at 60 rpm was unable to achieve proper blending of the entire slurry.
During the initial set of trials, it was observed that as the slurry was subjected to higher shear rates, the apparent viscosity decreased and vice versa. 5,31 Ex situ methods have shown the inverse correlation between viscosity and shear rate; however, these observations were based on trials using high rotational speeds. 32,33 To promote mixing at lower rotational speeds, the diameter of the upper axial-flow impeller was increased in trial 5 (from 6 in to 8 in OD), increasing the shear rate. The number of fiber additions was also increased (from 10 to 14) during the first 24 h of hydrolysis. After 24 h, the total solids content reached 16 wt%. These changes were expected to improve mixing, reduce stagnant zones, and decrease the apparent viscosity of the slurry, especially during the second phase of fiber addition. The larger impeller diameter and more frequent fiber additions led to a more uniform slurry, and stagnant zones were not observed. Moreover, the improved mixing in trial 5 would also be expected to enhance enzyme distribution, and operation at a lower rpm, would probably decrease the shear stress imposed on the enzymes, which could otherwise change their three-dimensional structure and adversely affect their performance. 34,35
Figure 3 shows the torque profile for trial 5 during the second phase of fiber addition. The peak torque observed after 25.5 h was due to a brief increase in rotational speed from 60 rpm to 100 rpm, which was maintained for 1 h to assist in fiber blending. Generally, as fiber was added into the system, there was a progressive increase in peak torque, reaching a maximum value of 1.3 Nm at 20 wt% total solids content during the final fiber addition (29 h). Comparing trial 3 (1.4 Nm) and trial 5 (1.3 Nm), the torque differed by one order of magnitude, which may be attributable to the lower rotational speed (150 versus 60 rpm) and is consistent with the less viscous slurry that formed in trial 5 compared to trial 3. To quantify the changes in slurry viscosity, future studies should focus on developing in situ methods that can capture the shear rate and viscosity of the system as hydrolysis proceeds in vertical stirred tank reactors. Finally, the difference in final peak torque shows that the force required for mixing the slurry can be affected by the fed-batch strategy, impeller type, and agitation speed. Using a higher rpm for the same number of fiber additions and conditions as in trial 5 could overcome mixing limitations, increasing the Reynolds number to ensure operation on a turbulent regime. However, such an increase in mixer rpm can increase power requirements and decrease enzyme activity. 35,36

Torque profiles for the second phase of hydrolysis in trial 5. Rotational speed: 60 rpm and 100 rpm (25.5–25.9 h only). Triangles represent the addition of new insoluble solids; star symbol represents the temporary increase in rotational speed from 60 rpm to 100 rpm for 1 h of hydrolysis. Wt% values indicate the total solids loading at that point in the experiment.
Table 2 presents the total energy and peak power consumption for trials 2, 3, and 5. The energy consumption was 0.46 kWh (trial 2), 0.43 kWh (trial 3), and 0.14 kWh (trial 5) for 48 h of hydrolysis. Thus, by using lower rotational speeds, the total mixing energy requirement was significantly reduced. Moreover, the peak power consumption was calculated from the final fiber addition to illustrate an extreme case of process operation. For trials conducted at 150 rpm, the peak power consumption was 2.6 kW/m3 for trial 2 (14 additions) and 2.2 kW/m3 for trial 4 (22 additions). In contrast, trial 5 (60 rpm) showed a substantial reduction in power consumption to 0.82 kW/m3. Thus, the differences in power consumption values reported at lower and higher rotational speeds clearly illustrate the potential of implementing feeding strategies coupled with mixer design parameters to ensure adequate slurry mixing, manage the rheological behavior of the slurry, and decrease operational costs.
Figure 4 presents a comparison of glucan conversion for trials 3, 4, and 5 over the course of hydrolysis. The differences among the trials are the upper axial impeller diameter and the addition frequency of fiber. Although trial 3 and trial 4 reached the same glucan-to-glucose conversion (25%) after 48 h, a small difference in conversion was noticed after 24 h of hydrolysis. The 24-h conversion reached 15% (trial 3) and 17% (trial 4), suggesting that reducing the agitation speed positively impacted conversion. Nonetheless, as solids concentration increased in trial 4, mixing challenges increased, contributing to reduced enzyme-substrate interactions and potentially increasing pH and temperature gradients, leading to a comparable final conversion. On the other hand, the conversion increased to 44% at the end of the hydrolysis in trial 5, suggesting that the larger diameter impeller and more frequent fiber additions dramatically improved mixing in trial 5 compared to trial 4. Hence, these results demonstrate that tailoring of the mixing and the feeding strategies can significantly affect biomass conversion during hydrolysis of high-concentration slurries and decrease both energy and peak power demand. These factors could positively impact systems operating at higher solids as mixing improves the interaction between enzymes and solids, leading to lower torque and better liquefaction of the slurry and yields.

Effect of impeller configuration and rotational speed on glucan conversion profile during enzymatic hydrolysis for experiments conducted in a 20L Chemglass reactor. The squares (■), triangles (▲), and diamonds (♦) represent the glucan conversion profile for trials 3, 4, and 5, respectively. Rotational speed: 150 rpm (trial 3) and 60 rpm (trials 4 and 5). The arrows with wt% values indicate the total solids loading at that point in the experiment, based on the fiber-addition strategy employed.
A side-by-side comparison of trials 5 and 6—which had the same operating conditions, namely, feedstock, feeding strategy, rpm, and axial-radial impeller—was performed to assess reproducibility. A slight difference between both trials, however, was the impeller rotation: trial 5 used clockwise rotation and trial 6 used counter-clockwise rotation. Although the impeller rotation was different, similar glucose yields were obtained for both trials, confirming reproducibility (Fig. S4)
Further studies using different impeller configurations in stirred tank reactors have the potential to identify opportunities to reduce power consumption even more. For instance, a reactor run at lower torque value (approximately 0.5 Nm) and lower rotational speed (45 rpm) could reduce power consumption to 0.20 kW/m3. This value matches that of Dasari et al., who reported power demand for a horizontal bioreactor run at 2 rpm and 20 wt% solids content. 14 Of course, any change in rotational speed (and power demand) must not come at the expense of hydrolysis performance.
Conclusions
The results of this study show that fed-batch operation involving multiple additions of pretreated biomass can reduce the uneven mixing observed during conventional batch enzymatic hydrolysis at high-solids concentration. Moreover, torque profiles can be monitored to quantify the force required to mix the slurry, which is directly correlated with power consumption. An important observation is that mixer torque values and power demand are strongly influenced by feeding strategies, with a lower torque obtained with smaller, more frequent additions of fiber substrate. This enhances management of the rheological properties of the system and can improve enzymatic hydrolysis performance. Understanding the shear-thinning behavior of the slurry also makes it possible to modify the mixer system, decreasing the rotational speed from 150 rpm to 60 rpm, which reduces operating costs. Ultimately, the previously mentioned design changes, involving more-frequent fiber addition and larger-diameter impellers, improved glucan conversion and slurry mixing while reducing torque and power demand.
Footnotes
Acknowledgments
The authors gratefully acknowledge the financial support of the Natural Sciences and Engineering Research Council of Canada (NSERC, Ottawa) Bioconversion Network, and thank Mascoma Canada for providing the pretreated hardwood substrates.
Author Disclosure Statement
No competing financial interests exist.
References
Supplementary Material
Please find the following supplemental material available below.
For Open Access articles published under a Creative Commons License, all supplemental material carries the same license as the article it is associated with.
For non-Open Access articles published, all supplemental material carries a non-exclusive license, and permission requests for re-use of supplemental material or any part of supplemental material shall be sent directly to the copyright owner as specified in the copyright notice associated with the article.