
Abstract

Introduction
Algae have become an area of intense research within the industrial biotechnology marketplaces. They have the potential to serve as attractive, renewable sources for fuel, feeds, and other products such as plastics, chemical feedstocks, lubricants, and fertilizers. Algae are appealing as a potential source for these products for a number of reasons: they grow fast in relatively simple environments; have high yields per area needed to grow them; absorb carbon dioxide during growth while releasing oxygen; and, unlike some other biomass sources, do not compete with agriculture because they can be grown in areas not used for normal agricultural purposes.
Just as any farmer would need to “walk the crops” to inspect for growth, potential diseases, water needs, etc., so must the algae farmer be able to do a similar analysis of his crop. Since algae are microscopic in size, it is important to find ways of rapidly characterizing these subvisible organisms in order to monitor their growth, composition, and purity properly. Previously, the only way of doing this had been through manual microscopic analysis. Since manual microscopy is labor intensive and requires skilled operators to interpret the imagery, it is impossible for a microscopist to analyze statistically significant population samples in a timely fashion.
A new technology, dynamic imaging particle analysis (DIPA), is now available that enables the algae grower to analyze large, statistically significant populations of algal cells rapidly in an automated fashion. Not only can this technology count algal cells, but through its use of imaging it can also analyze each cell to determine its type. Since most algal stocks are monocultures, this analysis is critical for characterizing the purity of the stock, and for identifying predators such as rotifers that will feed on the algal stock.
Historical Algae Analysis
Since the introduction of the microscope in the 1600s, microscopy has been the primary method for all subvisible particle/cell analysis. 1 The microscope serves merely as a visualization tool allowing the human eye to see objects smaller than would be visible with the unaided eye. Beyond mere visualization, though, it is the human eye/brain that does all of the interpretation of the images, which usually includes counting of the cells, measuring their size, and also characterizing their species. Figure 1 shows a typical microscope workstation, where the operator uses the object on the left-hand side to “bin” the algal cells into different species categories.
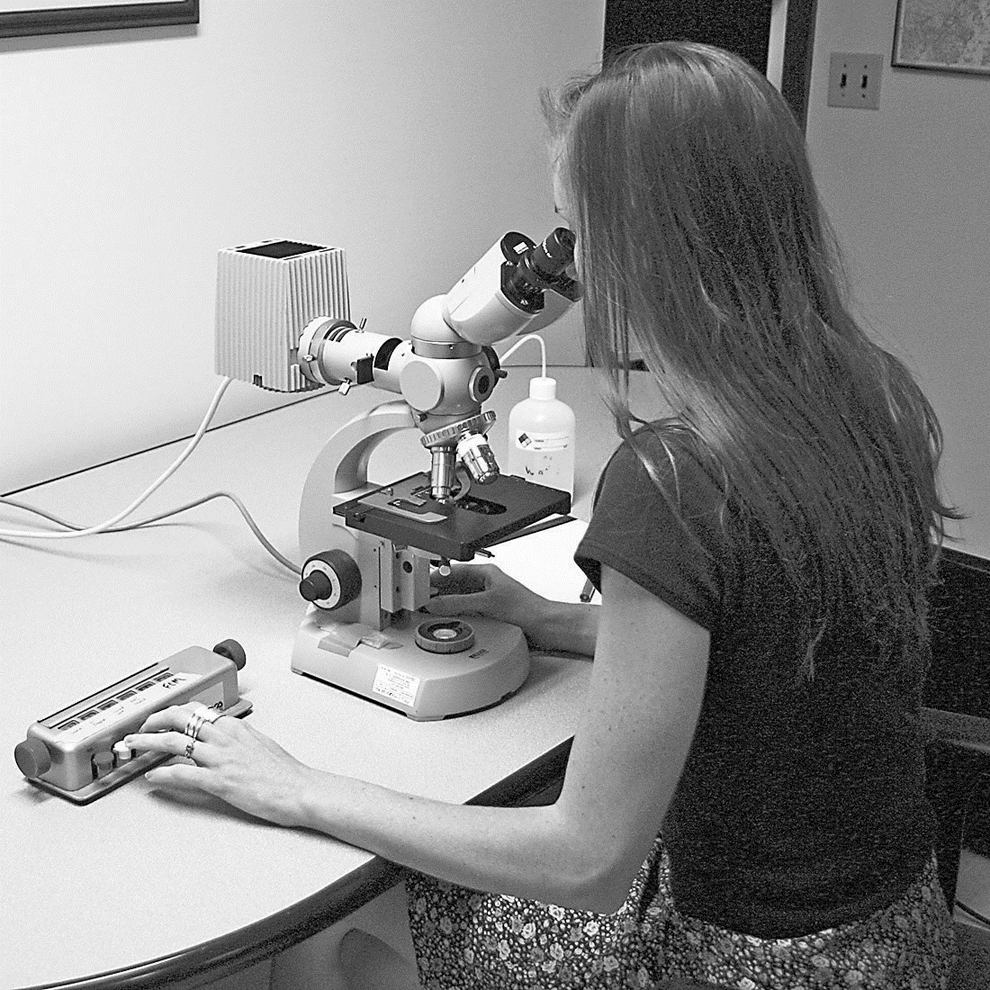
Microscope in use; cell counting device on left.
Microscopy is the definitive way to characterize algal cells due to the fact that the human eye/brain has the ability to see very subtle differences in cell morphology when characterizing a sample. Unfortunately, when it comes to classifying algal types in this fashion, the operator has to be of a fairly high skill level to have good confidence in the results. Add to that the fact that manual microscopic classification is a very time consuming operation and the costs, both in time and personnel, can escalate rapidly. This is further compounded by the fact that measuring and characterizing a statistically significant population of cells is almost impossible due to time constraints. It is analogous to trying to characterize a train-car load of dry powder by looking at a teaspoonful size sample.
Beginning in the early 1960s, laboratory instruments became available for particle analysis that attempted to overcome the limitations of manual microscopy noted above, such as Coulter counters, laser diffraction systems, and light obscuration systems. 2 These instruments represented a quantum leap in the amount of data that could be quickly gathered from a sample; they were capable of measuring particle size on thousands of particles in minutes. This meant that particle size distributions of algae samples could be generated quickly with much higher degrees of statistical confidence than possible through microscopy.
These new instruments most often operate on a volumetric-based measurement principle: the instrument measures a signal that is proportional to the particle's or cell's volume. 2 By comparing the signal produced for the cell/particle against the signal produced for traceable standard particles, one is able to infer the volume of the unknown particle being measured. Since the aim is to have a single measurement of particle size for each particle, an assumption is made that all particles (including the standards) are perfectly spherical in shape. The system's software then converts the calculated volume for each particle into an Equivalent Spherical Diameter (ESD). When ESD is plotted against frequency or percent volume, the resulting metric is called a particle size distribution (PSD).
The problem with volumetric-based measurements as described above is that the model requires that an assumption be made that all particles are spherical in shape. For a known homogeneous sample (all particles/cells of the exact same type), this is fine. However, most samples in the real world are heterogeneous in nature, containing many different types of particles or species of algal cells. Although generating a PSD is simple, there is no way to differentiate what the distribution actually consists of, and in fact three very different species of algae could be reported as identical in a PSD, as shown in Figure 2. So, if actual characterization of cell types in a sample is important, as is true with algae applications, then these volumetric techniques are not usable, and we are back to using microscopes again!
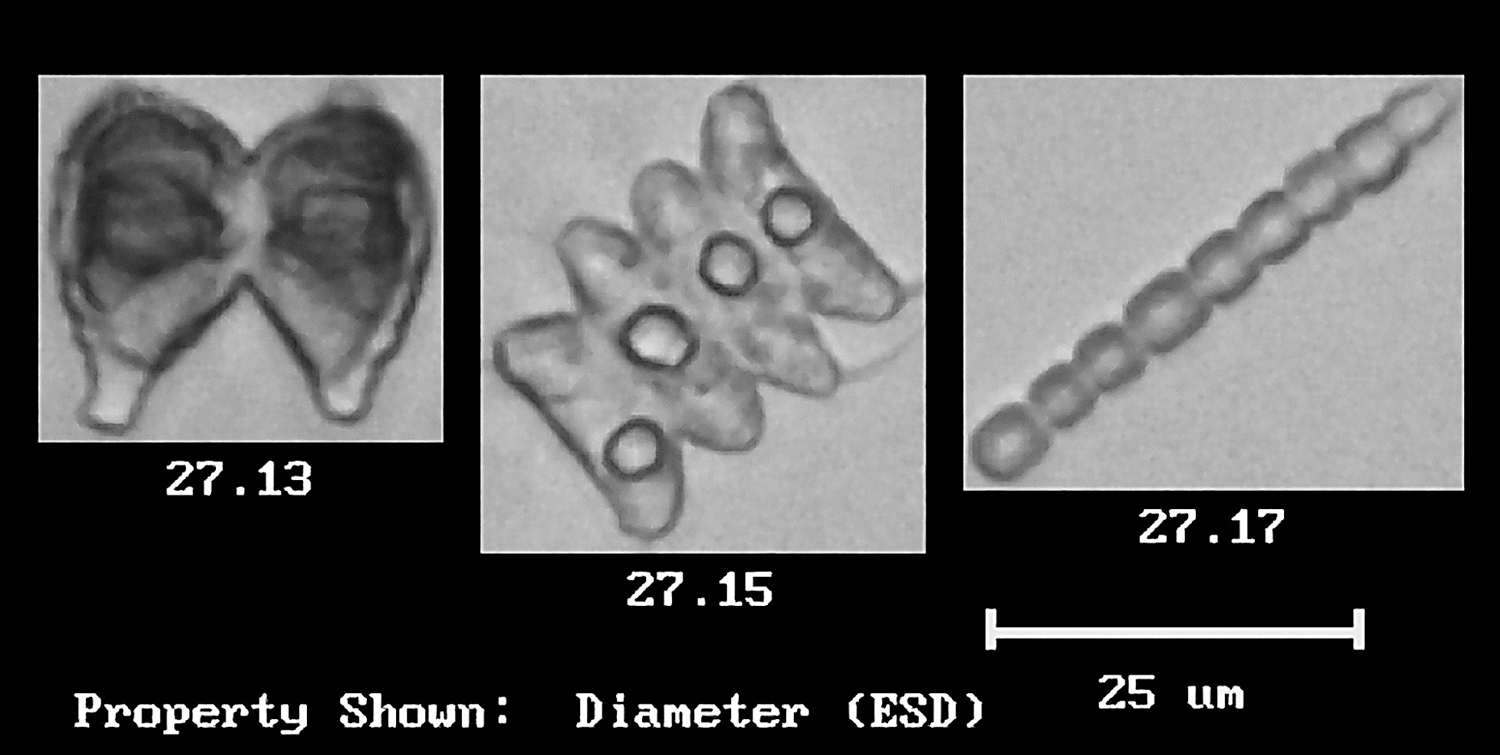
Three different algal cells having almost identical Equivalent Spherical Diameter (ESD).
Dynamic Imaging Particle Analysis (DIPA)
Techniques for the capture and processing of images using computers (digital image processing) began being developed in the 1960s. 3 Unfortunately, the computing power necessary to accomplish this processing was initially extremely expensive, limiting the technology primarily to military applications such as aerial reconnaissance. 2 However, as computing power increased exponentially, while costs decreased at a similar rate, by the 1990s it became possible for researchers in many fields to afford systems for image processing that could automate many of the functions previously possible only by manual microscopy, such as cell sizing, counting, and characterization. Indeed, most of the major microscope manufacturers now offer optional digital image capture hardware and analysis software configured with the microscope. 2
These microscope configurations use static image acquisition to take a digital image of the microscope's field of view. 4 Once the image is acquired on the computer, it can then be analyzed. While static imaging particle analysis offers significant speed advantages and the removal of qualitative operator judgment from the process, it is still time consuming, since it captures only a single field of view of the microscope at a time. Multiple (non-overlapping) fields of view can be captured from a single slide by moving the sample, and multiple slides can be examined to increase the number of cells analyzed, but once again this is time consuming and operator-intensive.
A better solution is the use of dynamic image acquisition, in which the sample is imaged as it is moving through the camera's field of view. 5 This capability required another quantum leap in computing power to be able to process the images in real-time. In late 1998, Bigelow Laboratory for Ocean Sciences (Boothbay Harbor, ME) developed the first such system for the analysis of plankton in ocean water. 6 Oceanographic researchers from around the world were exposed to the system and, in 1999, Fluid Imaging Technologies was incorporated to commercialize the technology as FlowCAM®, the first commercially available dynamic imaging particle analysis system.
FlowCAM uses dynamic image acquisition to image large amounts of sample moving past the microscope optics in real time, as shown in the system block diagram in Figure 3. A high speed flash located behind the sample backlights it, with the flash being synchronized with the camera shutter; this effectively “freezes” the motion of the sample. The liquid containing the particles passes perpendicular to the optical axis through the use of a narrow flow cell. The flow cell is characterized by its depth perpendicular to the optical axis. In order to keep the particles in focus, the flow depth is restricted so that the particles remain in a plane of best focus perpendicular to the optical axis. This concept is similar to the effect of the microscope slide plus cover slip in a static imaging system. Since depth of field decreases exponentially with increasing magnification, the depth of the flow cell must be narrowed significantly with higher magnifications.
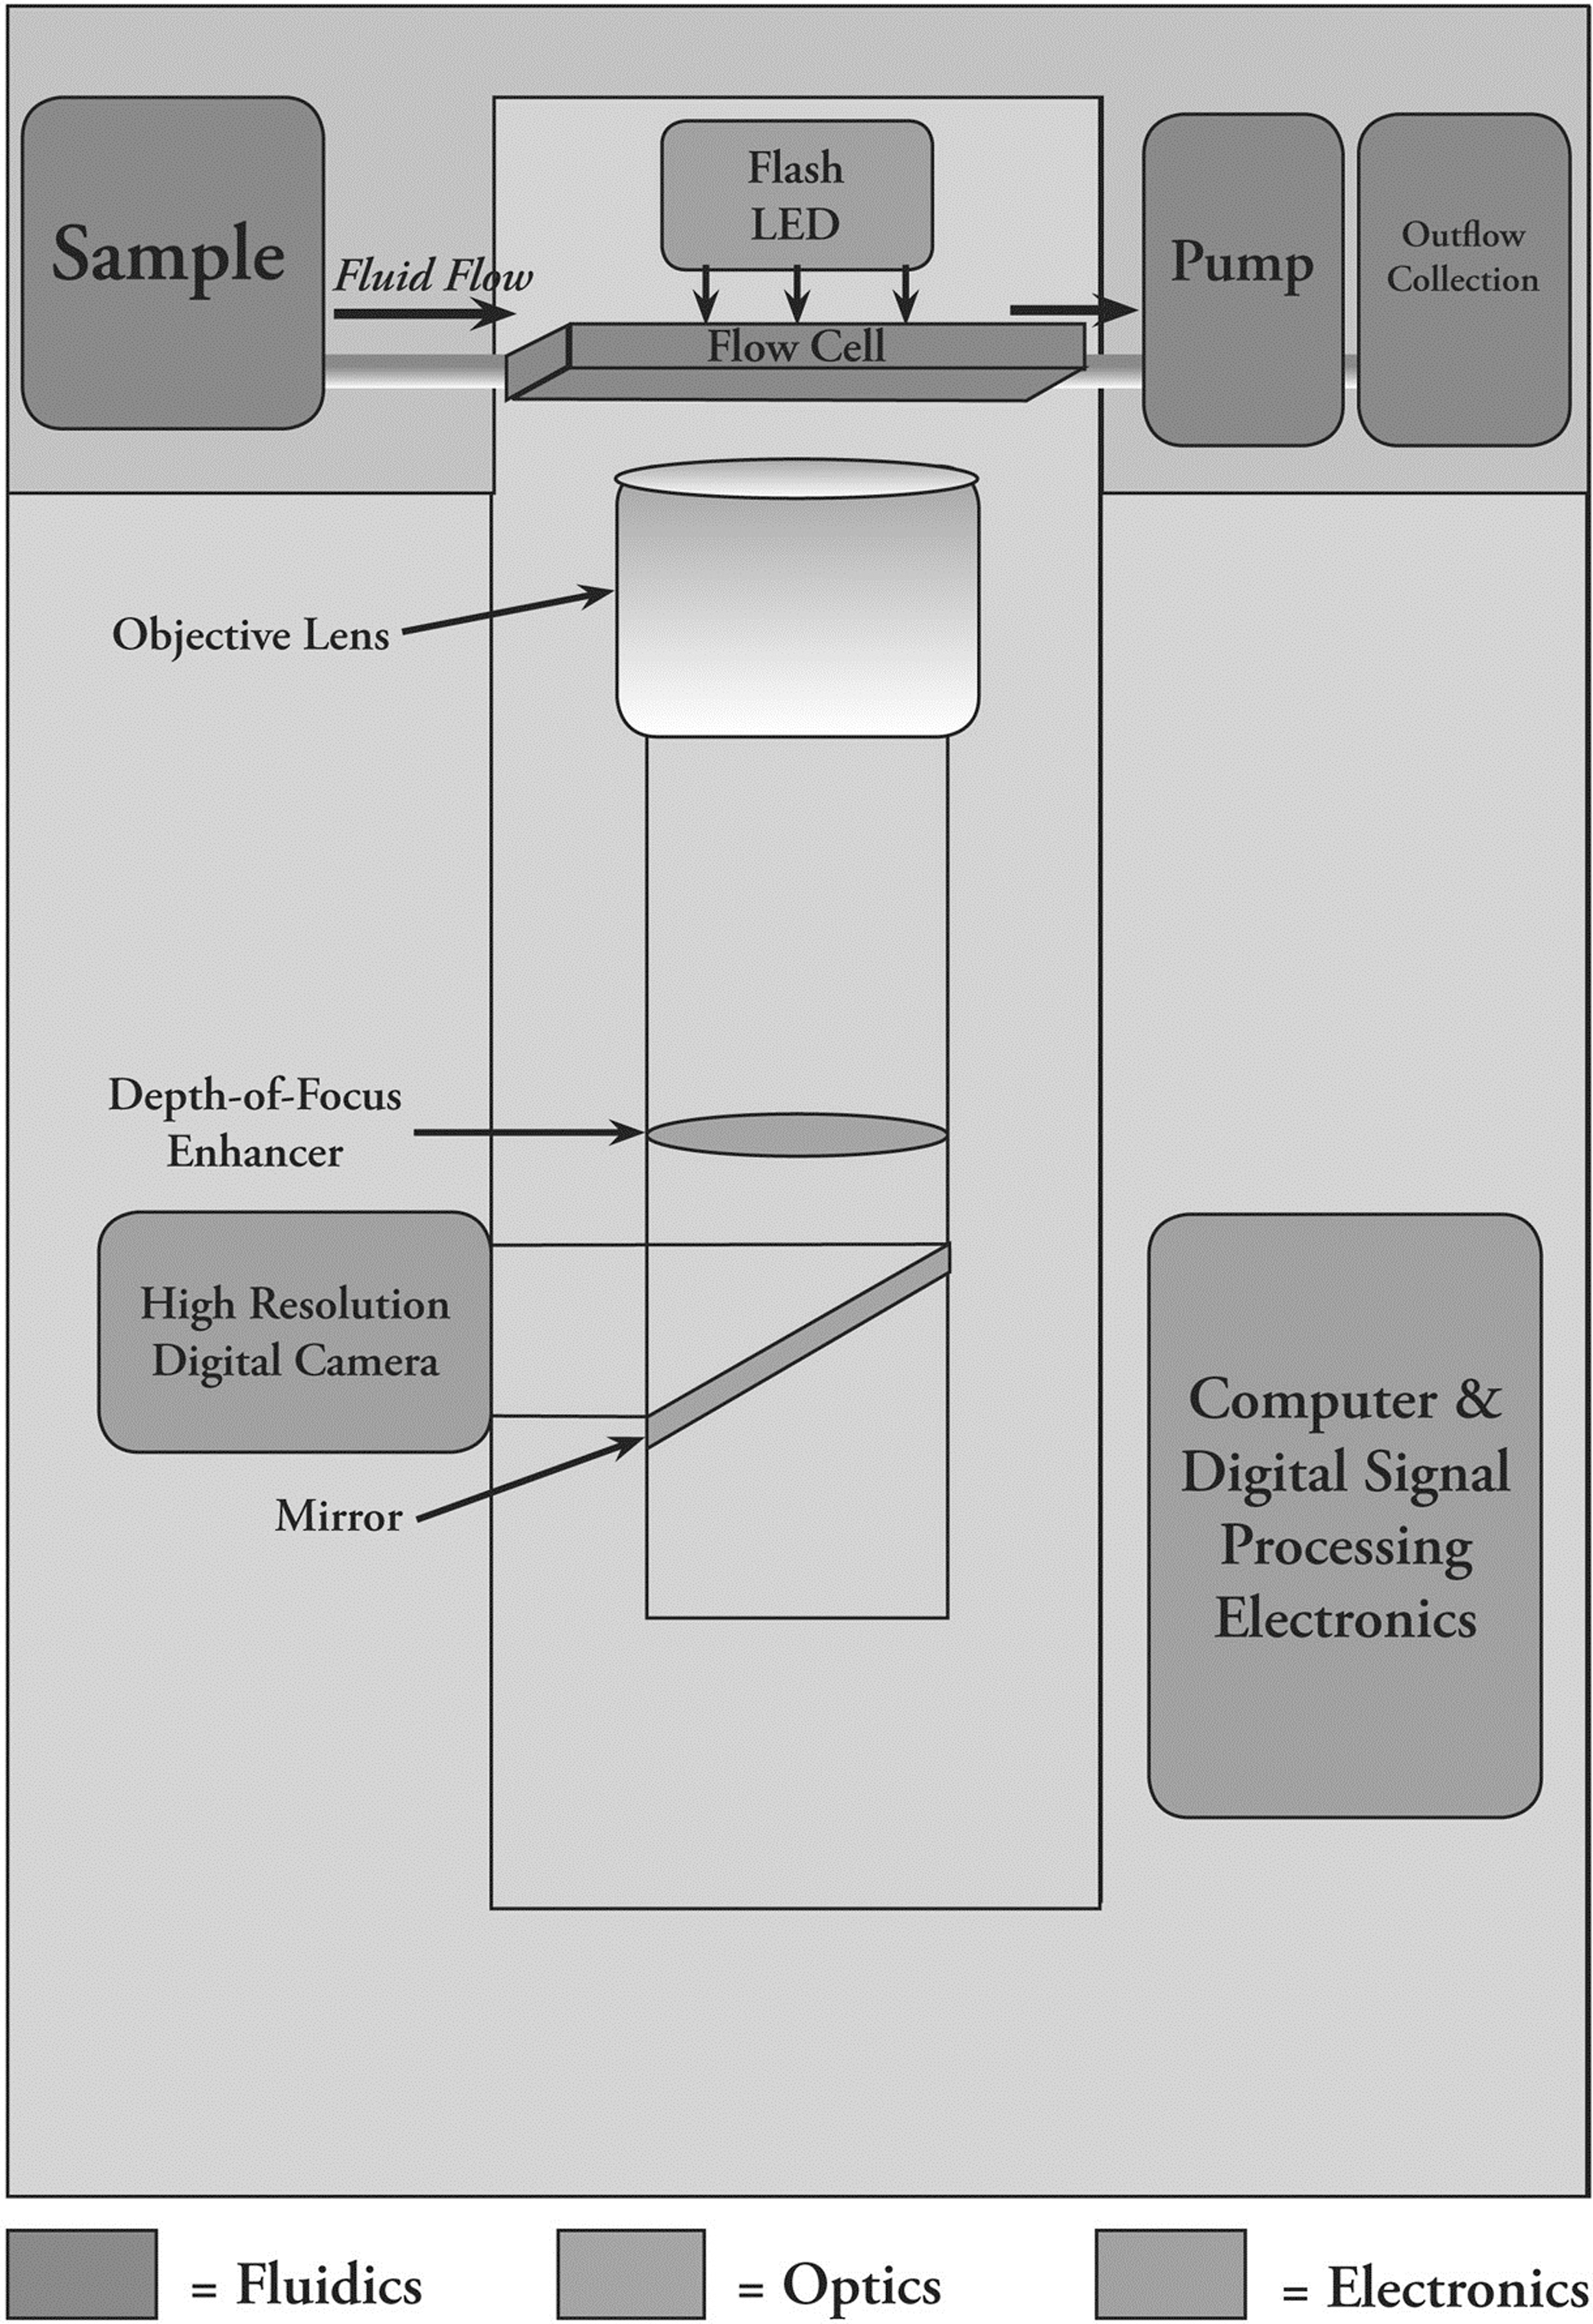
FlowCAM architecture block diagram.
The FlowCAM computer processes each single frame of the microscope field of view of the flow cell in real time. To save storage space, the entire image field is not stored. Instead, the computer creates a sub-image by forming a “bounding box” around each particle in the image field and storing only the particle images on disk. Gray scale thresholding is used to separate particles from the background, based upon a stored image of the background with no particles present. As each particle image is acquired, measurements (more than 30 potentially) of particle morphology such as length, width, ESD, circularity, etc., are stored in a spreadsheet and indexed to the image. Gray scale measurements such as intensity, transparency, and color information are also stored for each particle. Figure 4 shows a screen capture taken during FlowCAM acquisition to illustrate the scope of the image and analytical information collected and stored.
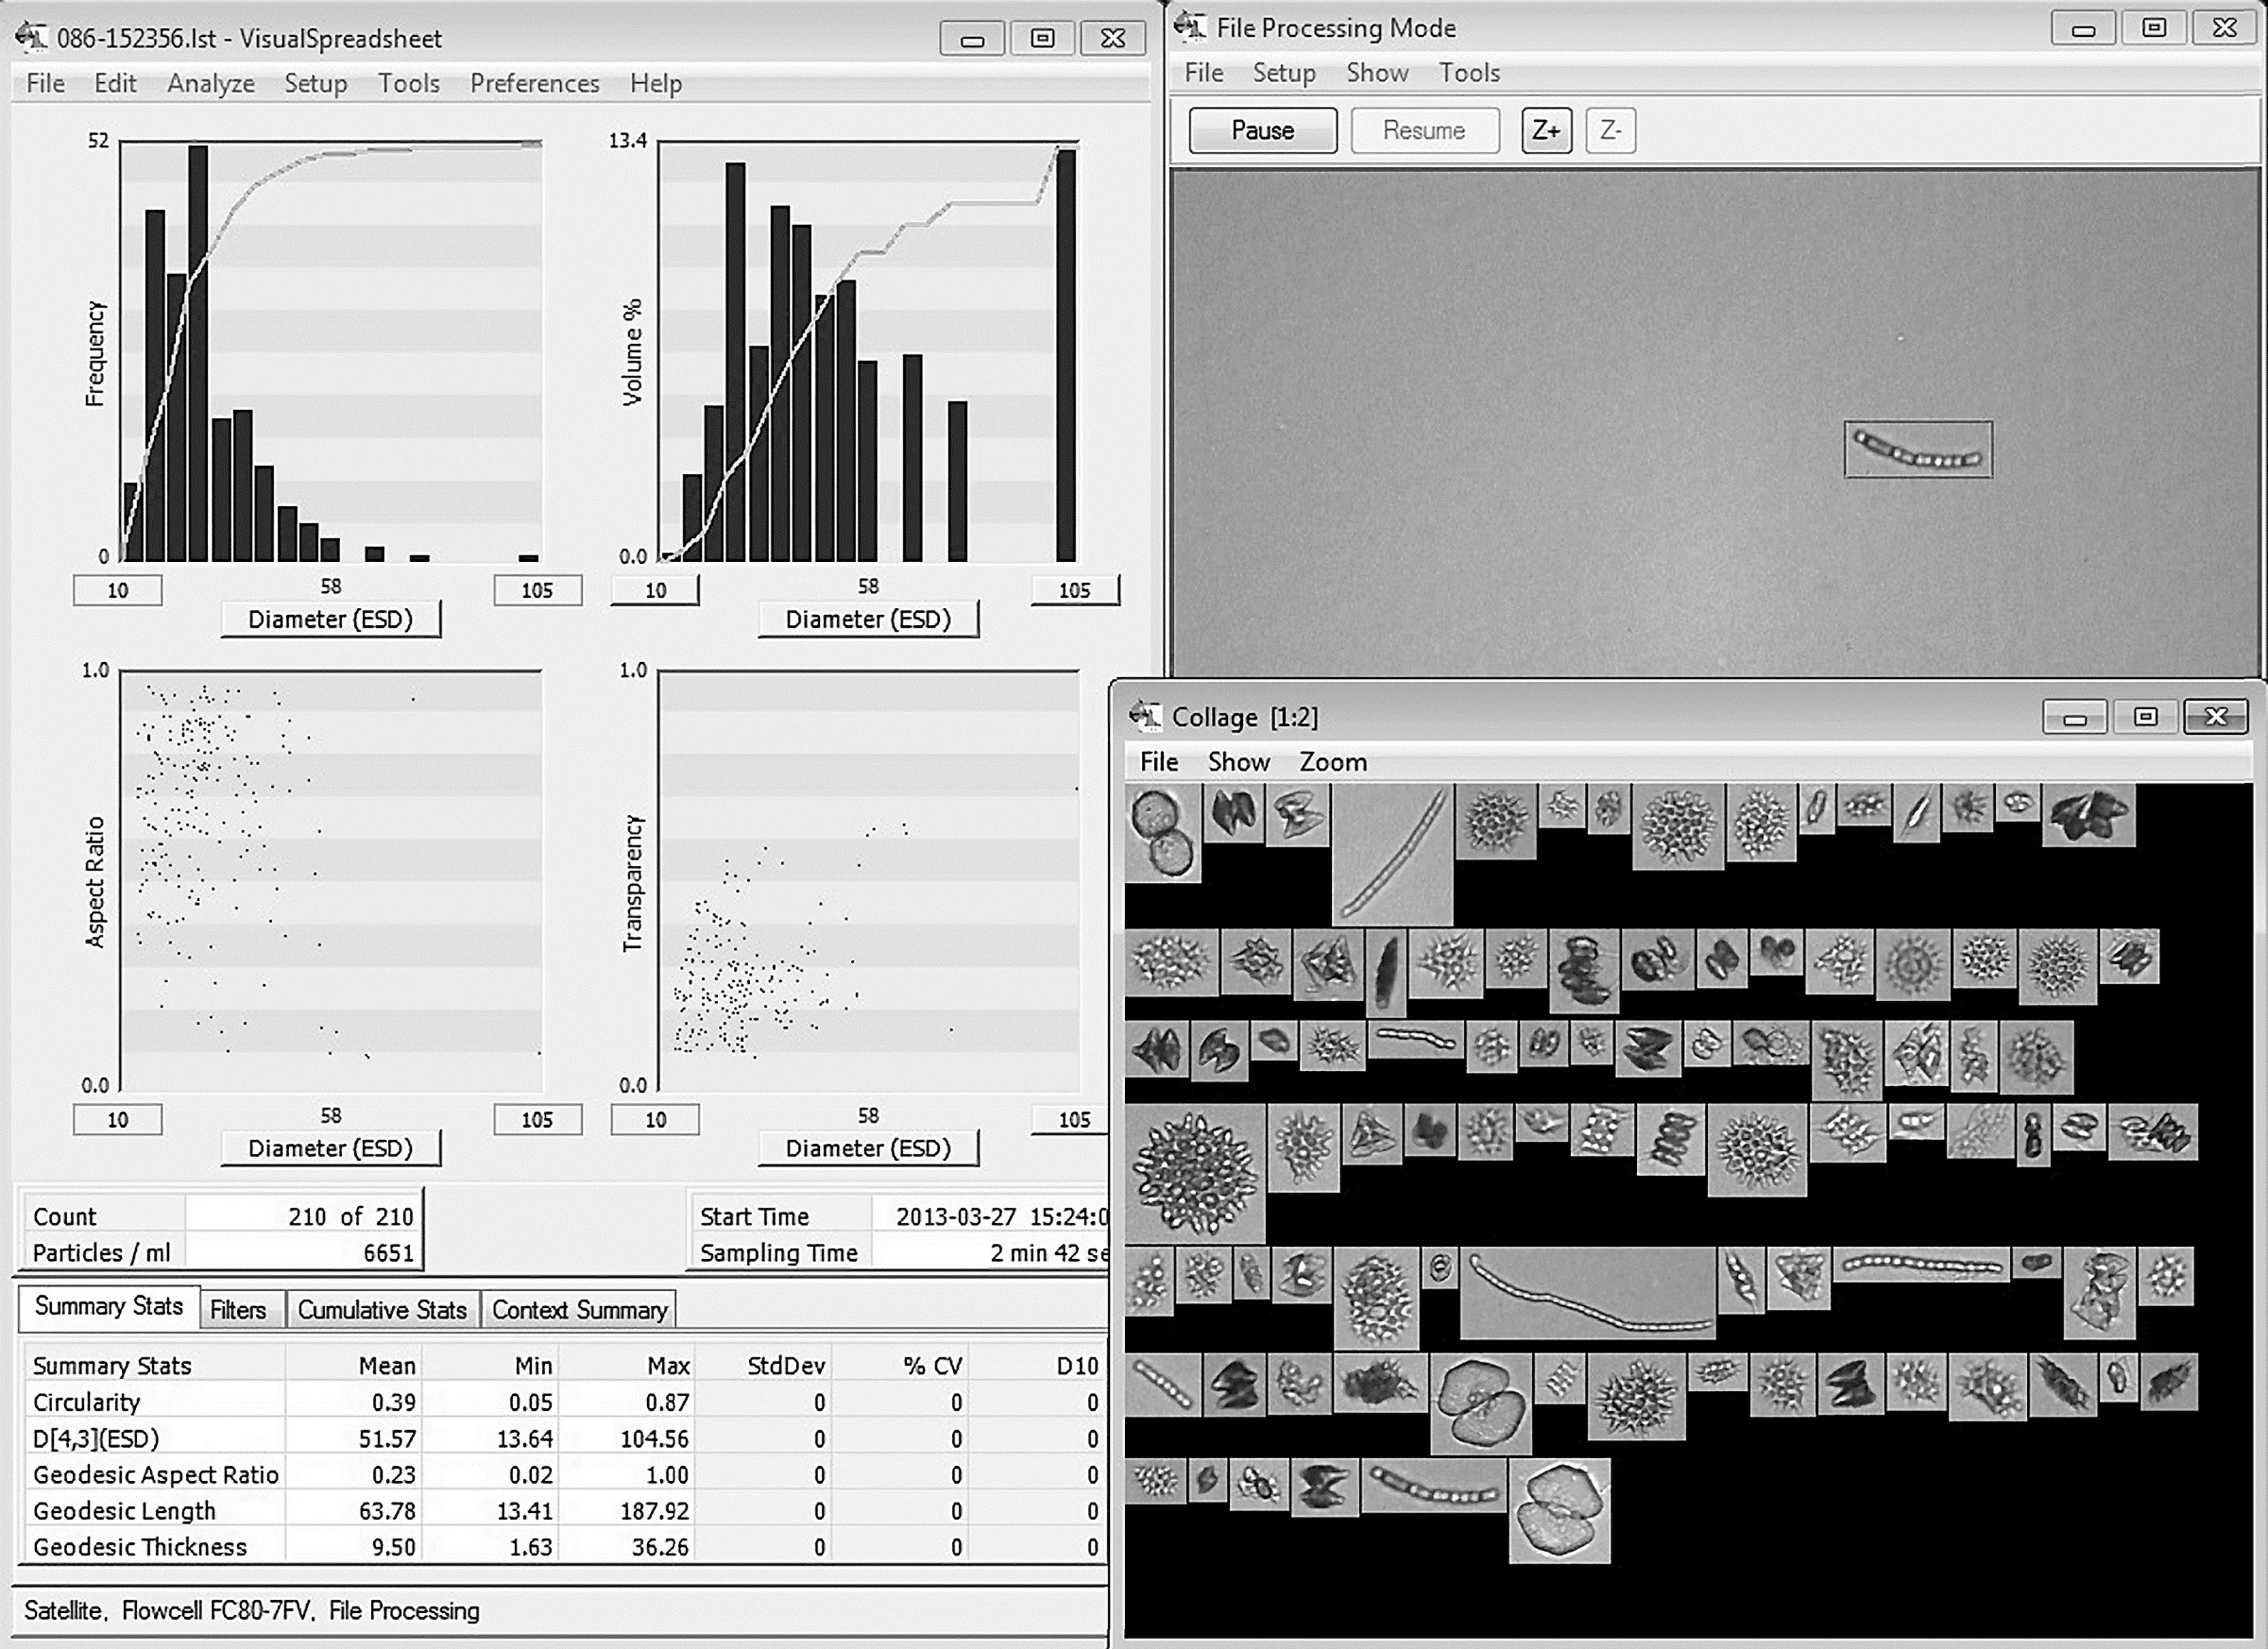
FlowCAM screen during image capture. Upper right window is full field-of-view of camera on the flow cell. Boxes indicate particles found. Lower right window is the “collage window” of particle images that are saved and stored. Main window (left side) shows particle measurements summary graph and statistics saved.
One of the most powerful features of FlowCAM is the potential for post-processing of data using the accompanying VisualSpreadsheet® software. As the name implies, this software allows the operator to perform spreadsheet operations on the data, such as sorting and filtering particles based on any of the measurements (or combinations of measurements) acquired for the particles. VisualSpreadsheet not only displays the tabular results of these operations, but it also presents the results visually in the form of the particle images themselves.
Particle “filters” can be built into the software to isolate particles of a particular type automatically in the sample. By creating, saving, and reusing multiple filters, an operator is able to separate a sample into its component parts based on specific particle properties. These filters can be simple “value filters,” such as are commonly built into a spreadsheet; for example, “find all particles within a specific size range that are long and skinny.” VisualSpreadsheet also offers “statistical filters” based on multi-dimensional pattern analysis. 7 These filters are completely intuitive in that the user can merely click on several images that characterize a particular type of particle and instruct the software to “find images like selected.” The ability to save and reuse these filters eliminates operator bias in the analysis, since the software will perform the same statistical analysis on the particles every time a particular set of filters is used. A white paper is available that provides more detailed information on filtering. 7
Applications of DIPA for Algae Characterization
DIPA systems such as FlowCAM offer a powerful tool for algae analysis in industrial biotechnology applications such as algal biofuels, chemical feedstocks, nutraceuticals, and fertilizers. Different applications require the extraction of different types of biomass from the algae stock, such as lipids, oils, pigments, and proteins. Depending on the application, different species of algae are found that optimize the yield of the specific biomass desired. Once the desired feedstock is found, high capacity production methods are used to produce harvestable amounts of algae stock for the application. These may be monocultures or mixes of several different species.
Regardless of the types of algae being produced, it is critical to be able to characterize the composition of the feedstock in terms of species content, size distribution, and health. Figure 5 shows several different algae species automatically identified by FlowCAM and its software. The various species of algae were automatically characterized using software filters as described above, requiring no operator intervention after initial construction of the filters. FlowCAM can perform this analysis on thousands of algae cells per minute.
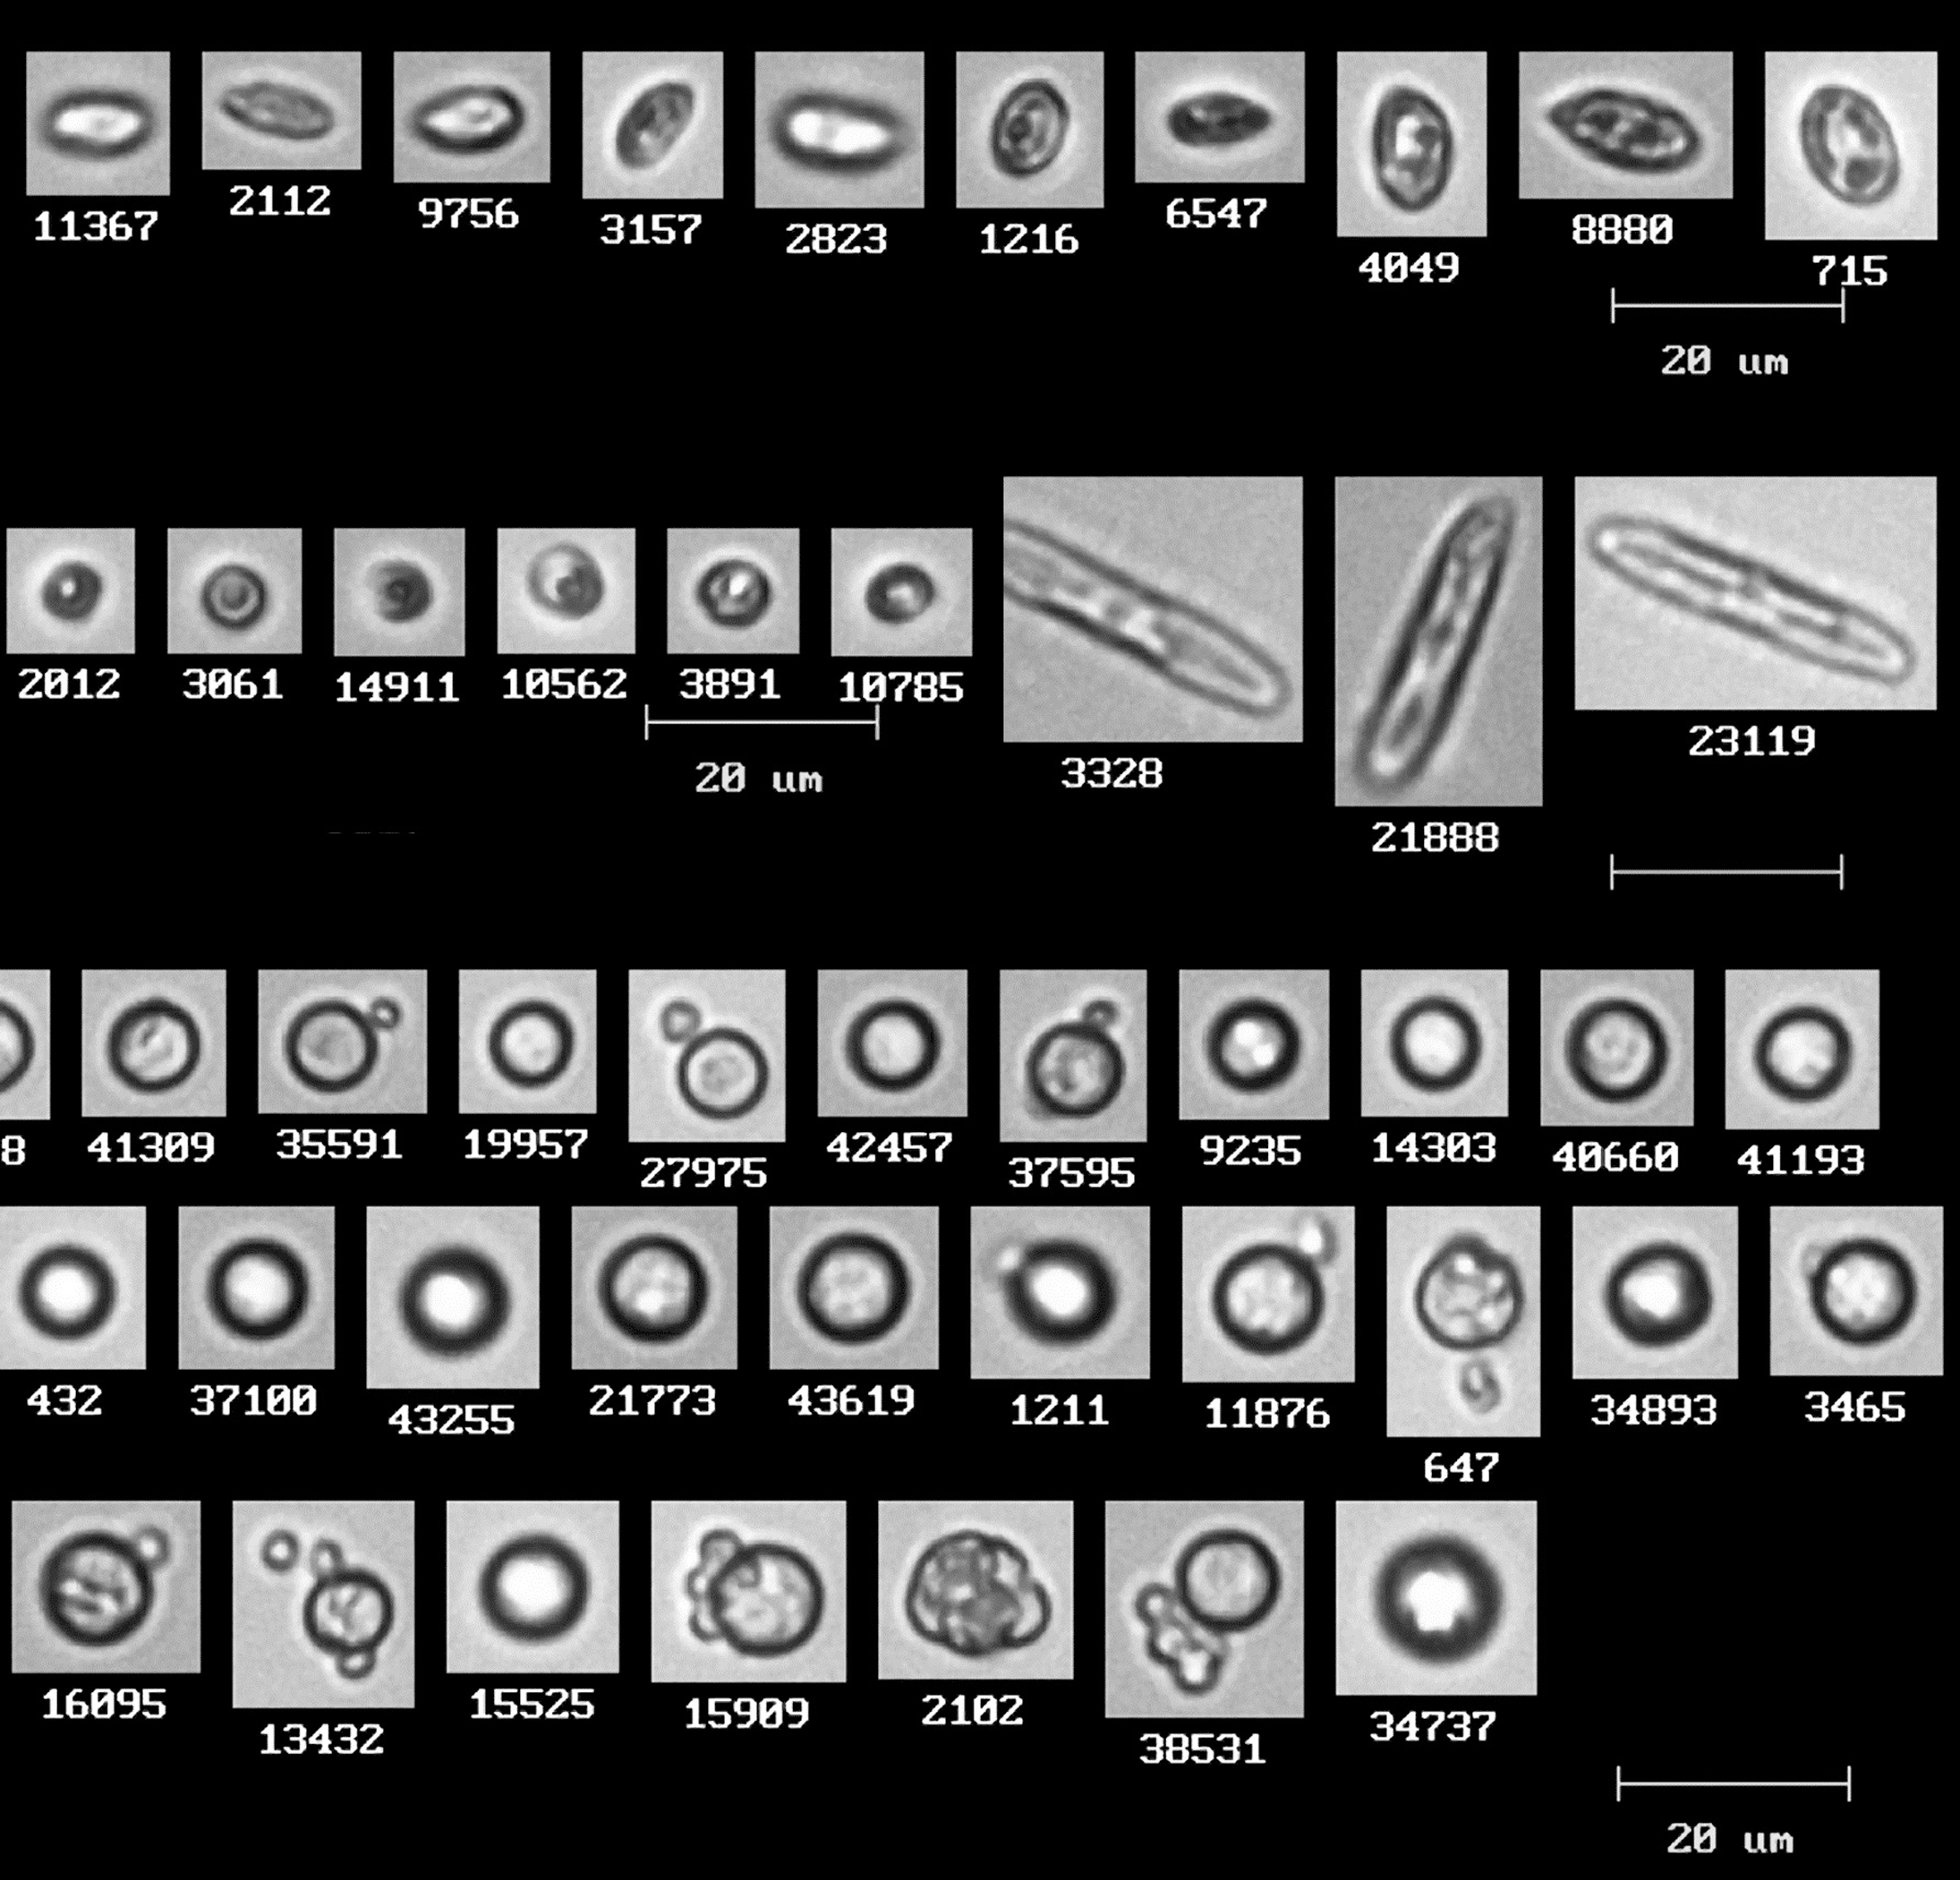
Four different potential fuel feedstock algal species identified using automated filtering (FlowCAM images courtesy of Wiebke Boeing, New Mexico State University).
DIPA systems are currently in use both in research and development and in production environments within the algae technology arena. In R&D, the systems are especially useful for identifying the characteristics of different algae species in order to optimize the desired yield. Some very interesting work has involved the use of staining and fluorescence to quantify lipid content in different species, which is a key parameter for assessing the efficiency of using algae as a source for biofuel. 8 An important area of research focuses on the extraction techniques used to harvest the oils and algal biomass from the feedstock. It is critical that extraction methods in development use the least amount of energy possible, and DIPA technology is a valuable tool for measuring this efficiency. 9 In production systems, particularly open ponds and raceways, the need to monitor for contamination by predators, other algae species, and bacteria is paramount. 10 DIPA provides a high speed, automated strategy for on-line analysis of the feedstock.