
Abstract
Enzymatic hydrolysis is one of the most expensive operations of producing lignocellulosic ethanol, primarily due to high enzyme costs. Enzyme loadings must be reduced, and a well-developed kinetic model that can be easily implemented in process simulation software would greatly assist in determining optimum processing conditions. Oxygen-delignified wheat straw with different lignin contents was subjected to enzymatic hydrolysis at two different enzyme loadings for 72 h. Glucan conversion increased with increasing enzyme loading, decreasing lignin content, and decreasing solids concentration. By measuring total protein concentration and predicting the Novozyme 188 protein concentration, it was possible to calculate the cellulase protein concentration as a function of time. This work is the first report of a mass-based kinetic model capable of predicting glucose production during enzymatic hydrolysis of oxygen-delignified wheat straw, at different cellulases loadings (20 and 40 filter paper units/g glucan), lignin contents (5 and 9 wt%), and solids concentrations (5 to 10 wt% dry basis). The presented hydrolysis model includes a novel lignin factor to describe the amount of cellulases irreversibly adsorbed on lignin. The lignin factor also links glucose production during enzymatic hydrolysis to pretreatment severity. Mass transfer limitations present at 10 wt% solids were accounted for using a diffusion factor. Due to the model's simple solution and use of only five parameters, it can be easily implemented in process simulations.
Introduction
Given the increasing demand for energy, it is important to find alternative energy sources that are abundant, renewable, and economically viable. Lignocellulosic materials are the largest carbon source on earth and can be converted to fuel ethanol via four steps: pretreatment, enzymatic hydrolysis, fermentation, and separation. Commercialization of this process, however, is hampered by the high cost of enzymes and the relatively large enzyme loading required to achieve efficient hydrolysis. 1
Due to the robust and complex structure of lignocellulosic biomass, pretreatment must be completed prior to enzymatic hydrolysis. Pretreatment enhances the overall efficiency of hydrolysis and fermentation by removing structural and compositional impediments. Oxygen delignification, the application of oxygen and alkali at moderate temperatures (90–150°C) and pressures (300–1000 kPa), has been used by the pulp and paper industry to remove lignin. 2 –4 Although the exact mechanism of lignin removal is not yet fully understand, Gierer proposed that lignin's phenolic hydroxyl group reacts with sodium hydroxide to form a phenolate ion, which then reacts with oxygen and superoxides to form the intermediate hydroperoxide. 5 The hydroperoxides may form oxetanes, diooxiranes, muconic acid, and carbonyl structures that ultimately degrade lignin to carboxylic acids, carbon dioxide, and water. 4 Little to no furfural and hydroxymethylfurfural—both fermentation inhibitors—are produced during oxygen delignification of wheat straw, making the process a promising pretreatment for bioethanol production. 6 –9 The primary disadvantage of oxygen delignification in comparison to water-only pretreatments such as steam explosion is the use of sodium hydroxide. Oxygen delignification is used for pretreatment in this study because it removes lignin, produces few fermentation inhibitors, and has already been implemented at an industrial scale.
Enzymatic hydrolysis is a complex heterogeneous process in which cellulose is hydrolyzed by enzymes to glucose. The enzymes can be classified into three groups based on their function. Endoglucanases hydrolyze random internal bonds along the cellulose chain, exposing the ends of individual cellulose chains and disrupting the crystal structure; cellobiohydrolases move along the cellulose chain cleaving oligomers of two to six monosaccharide units from chain ends; and β-glucosidases cleave solubilized oligomers into glucose monomers. 10 Together, endoglucanases and cellobiohydrolases are frequently referred to as cellulases. A number of factors reduce enzyme performance and decrease hydrolysis conversion. These factors include the well-known inhibitory effect of cellobiose on cellulases, enzyme diffusion limitations, and lignin. 11
Lignin reduces the accessibility of cellulose to enzymes and irreversibly adsorbs enzymes through hydrophobic and ionic interactions. 12 –14 It has been reported that up to 70% of total enzyme added can be bound to lignin and that an increase of 15% in lignin content can reduce carbohydrate conversion by 40%. 10,12 The lignin content of biomass changes during pretreatment and thus is one measure of how pretreatment affects enzymatic hydrolysis outcomes.
Many elegant hydrolysis models have been developed but they exhibit a range of limitations that reduce their utility. Zhou et al.'s empirical model predicted glucose production from steam-exploded corn stover as a function of the composition of enzyme preparation. 15 O'Dwyer et al. developed an empirical model capable of predicting sugar production as a function of cellulose crystallinity index, lignin content, and acetyl content. 16 However, application of empirical models is limited to the experimental conditions employed.
Mechanistic models, developed from mechanisms, physical parameters, background theories, and assumptions, provide fundamental insight into hydrolysis mechanisms and promise broader applicability. However, these models often contain numerous differential equations and parameters, making them challenging to implement in process simulations. 17 For example, Zheng et al.'s model employed sixteen parameters to predict glucose concentration during hydrolysis at different enzyme and solids concentrations and background glucose and cellobiose concentrations. 18 Zheng et al. demonstrated the significant impact of lignin on hydrolysis rates and concluded that enzyme loss due to non-productive, irreversible adsorption to lignin must be considered in the development of a reliable, powerful enzymatic hydrolysis model. 18
Shen and Agblevor proposed a simpler mechanistic model requiring only three parameters but determined different values of parameters for each initial enzyme concentration. 11,19 Zhang et al. improved upon this effort by making the model parameters independent of enzyme concentration. 17 Shen and Agblevor assumed enzyme deactivation was due to formation of an ineffective enzyme-convertible substrate complex, while Zhang et al. assumed enzyme deactivation to be the result of end product inhibition (i.e. sugar-enzyme interactions). 11,17,19 Neither study modeled enzyme adsorption on lignin. Despite this omission, the insights from these works are invaluable and establish a base on which to build a new model.
Kinetic models that accurately quantify cellulose conversion, hydrolysis rate, and cellulase deactivation are useful tools for optimization of enzymatic hydrolysis conditions (e.g., enzyme loading, residence time, and solids loading). Numerous techno-economic analyses have provided valuable information regarding the influence of enzyme and feedstock costs on ethanol production. 20,21 However, most studies estimate ethanol costs from a single set of operating conditions with fixed lignin content and sugar yields, making it difficult to assess the impact of individual process variables on the overall system. A model that describes the impact of residence time, enzyme loading, solids concentration, and lignin content on enzymatic hydrolysis, and which can be easily implemented in process simulation software, is needed to optimize enzymatic hydrolysis as part of the overall ethanol production process. To easily implement kinetic models in process simulation software, the model must be based on mass units and employ a limited number of measureable parameters. In this study, a mass-based kinetic model with a limited number of parameters describing the effects of hydrolysis time, enzyme loading, solids concentration, and lignin content was established. This model can be easily implemented in process simulations to optimize enzymatic hydrolysis conditions as part of techno-economic studies.
Materials and Methods
Feedstock
Wheat straw was ground to pass through a 1-mm mesh sieve and stored at 4°C. The straw was warmed to room temperature prior to use. Biomass moisture content was determined following the methodology reported by Sluiter et al. 22 Composition of the raw substrate (Table 1) was determined (process described below).
Composition of Raw and Pretreated Wheat Straw
Solids recovery = (mass of dry pretreated wheat straw)/(mass of dry raw wheat straw); bDM, dry matter; cσ = Standard deviation.
Pretreatment
Wheat straw was pretreated by oxygen delignification in a 1-L reactor (Parr 4520, Moline, IL). The reactor was charged with 500 g of aqueous caustic (NaOH) biomass slurry with 4 wt% dry biomass and 6–10 wt% caustic/dry biomass. The reactor was sealed and purged with nitrogen in order to remove oxygen. The vessel was heated to the desired temperature and then oxygen was continuously added at 689 kPa (100 psig). A mixing speed of 180 rpm was maintained throughout pretreatment. The reaction was stopped by stopping the flow of oxygen, cooling the reactor in an ice bath, and bringing it to atmospheric pressure. The pretreated biomass was then filtered and thoroughly washed with water to remove the pretreatment liquor.
In order to investigate the effect of lignin and pretreatment severity on enzymatic hydrolysis, oxygen delignification was carried out at two conditions: mild (M) and severe (S). The pretreatment conditions were selected based on conditions tested by our group in past studies and to produce pretreated substrates with high and low lignin contents. 23 Pretreatment conditions and composition of the pretreated substrates are summarized in Table 1.
Compositional Analysis
The extractives in wheat straw were determined and extracted following the methodology recommended by Sluiter et al. 24 Compositions of raw extractive-free biomass and pretreated substrate were characterized according to Sluiter et al. 25 Sugars were quantified using a high-performance liquid chromatograph equipped with an ion exchange PA1 (Dionex, Sunnyvale, CA) column, a pulsed amperometric detector with a gold electrode, and a Spectra AS 3500 autoinjector (Dionex DX-500). Fucose was used as an internal standard.
Enzymes and Analysis of Enzyme Activity and Protein Concentration
Commercial enzyme preparations from Novozymes (Franklinton, NC) were used for hydrolysis: cellulase from Trichoderma reesei, Celluclast 1.5L [129.3 mg protein/mL, 30.7 cellobiohydrolases unit (CBU)/mL, 63.8 filter paper unit (FPU)/mL]; and β-glucosidase derived from Aspergillus niger, Novozyme 188 (102.2 mg protein/mL, 626.4 CBU/mL). All enzymes were stored at 2°C until use.
Cellulase activity was measured following the filter paper assay and reported in FPU/mL of solution. 26 β-glucosidase activity was measured using the method described by Woods and Bhat. 27
Protein concentration during enzymatic hydrolysis was measured by the Bio-Rad protein assay (Bio-Rad, Richmond, CA). Lyophilized powdered cellulase (C8546, Sigma Aldrich, St Louis, MO) and β-glucosidase (9033-06-1, Sigma Aldrich) were used as calibration standards to increase the accuracy of protein quantification. 28 The response of Bio-Rad dye to the supernatant of pretreated biomass incubated at hydrolysis conditions in the absence of enzymes was negligible. Supernatant from enzymatic hydrolysis samples was mixed with Bio-Rad dye and absorbance was measured with a UV-spectrophotometer (UV-1800, Shimadzu, Kyoto, Japan) at 595 nm.
Enzymatic Hydrolysis
Hydrolysis was performed in 250-mL Erlenmeyer flasks (50-mL total reaction volume) at 50°C in an incubator at 150 rpm. The reaction was carried out in 50-mM acetate buffer (pH 4.8) supplemented with 0.02% w/v tetracycline (Sigma Aldrich) and 0.015% w/v cyclohexamide (Sigma Aldrich) to prevent microbial contamination. Pretreated wheat straw in buffer was preheated to reach thermal equilibrium prior to enzyme addition. Samples of 0.5 mL were taken during hydrolysis (at ∼0, 0.25, 2, 5, 8, 10, 20, 30, 48, 56, and 72 h) and centrifuged (relative centrifugal force = 16,904 g, 10 min). A 0.1-mL sample of supernatant was used to immediately determine protein content, and the remaining supernatant was immediately cooled to 4°C to deactivate enzymes. The samples were kept at 4°C until they were analyzed for sugars.
Hydrolysis conditions, summarized in Table 2, were selected to study the effect of cellulases concentration, hydrolysis time, solids concentration, and lignin content. In order to avoid accumulation of cellobiose and subsequent end-product inhibition of cellulase, Novozymes 188 (β-glucosidase) was loaded at a ratio of 1 FPU:5 CBU. 29 The enzymatic hydrolysis reaction was monitored and modeled for 72 h so that the hydrolysis time that maximizes sugar production without compromising reactor size, energy requirements, and capital cost can be determined in future techno-economic studies. Enzymatic hydrolysis was performed in triplicate for each condition.
FPU, filter paper unit; bCBU, cellobiohydrolases unit; cDM, dry matter.
Glucan conversion (GC, %) and xylan conversion (XC, %) are defined as follows:
In order to compare glucan conversion rates obtained at 5 and 10 wt% solids concentration and 20 and 40 FPU/g cellulose, the average change of glucan conversion over the change of time for substrates M and S at different solids concentration was calculated:
where Gi
and Gi+1
are the glucan conversion at times ti
and ti+1
(min), respectively. Gm, Gs, Gm20, and Gm40 are the ratios of the average change in glucan conversion over the change of time for the scenarios M20-5/M40-10, S20-5/S40-10, M20-5/M20-10, and M40-5/M40-10, respectively. Similarly, glucan and xylan conversion rates were compared using the average ratio of change in glucan and xylan conversions with respect to time (G/X):
where Xi and Xi+1 are the xylan conversion at times ti and ti+1 (min), respectively.
Fitting of Data
The proposed kinetic model was fit to the experimental data from scenarios M20-5 and M40-5 using the least-squares fitting approach. In this method, a search is made for parameters that minimize the sum of squares (SS) of residuals:
in which yi is the experimental glucose concentration, f(xi,θ) is the predicted glucose concentration at the experimental point xi , (time t), the model function is Equation 27 , and θ is the parameter(s) (Ke, kd, k2 and FL ). 30
Results and Discussion
Changes in Composition During Pretreatment
The compositions of the pretreated substrates are summarized in Table 1. Under mild conditions (M, 30 min, 6% caustic, 120°C) 10.3%, 24.3%, and 63.2% of glucan, xylan, and lignin, respectively, were removed. The mass percent of glucan, xylan, and lignin removed by the severe pretreatment condition (S, 60 min, 10% caustic, 150°C) was 25.8%, 42.1%, and 85.6%, respectively.
Effect of Solids and Enzyme Concentration On Hydrolysis
The hydrolysis experiments were carried out at a range of conditions (Table 2) in order to assess how solids and enzyme concentration affect reaction rate and glucan conversion. Glucan conversion during enzymatic hydrolysis is shown in Fig. 1. The ratios of average glucan conversion, Gm, Gs, Gm20, and Gm40, are summarized in Table 3.

Glucan conversion as a function of hydrolysis time, enzyme loading in FPU/g glucan, and solids loading in wt% dry matter (20-5: black square; 40-5: red circle; 20-10: blue triangle; 40-10: gray diamond) for
Average Change of Glucan Conversion over the Change of Time during Hydrolysis
At equal solids concentration, higher glucan conversion was observed at 40 FPU/g glucan compared to 20 FPU/g glucan. The exceptions to this trend are scenarios S20-5 and S40-5. Maximum glucan conversion was equivalent in both scenarios but maximum conversion was reached more quickly in scenario S40-5 (after 10 h), indicating an increase in reaction rate. When solids concentration and enzyme loading were increased proportionately, reaction rate (Gm = 1.08, Gs = 1.12) and glucan conversion (Fig. 1) were similar.
Glucan conversion obtained from substrate S (4.7% lignin) was higher than for substrate M (9.0% lignin). This is in agreement with the higher glucan conversions from wheat straw subjected more severe oxygen delignification conditions, reported by Klinke et al. 31
When cellulase loading was kept constant, the reaction rate observed for substrate M was almost independent of solids concentration (Gm20 = 1.25 and Gm40 = 1.08). However, increasing solids concentration while maintaining cellulase loading did decrease the conversion of substrate M (e.g. GCM20-5 = 69% and GCM20-10 = 58%), likely due to limited enzyme mobility and/or elevated sugar concentrations. 32 The maximum glucan conversion was achieved more quickly at 40 FPU/g glucan than at 20 FPU/g glucan for substrate M independent of solids loading, indicating that there was insufficient enzyme to attack all available glucan at 20 FPU/g glucan.
In each scenario, the calculated xylan and glucan reaction rates were similar and proportional (G/X = 0.94), as shown in Fig. 2. This behavior is in agreement with the results reported by Hu et al. 33
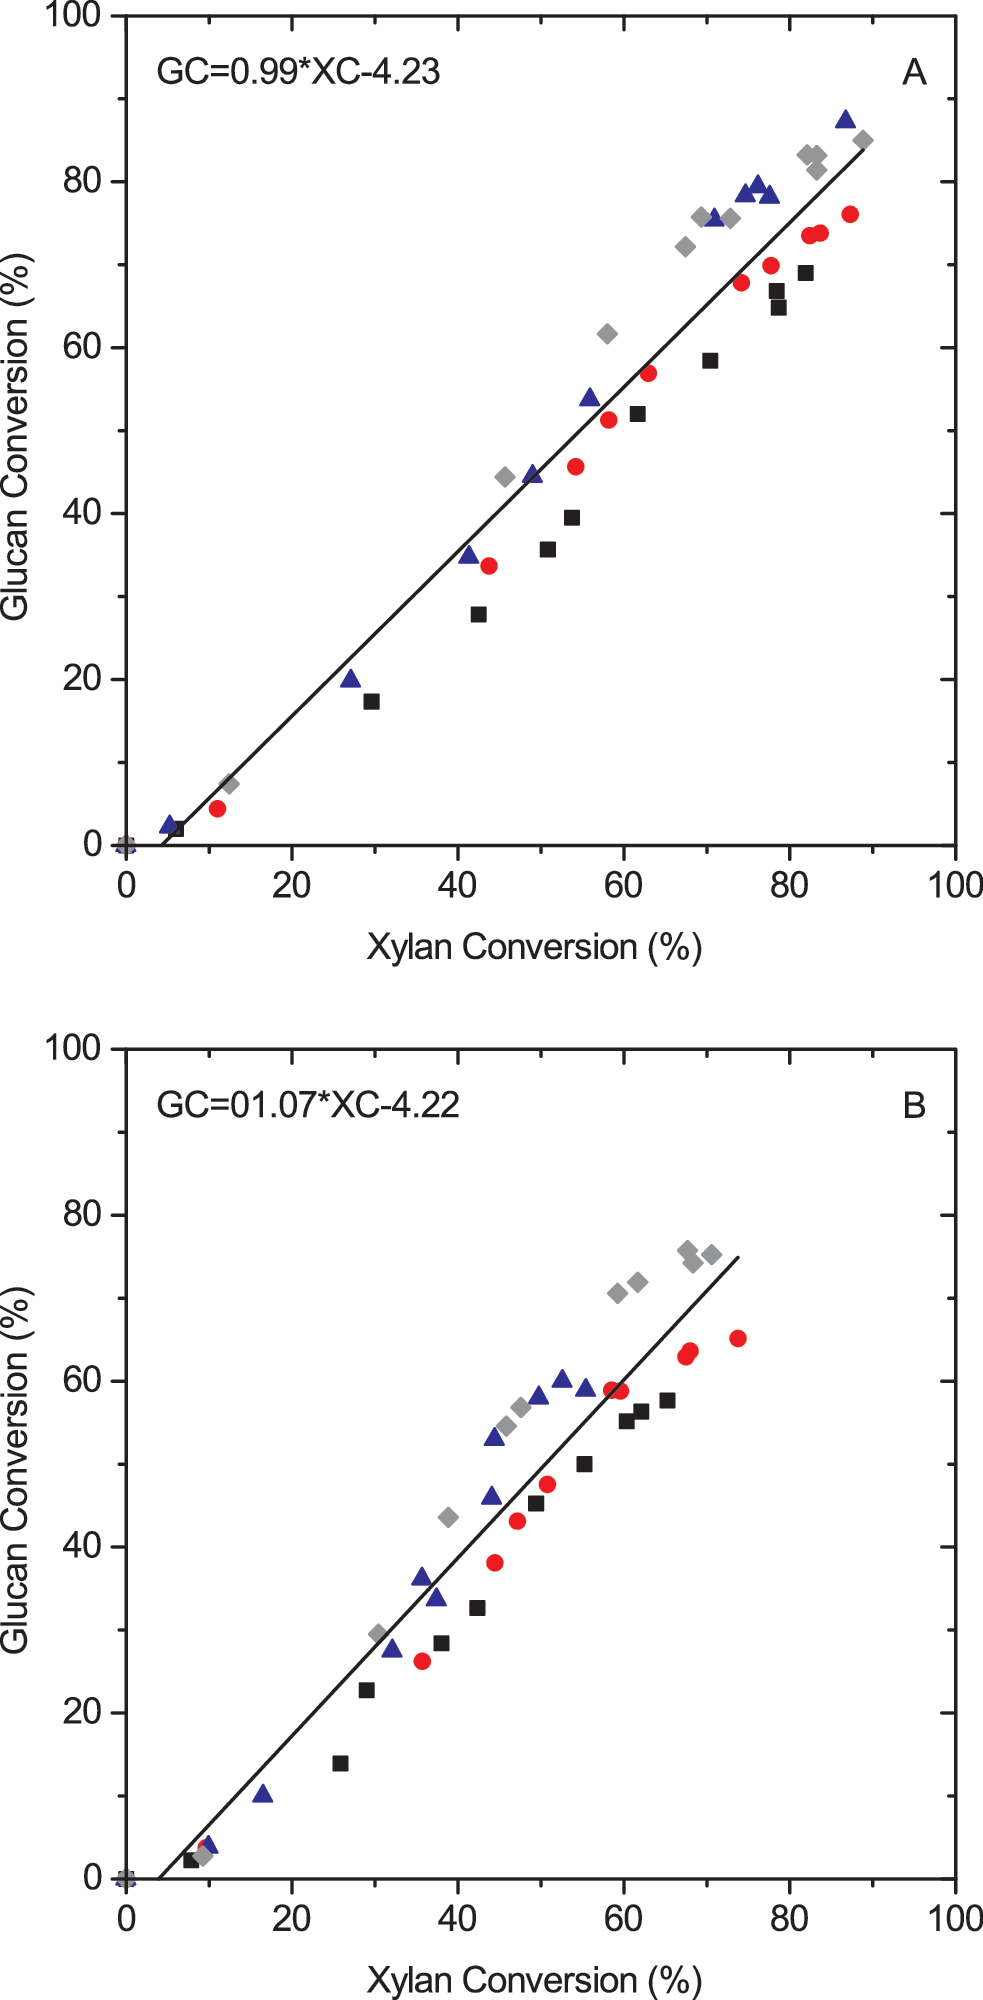
Glucan conversion as a function of xylan conversion during enzymatic hydrolysis at
Cellulases Distribution During Enzymatic Hydrolysis
The protein mass balance in solution during hydrolysis is given by:
Where [TE
], total protein concentration (g/L), is the sum of protein concentrations of Celluclast 1.5L [EL
] (g/L) and Novozyme 188 [N] (g/L). Endoglucanases and cellobiohydrolases are the major components in Celluclast 1.5L, thus it was assumed that Celluclast 1.5L contains only cellulases.
34,35
The concentration of Novozyme 188 protein decreases during hydrolysis as predicted by our previously published model:
Where [N0 ] is the initial protein concentration of Novozyme 188 (g/L), t is hydrolysis time (h), and k 1″ (h−1) and ks (L g−1 h−1) describe the rate of denaturation and regeneration of Novozyme 188 proteins, respectively. 36 The concentration of cellulases in solution, [EL ], is calculated from the difference between measured total protein concentration and predicted Novozyme 188 protein concentration. Protein concentrations during enzymatic hydrolysis are shown in Fig. 3.
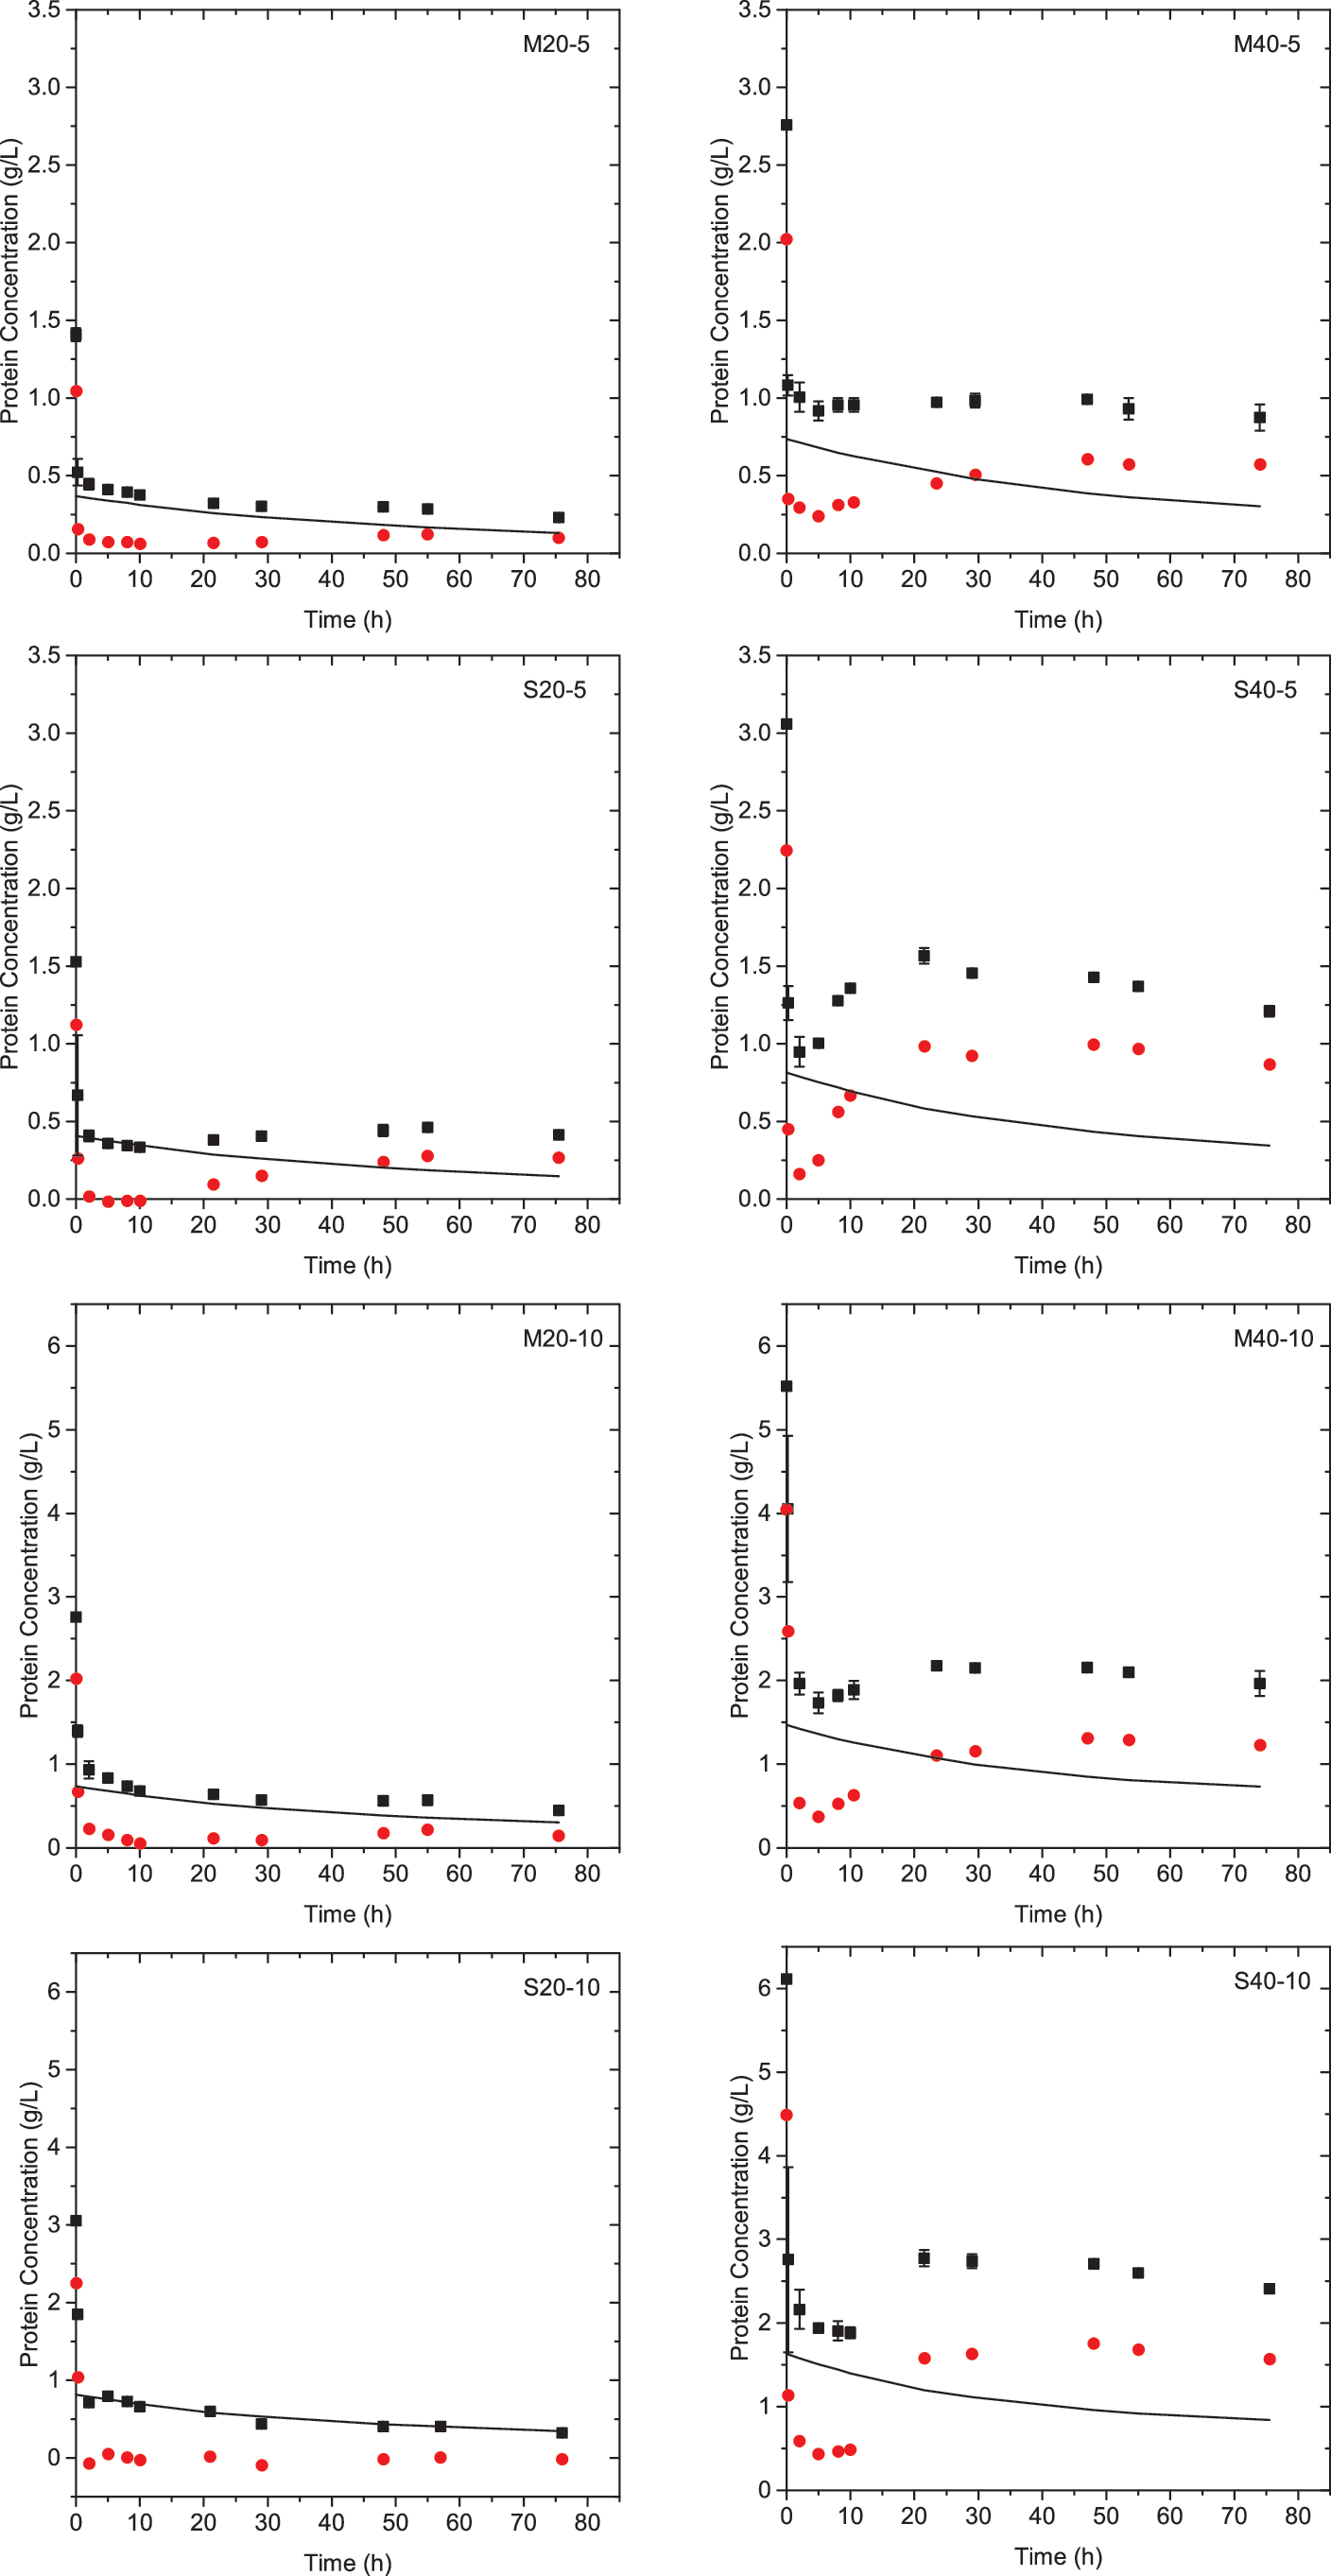
Cellulases protein concentration (red circle) in solution calculated from the difference in total measured protein concentration (black square) and predicted Novozyme 188 protein concentration, Equation 10 (black line). Color images available online at
During the first two hours of enzymatic hydrolysis, the concentration of cellulases decreased by 86–100%, likely due to adsorption on wheat straw. As hydrolysis continues, the concentration of cellulases in solution begins to increase and then plateau at a constant concentration after 24–48 h, indicating desorption of cellulases. Most of the loaded cellulases (61–100%) remained adsorbed after 76 h of hydrolysis, probably due to irreversible adsorption on lignin. Increasing enzyme loading increased cellulase desorption rate. A larger amount of cellulases desorb from substrate S than from substrate M, reflecting the low lignin content of substrate S. These observations coupled with those from Fig. 1 highlight lignin's impact on adsorption of cellulases to cellulose, rate of hydrolysis, and extent of cellulose conversion. Given lignin's negative influence on enzymatic hydrolysis, lignin content must be considered when developing hydrolysis models.
Kinetic Model for The Enzymatic Hydrolysis of Lignocellulose
Cellulases were treated as having a single combined effect on wheat straw and are represented as E.
37
The surface and structure of wheat straw was assumed to be homogeneous.
19
Thus enzymatic hydrolysis can be described by the equations:
The active E in solution (g/L) is adsorbed onto cellulose active sites (S, g/L) to form the enzyme-cellulose complex (SE*, g/L) from which cellobiose (C, g/L) is released. In Equation 11, k1
(L/h g), k−1
(1/h) and k2
(1/h), are rate constants of cellulase adsorption, cellulase desorption, and cellobiose production, respectively. Equation 11 was used by Shen and Agblevor and Zhang et al., but in those models it was assumed that all enzymes (cellulases and β-glucosidase) have a single combined effect and that glucose is directly produced from cellulose.
11,17,19
This assumption implies that all cellobiose produced is converted to glucose. However, as the enzyme preparations used in these studies contained cellulases and β-glucosidase in unknown proportions, β-glucosidase concentrations may have been insufficient to prevent cellobiose inhibition. Consequently, Shen and Agblevor's and Zhang et al.'s models might not capture the true rate of glucose hydrolysis.
11,17,19
In this work, β-glucosidase is supplemented in excess using Novozyme 188 to prevent cellobiose inhibition. In Equation 12, cellobiose is converted to glucose (G, g/L) by β-glucosidases (B, g/L), where k3
(1/h) is the glucose production rate constant. The cellulase-cellulose complex formation rate and substrate mass balance are shown in Equations 13 and 14.
11
[S0
] is the initial concentration of cellulose (g/L). Substituting Equation 14 into 13 and assuming the steady state condition (
where Ke
is the equilibrium constant (g/L).
11
From Equations 11 and 12, the cellobiose and glucose production rates are:
Measured cellobiose concentrations during hydrolysis at 5 wt% solids were approximately zero and less than 8% of the glucose concentration at 10 wt% solids, therefore [S0]-[C]-[G]≈[S0]-[G]. The concentration of cellobiose was observed to be approximately constant over time, and consequently
Although Equation 19 is similar to the models by Shen and Agblevor and Zhang et al., in this work the enzyme term [E] refers only to cellulases; for the first time, lignin content can be introduced to the model via the cellulases mass balance.
11,17,19
The cellulases mass balance during enzymatic hydrolysis is:
where [E0
] (g/L) is the initial concentration of cellulases, [EL*] (g/L) is the concentration of the cellulase-lignin complex, and [Ed
] (g/L) represents the concentration of cellulases deactivated due to temperature, enzyme-glucose, or enzyme-xylooligomers interactions.
38
–40
Due to β-glucosidase supplementation, cellobiose inhibition was negligible and does not affect [Ed
]. Figure 3 shows that a significant fraction of enzyme was irreversibly adsorbed during the first two hours of hydrolysis of all scenarios, which agrees with Zheng et al.'s conclusions.
18
Given this observation, it was assumed that the cellulase-lignin complex (EL*) formed before hydrolysis starts and remains approximately constant. Therefore, the effective initial concentration of cellulase available for reaction, [ER
] (g/L), is given by:
The cellulase-lignin complex formation depends on the concentration of lignin [L] (g/L) and thus was defined as:
where FL
is the lignin factor representing the amount of enzyme adsorbed on lignin (g cellulase/g lignin). Combining Equations 20, 21
, and 22:
As
The rate of cellulase deactivation (Ed
) was treated as a second order reaction with rate constant kd
(L/g/h), as recommended by Zhang et al.:
17
Integrating Equation 25 with initial condition [E] = [ER] at t = 0 h, yields
Substituting Equations 26 and 21 in 19, and integrating with the initial condition [G] = 0 g/L at t = 0 h, yields:
Equation 27 predicts glucose concentration as a function of hydrolysis time, cellulase loading, and lignin content. Despite the well-known negative effects of lignin, past hydrolysis models did not consider non-productive enzyme adsorption on lignin. 11,17,19,41 Our model is the first to use a lignin factor and thus directly link pretreatment conditions to substrate conversion during enzymatic hydrolysis. In addition, the proposed model has a simple mathematic solution and requires only four parameters, which facilitates its use in process simulations.
Model Fitting and Rate Constant Determination
The proposed kinetic model was fit to data from scenarios M20-5 and M40-5 as shown in Fig. 4. Kinetic parameters are presented in Table 4. The lignin factor is the same order of magnitude as the maximum adsorption capacity of lignin experimentally measured by Kumar et al.: 0.057–0.13 g cellulase/g lignin. 42 The model fits the data well as reflected by the high correlation factor (R2 = 0.99). The model had an average deviation of 7% from the experimental data. To determine the predictive capacity at different lignin contents, the model was used to predict glucose yields for scenarios S20-5 and S40-5. The model successfully predicted glucose production from substrate S as evidenced by the high correlation coefficient (R2 = 0.93). The average deviation obtained from fitting the model on scenarios S20-5 and S40-5 was 13%.
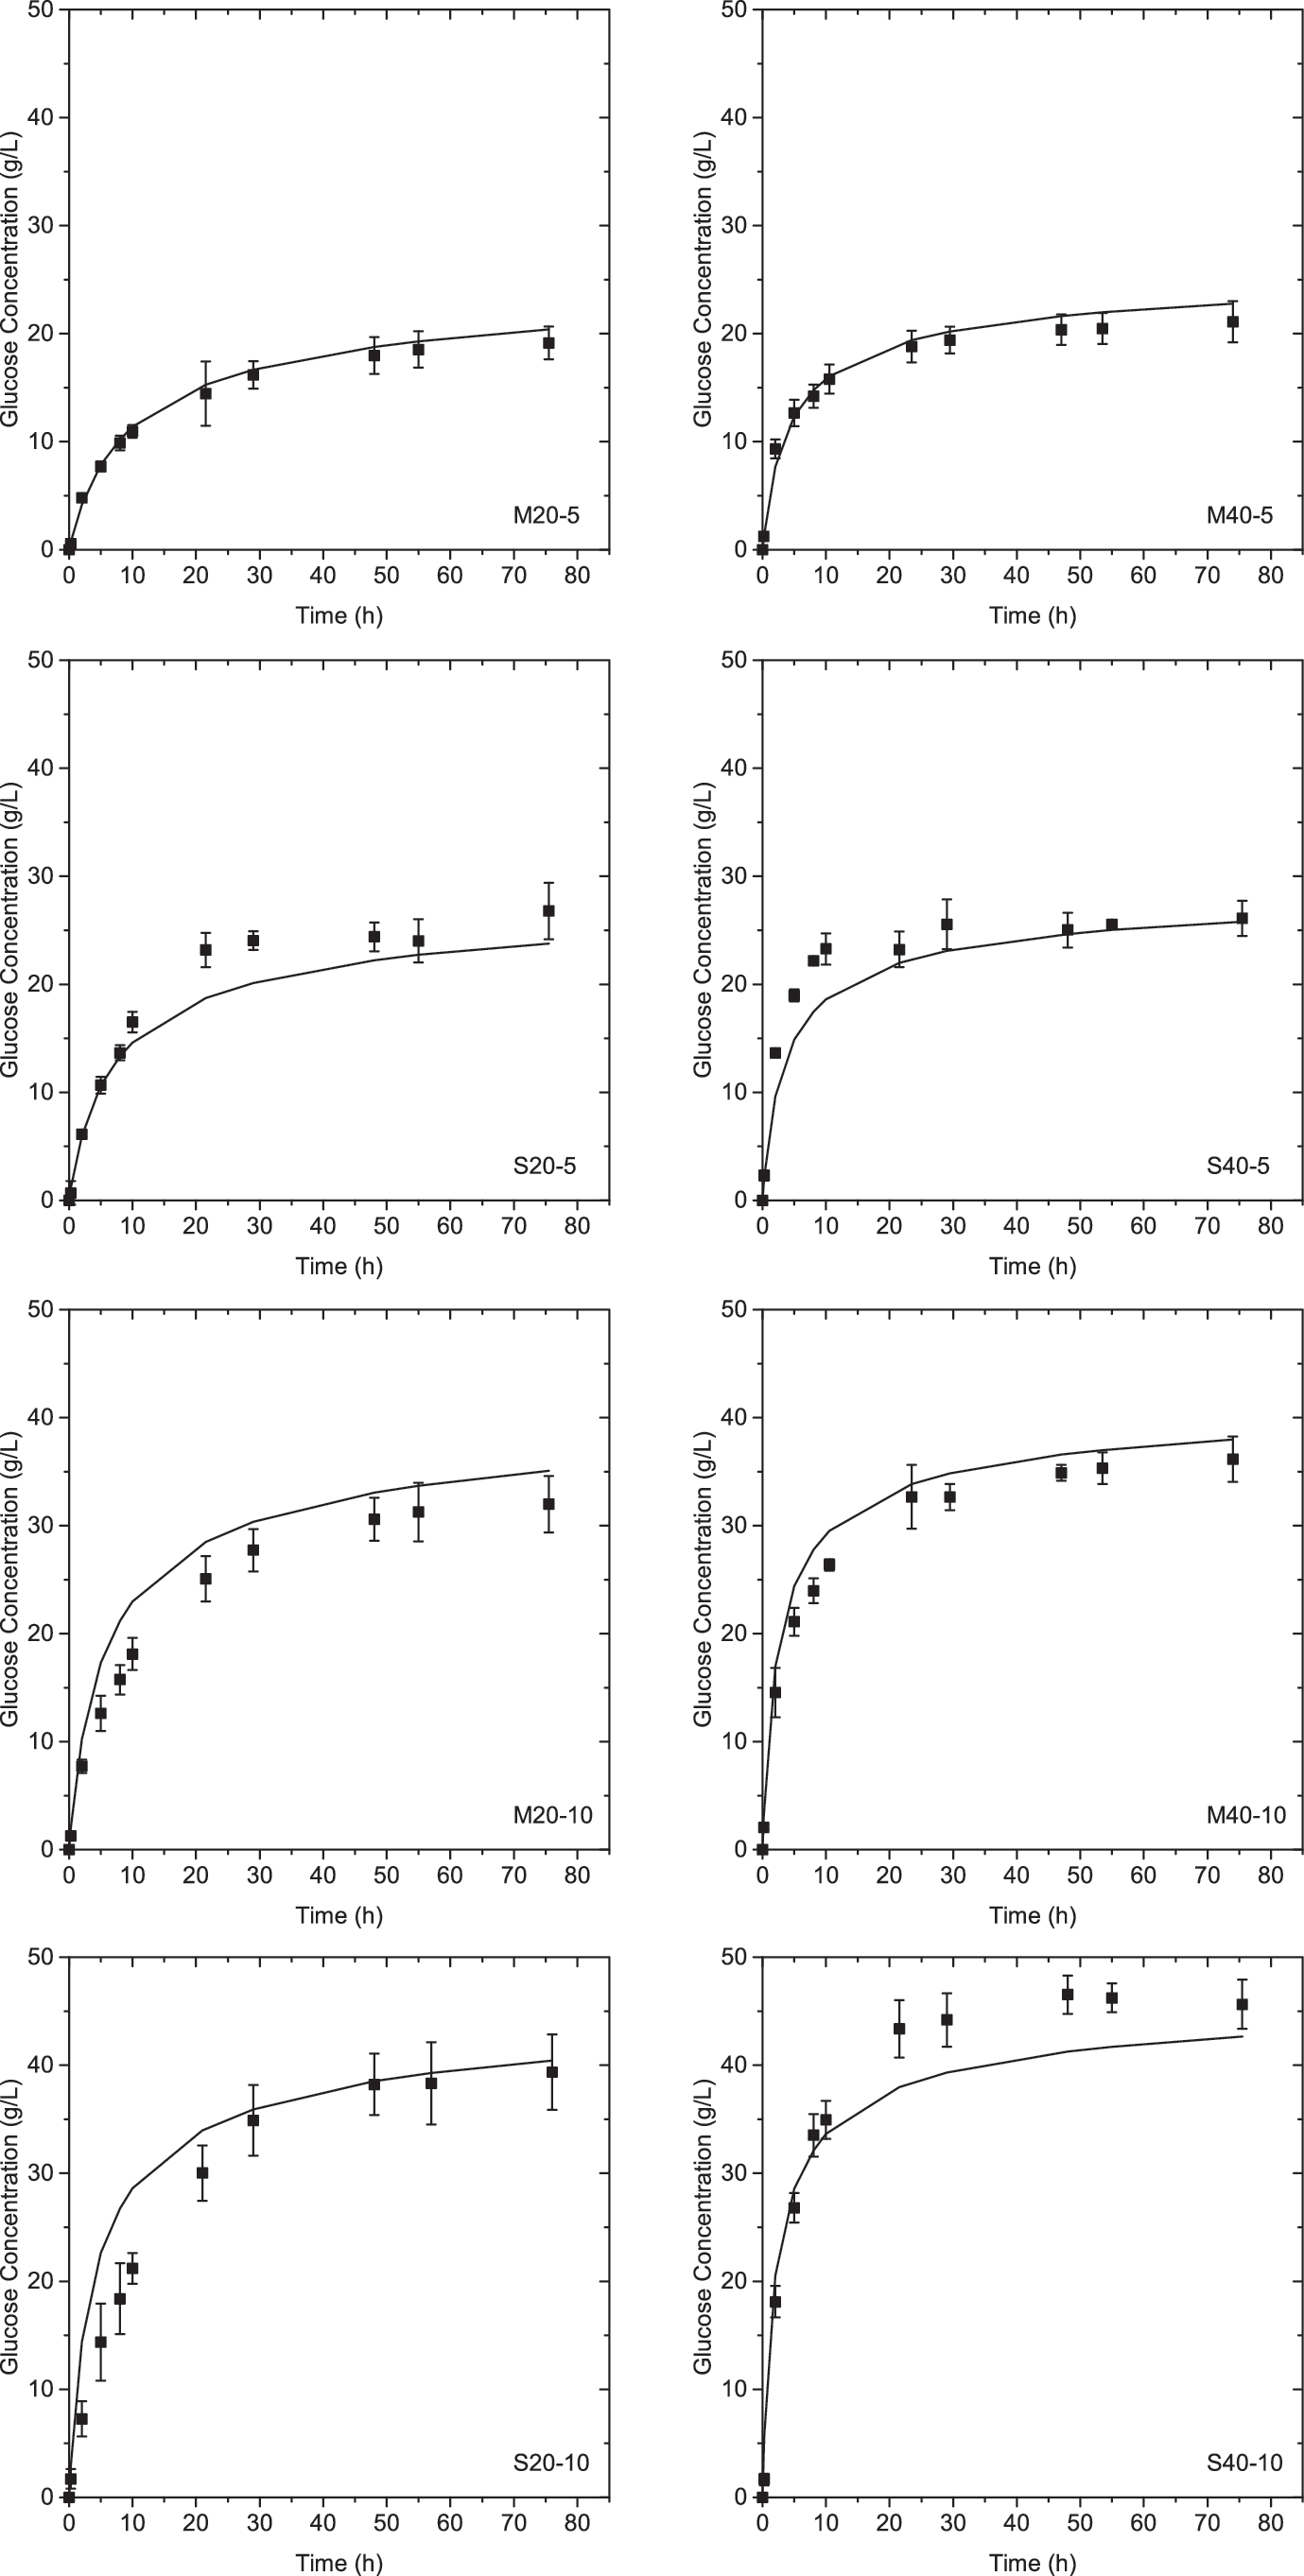
Glucose concentration as a function of time during enzymatic hydrolysis: experimental data (black square). At 5 wt% solids, glucose concentration is predicted by kinetic model, Equation 27 (black line). At 10 wt% solids, glucose concentration is predicted by kinetic model, Equation 29 (black line).
Kinetic Parameters Determined for Equations 27 and 29
At 10 wt% solids, the predicted concentration of glucose during hydrolysis had an average deviation of 55% (fit not shown). Although Zheng et al. successfully predicted hydrolysis yields for solids concentrations up to 12 wt%, they also predicted glucose concentration more accurately at low solids concentrations.
18
This was attributed to product inhibition and mass transfer limitations. Since there is little free water at 10 wt% solids, the mass transfer of water soluble compounds, such as enzymes, is likely restricted.
32
In agreement with this hypothesis, Kristensen et al. observed a linear decrease in glucan conversion with increasing filter paper solids concentration.
43
In an effort to address the inadequate fit at high solids concentrations, a diffusion factor (η) was introduced into the model.
The infinitely-fast diffusion reaction rate (rGs
) is given by Equation 19 therefore the diffusion limited reaction rate (rG
) is:
The diffusion factor can be included in Equation 27 by letting
The second order Akaike's information criterion (AICc) measures the quality of a model and can be used to select the model that best fits a data set with a minimum number of parameters. 45 AICc was calculated for the proposed model with (AICc = 266) and without the addition of the diffusion factor (AICc = 674) indicating that the addition of the diffusion factor substantially improves the predictive capabilities of Equation 27.
Conclusion
In this work, a five-parameter model was developed that accurately predicts the course of enzymatic hydrolysis of oxygen delignified wheat straw at different cellulases loadings (20 and 40 FPU/g glucan), lignin contents (5 and 9 wt%), and solids concentrations (5 to 10 wt% dry basis). The novel lignin factor used in the model accounts for both irreversible adsorption of cellulase enzymes and the impact of pretreatment efficacy on hydrolysis. The model's use of mass units, ease of solution, and relatively small number of parameters results in straightforward implementation in process simulations of ethanol production using commercial software. Such process simulations can be used to identify the combination of pretreatment and enzymatic hydrolysis conditions that minimize ethanol costs.
Footnotes
Acknowledgments
This work was supported by Consejo Nacional de Ciencia y Tecnología (CONACyT) of Mexico, Agriculture and Agrifood Canada, and the National Science and Engineering Research Council of Canada through its Discovery Grant Program. Dr. Trajano also thanks the Chemical and Biological Engineering department of the University of British Columbia for their generous start-up funding.
Author Disclosure Statement
No competing financial interests exist.