
Abstract

Introduction
In recent years, biotechnology has increasingly been used in the production of bulk/base chemicals and polymers as well as consumer and specialty chemicals. 1 –3 Industrial biotechnology (IB) has emerged from a research and development (R&D)-based field to a substantial industry, and an increasing number of dedicated IB companies have been founded during the last decades. However, producing through biotechnological routes is, at least in the starting phase, more expensive compared to traditional chemical production routes, as the synthesis of existing products by chemical procedures is frequently well established. 4,5 For biotechnology-based production to be able to compete with chemical synthesis, innovations are needed to develop cost-efficient manufacturing technologies and to scale-up biotechnological production.
Venture capital (VC) investment plays an important role in the global IB industry by supporting the development of new technologies and innovations. The analysis that follows, covering the period 2002–2013, investigates the patenting activities of VC-backed IB firms prior to and after VC investment. Data on VC investment in IB firms were taken from the Zephyr database of the Bureau van Dijk. Zephyr is the most comprehensive database worldwide on corporate financing, initial public offerings (IPOs) and mergers and acquisitions (M&A) activities including VC deals. Firms with IB as a core activity were identified using appropriate key words, and a detailed analysis of each company based on its business activities (excluding biotechnology firms in the fields of medical, agro- or plant biotechnology, as well as non-IB focused companies from traditional sectors such as the chemical industry). For each IB company, complete patenting activity was determined by searching for the company name among applicant names at all patent offices worldwide, using the Patstat database of Eurostat. Patents were assigned to IB technologies based on International Patent Classification (IPC) codes. The data allow for investigating technology portfolios of IB companies in the years before a VC investment took place and in the years afterwards. The results were compared with a control group of IB firms that did not receive VC investment but attracted other types of external investors (e.g., investment by industrial companies or M&A by other companies).
VC Investments
In the early 2000s, VC activity in the IB sector was rather limited. The net stock of VC grew slightly from $766 million in 2002 to $844 million in 2006, which corresponds to a compound annual growth rate (CAGR) of only 2% (Fig. 1). But then VC investors discovered IB as an attractive investment opportunity and increased their engagement substantially beginning in the year 2007, with about $1.7 billion, increasing the net stock of VC from $844 million to about $2.3 billion. Especially significant investments in biofuel companies in the US had driven these numbers.
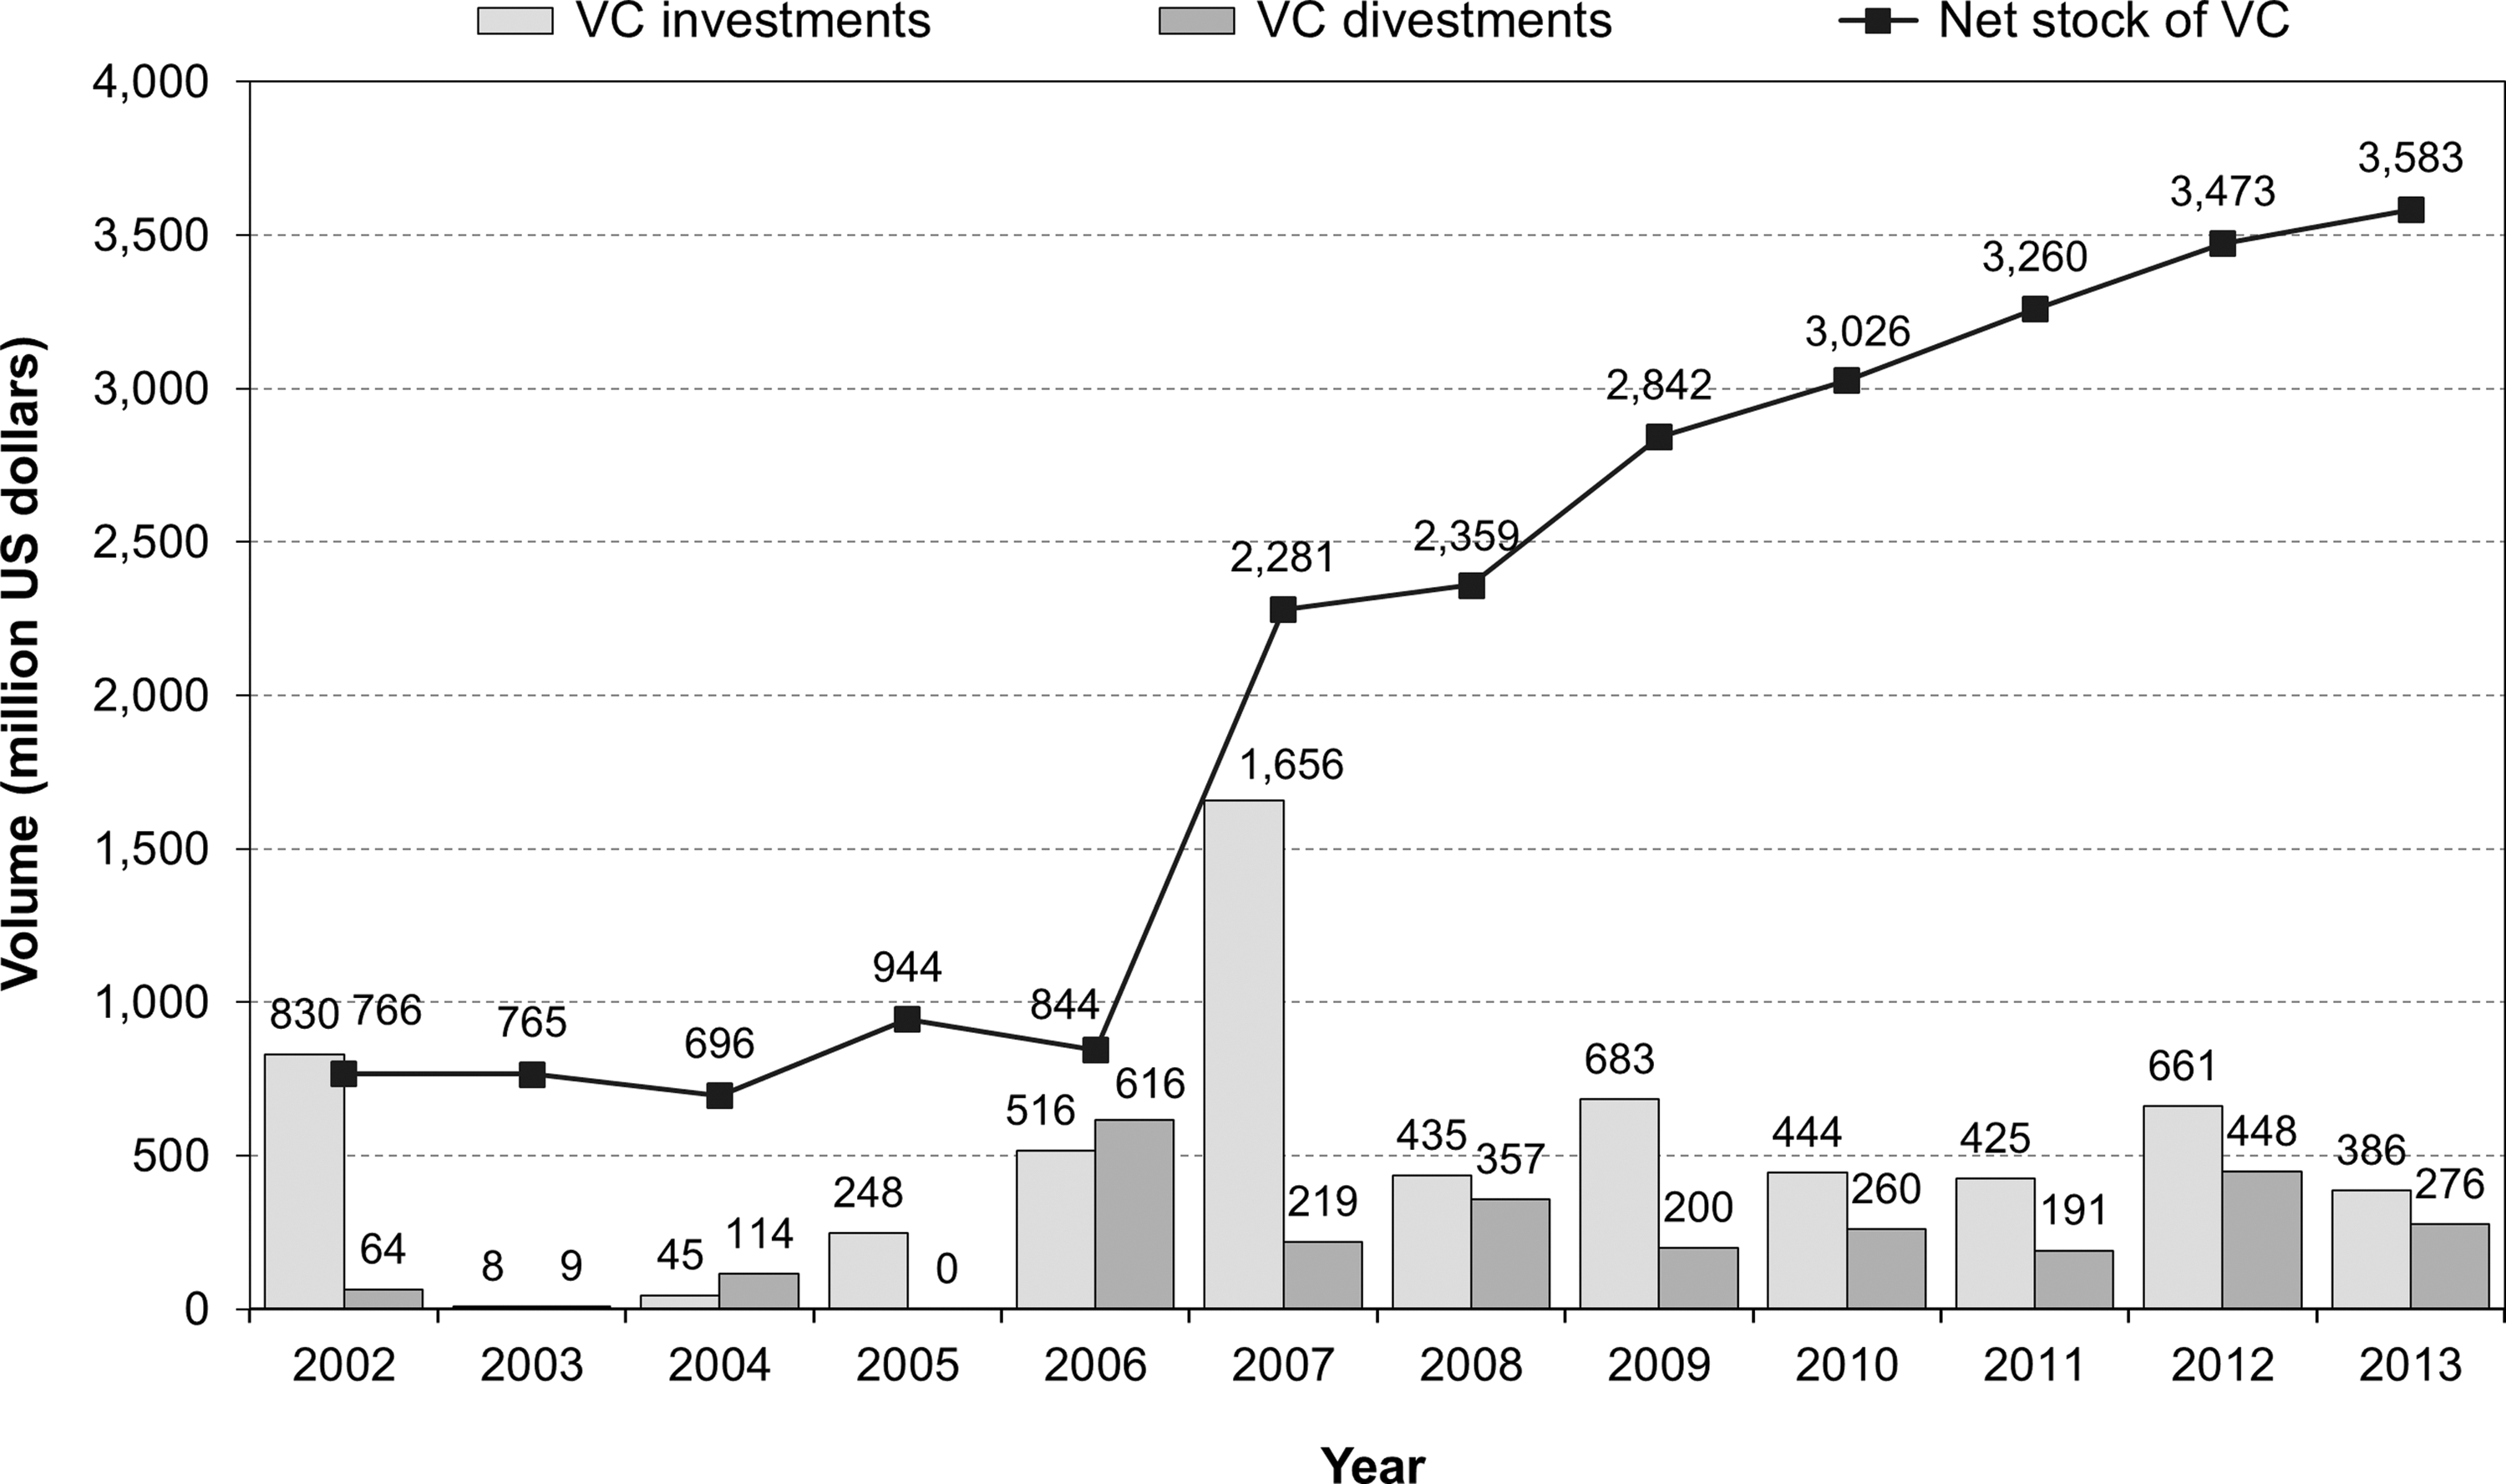
Volume of VC investments/divestments and net stock of VC.
During the last 6 years, the volume of new VC investments has been between $400–700 million per year, and the volume of divestments between $200–450 million. As new VC investments have exceeded divestments every year since 2007, the net stock of VC steadily increased, with a CAGR of 25% from 2007 to 2013, resulting in a net stock of VC of around $3.6 billion in 88 companies by the end of 2013. During the whole examination period from 2002 to 2013, VC companies invested a total of $6.3 billion in 107 IB companies compared to $2.8 billion in divestments.
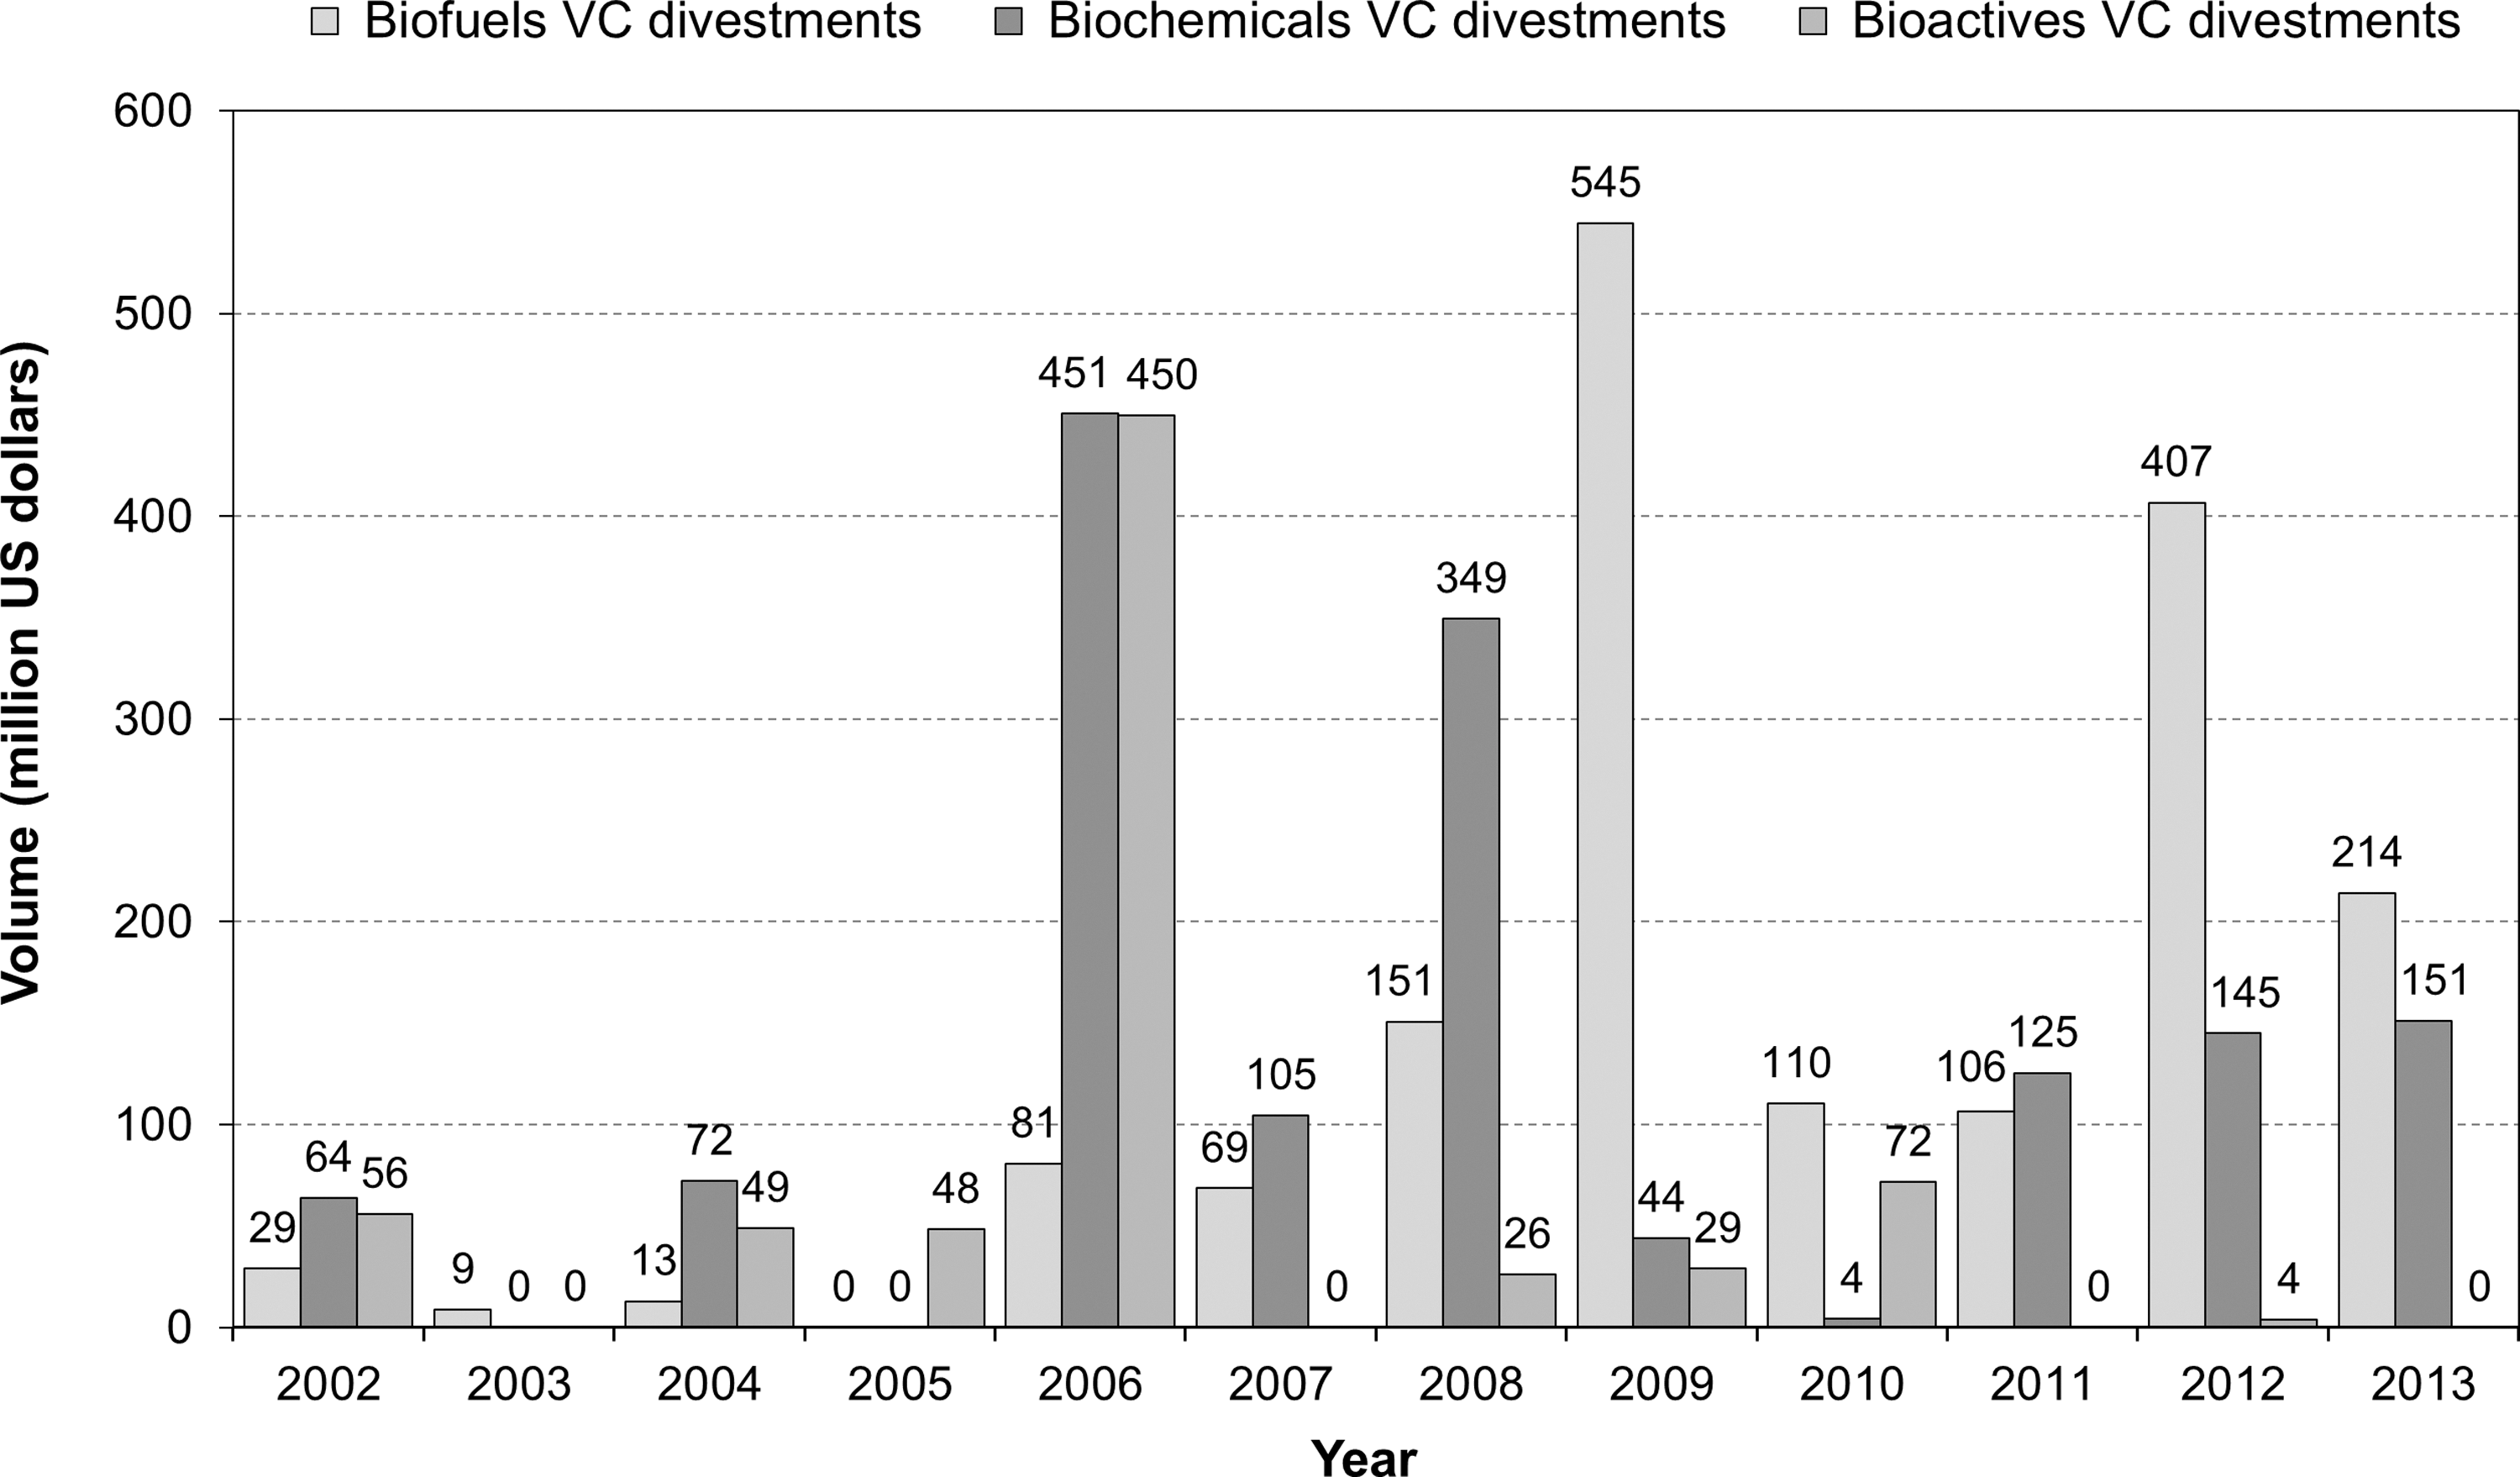
Analyzing the VC investments in IB companies by segments shows that there is a preference for biofuels and biochemicals. In 2006 and 2012, the investments in biofuels significantly increased, attributable perhaps to the strong oil price increase in 2006 and 2011/2012 (Fig. 2). Looking at the volume of VC divestments shows intensive activities in 2006 and 2012 (Fig. 3). Whereas in 2006, biofuels and biochemicals show strong divestment activities, biochemicals were particularly divested also in 2008, and biofuels in 2009 and 2012. Taking a closer look at biofuels shows that after very low investment activities during the early years, there were strong investments in the years 2006, 2007, and 2012, building up a net stock of VC at the end of 2013 of more than $2 billion.
Volume of VC investments in IB companies by segment.
Volume of VC divestments of IB companies by segment.
The picture regarding biochemicals is totally different. Coming from a net stock of VC of more than $700 million in 2002, investments strengthened in 2007 and 2009 resulting in a net stock of VC at the end of 2013 of more than $2.3 billion. Rather similar is the situation for bioactives, coming from a net stock of VC of more than $700 million in 2002. After strong investments in 2009 and significant divestments in 2006, the net stock of VC at the end of 2013 of about $1.2 billion was half that of biochemicals.
VC's Role in Innovation
Four indicators were used to examine the role of VC in innovation in the IB sector: 1) investment in newly founded firms (assuming that start-ups in IB introduce innovations to the market); 2) investment in R&D-based IB firms (i.e., firms with own patent activity prior to the investment); 3) the dynamics of patenting before and after an IB firm received VC; and 4) the fields of technology and changes in the technology portfolio of VC-backed IB companies.
Newly Founded Firms
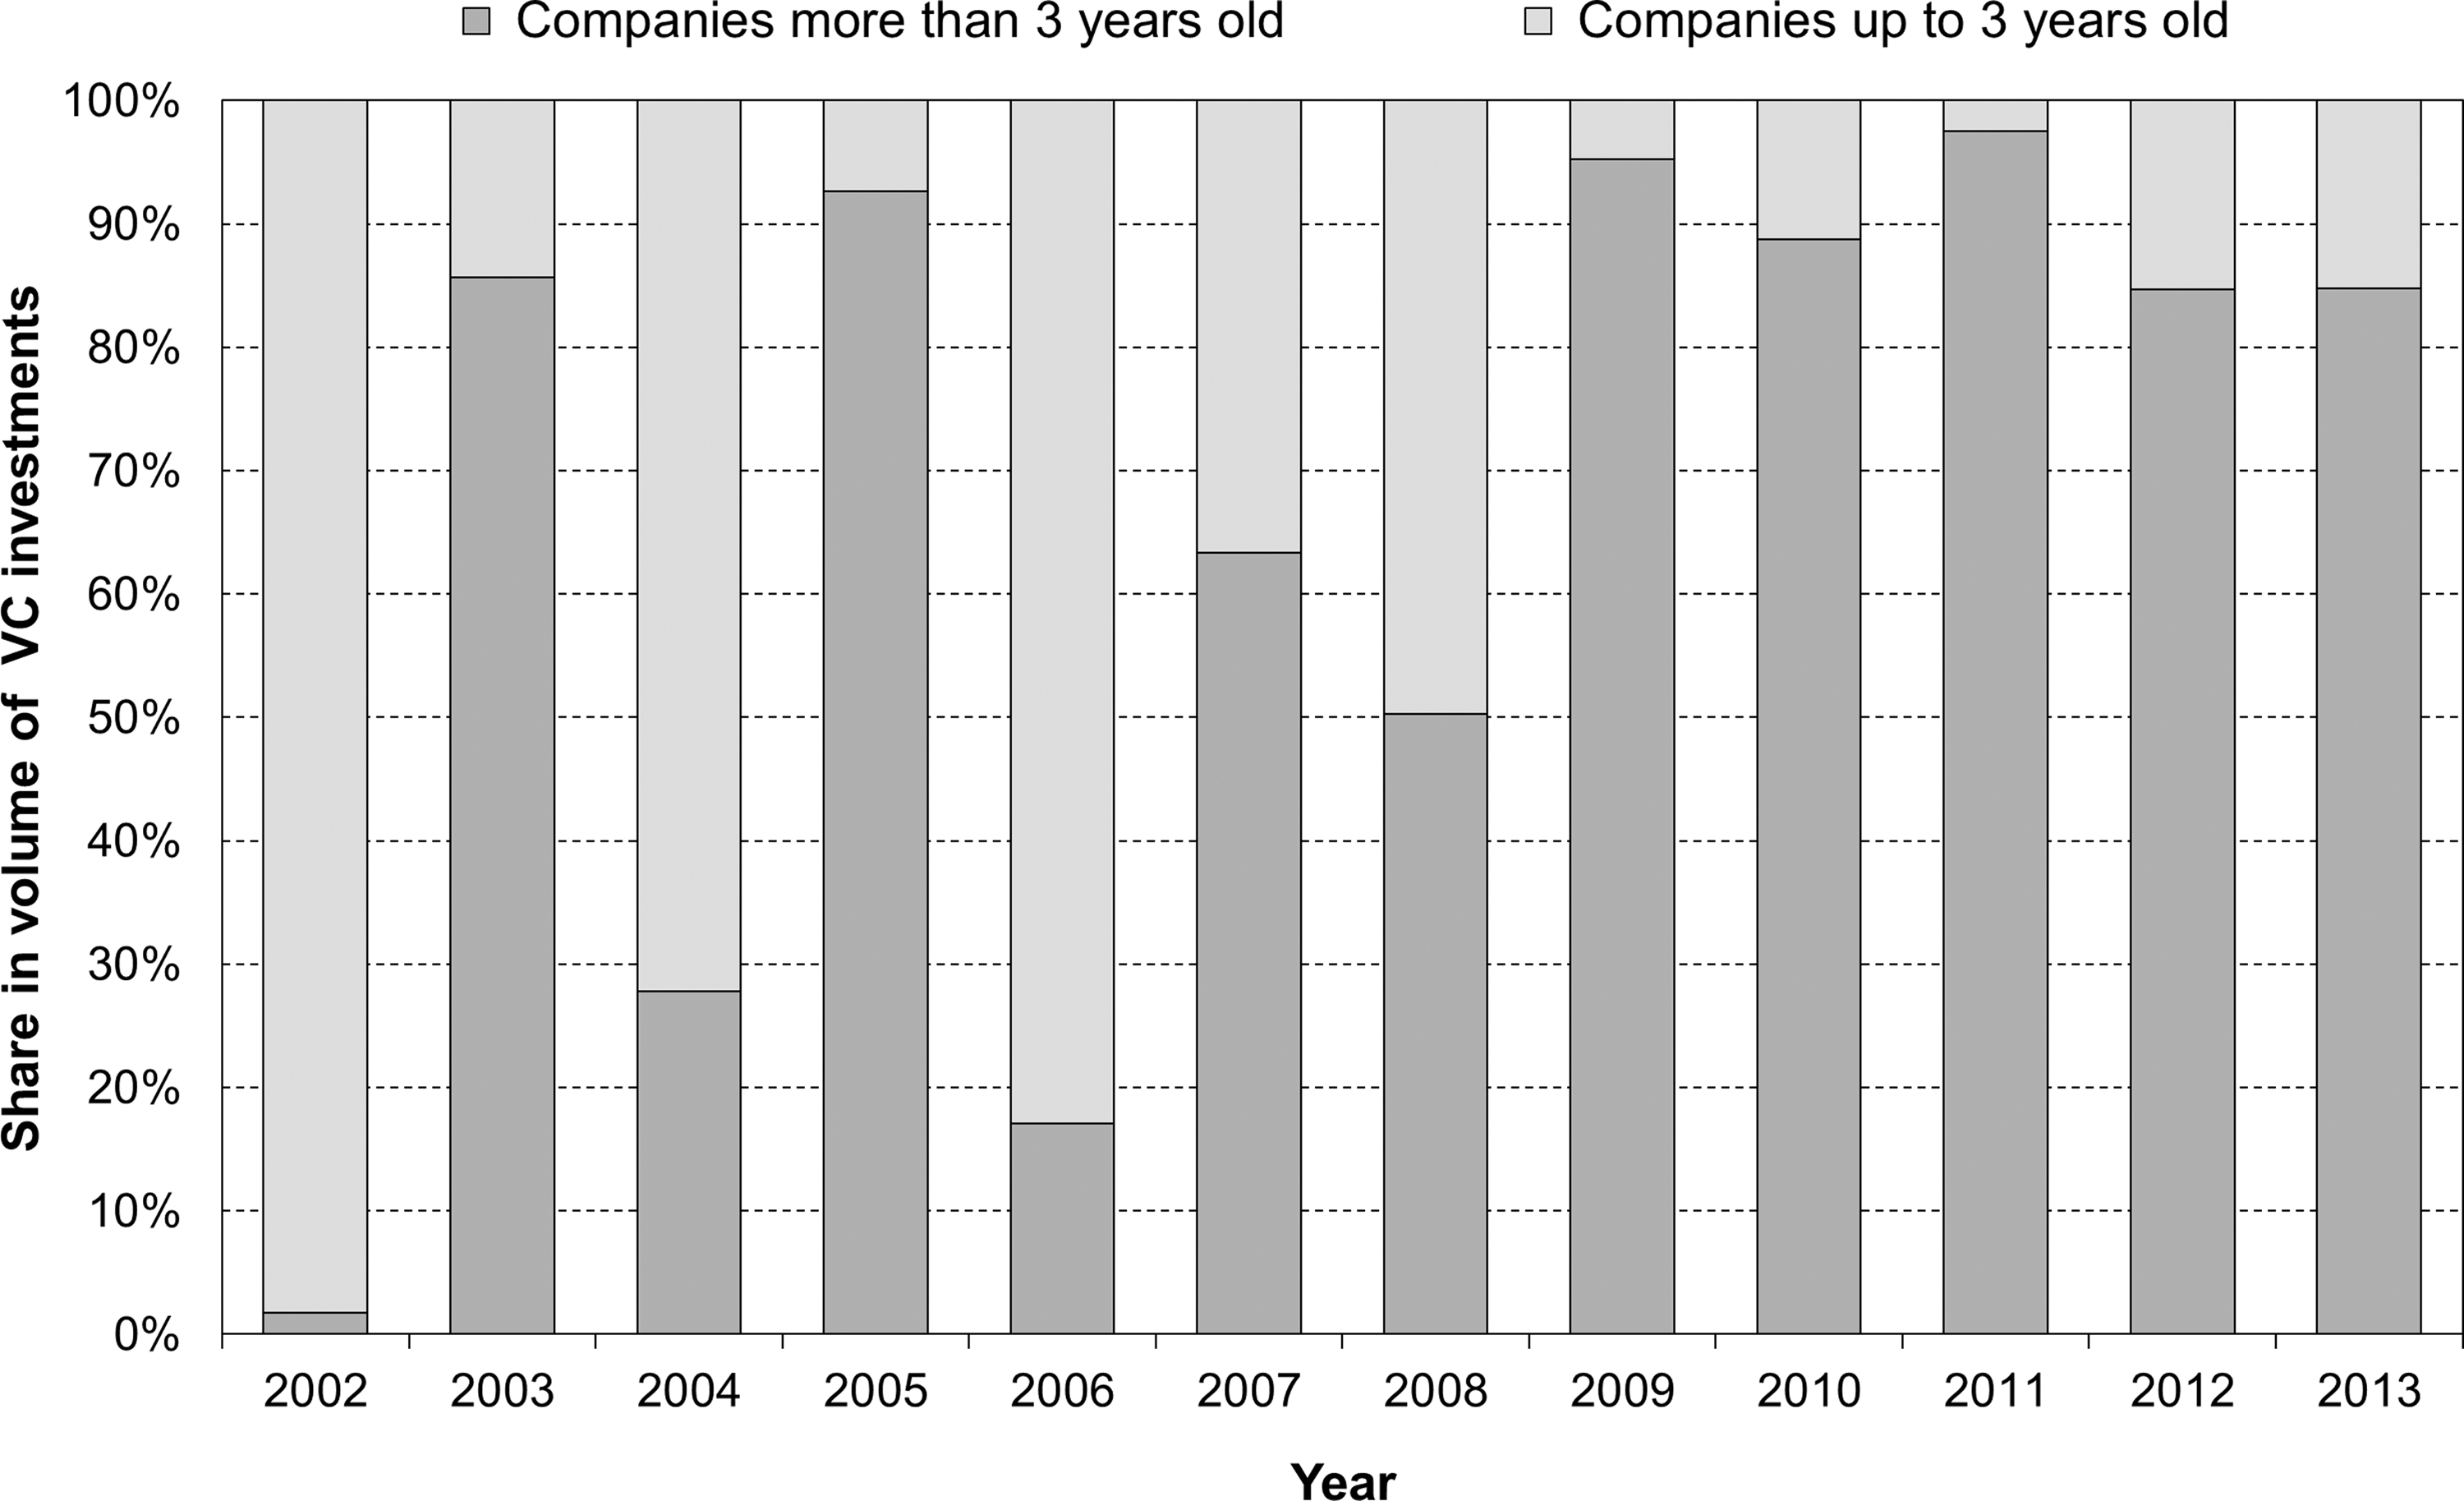
In the early and mid 2000s, a significant share of VC investment in the IB industry went to start-ups. The average age of VC-backed IB firms at the time of investment was 9.9 years, compared to 12.1 years in the control group. In the years 2002, 2004, and 2006, the majority of VC funding volumes was allocated to companies with an age of up to 3 years (Fig. 4). This suggests that VC was a significant financial source for companies in the early stages. But since 2009, most of the annual VC investment was allocated to older companies with an age of more than 3 years, including second and third round funding of companies that had received VC investment in their start-up phase. This result points to the shift of IB from a very new to a more established industry and the re-focusing of VC investors toward firms with more substantiated commercialization prospects.

VC investments by age of the company at time of investment.
R&D-Based Firms
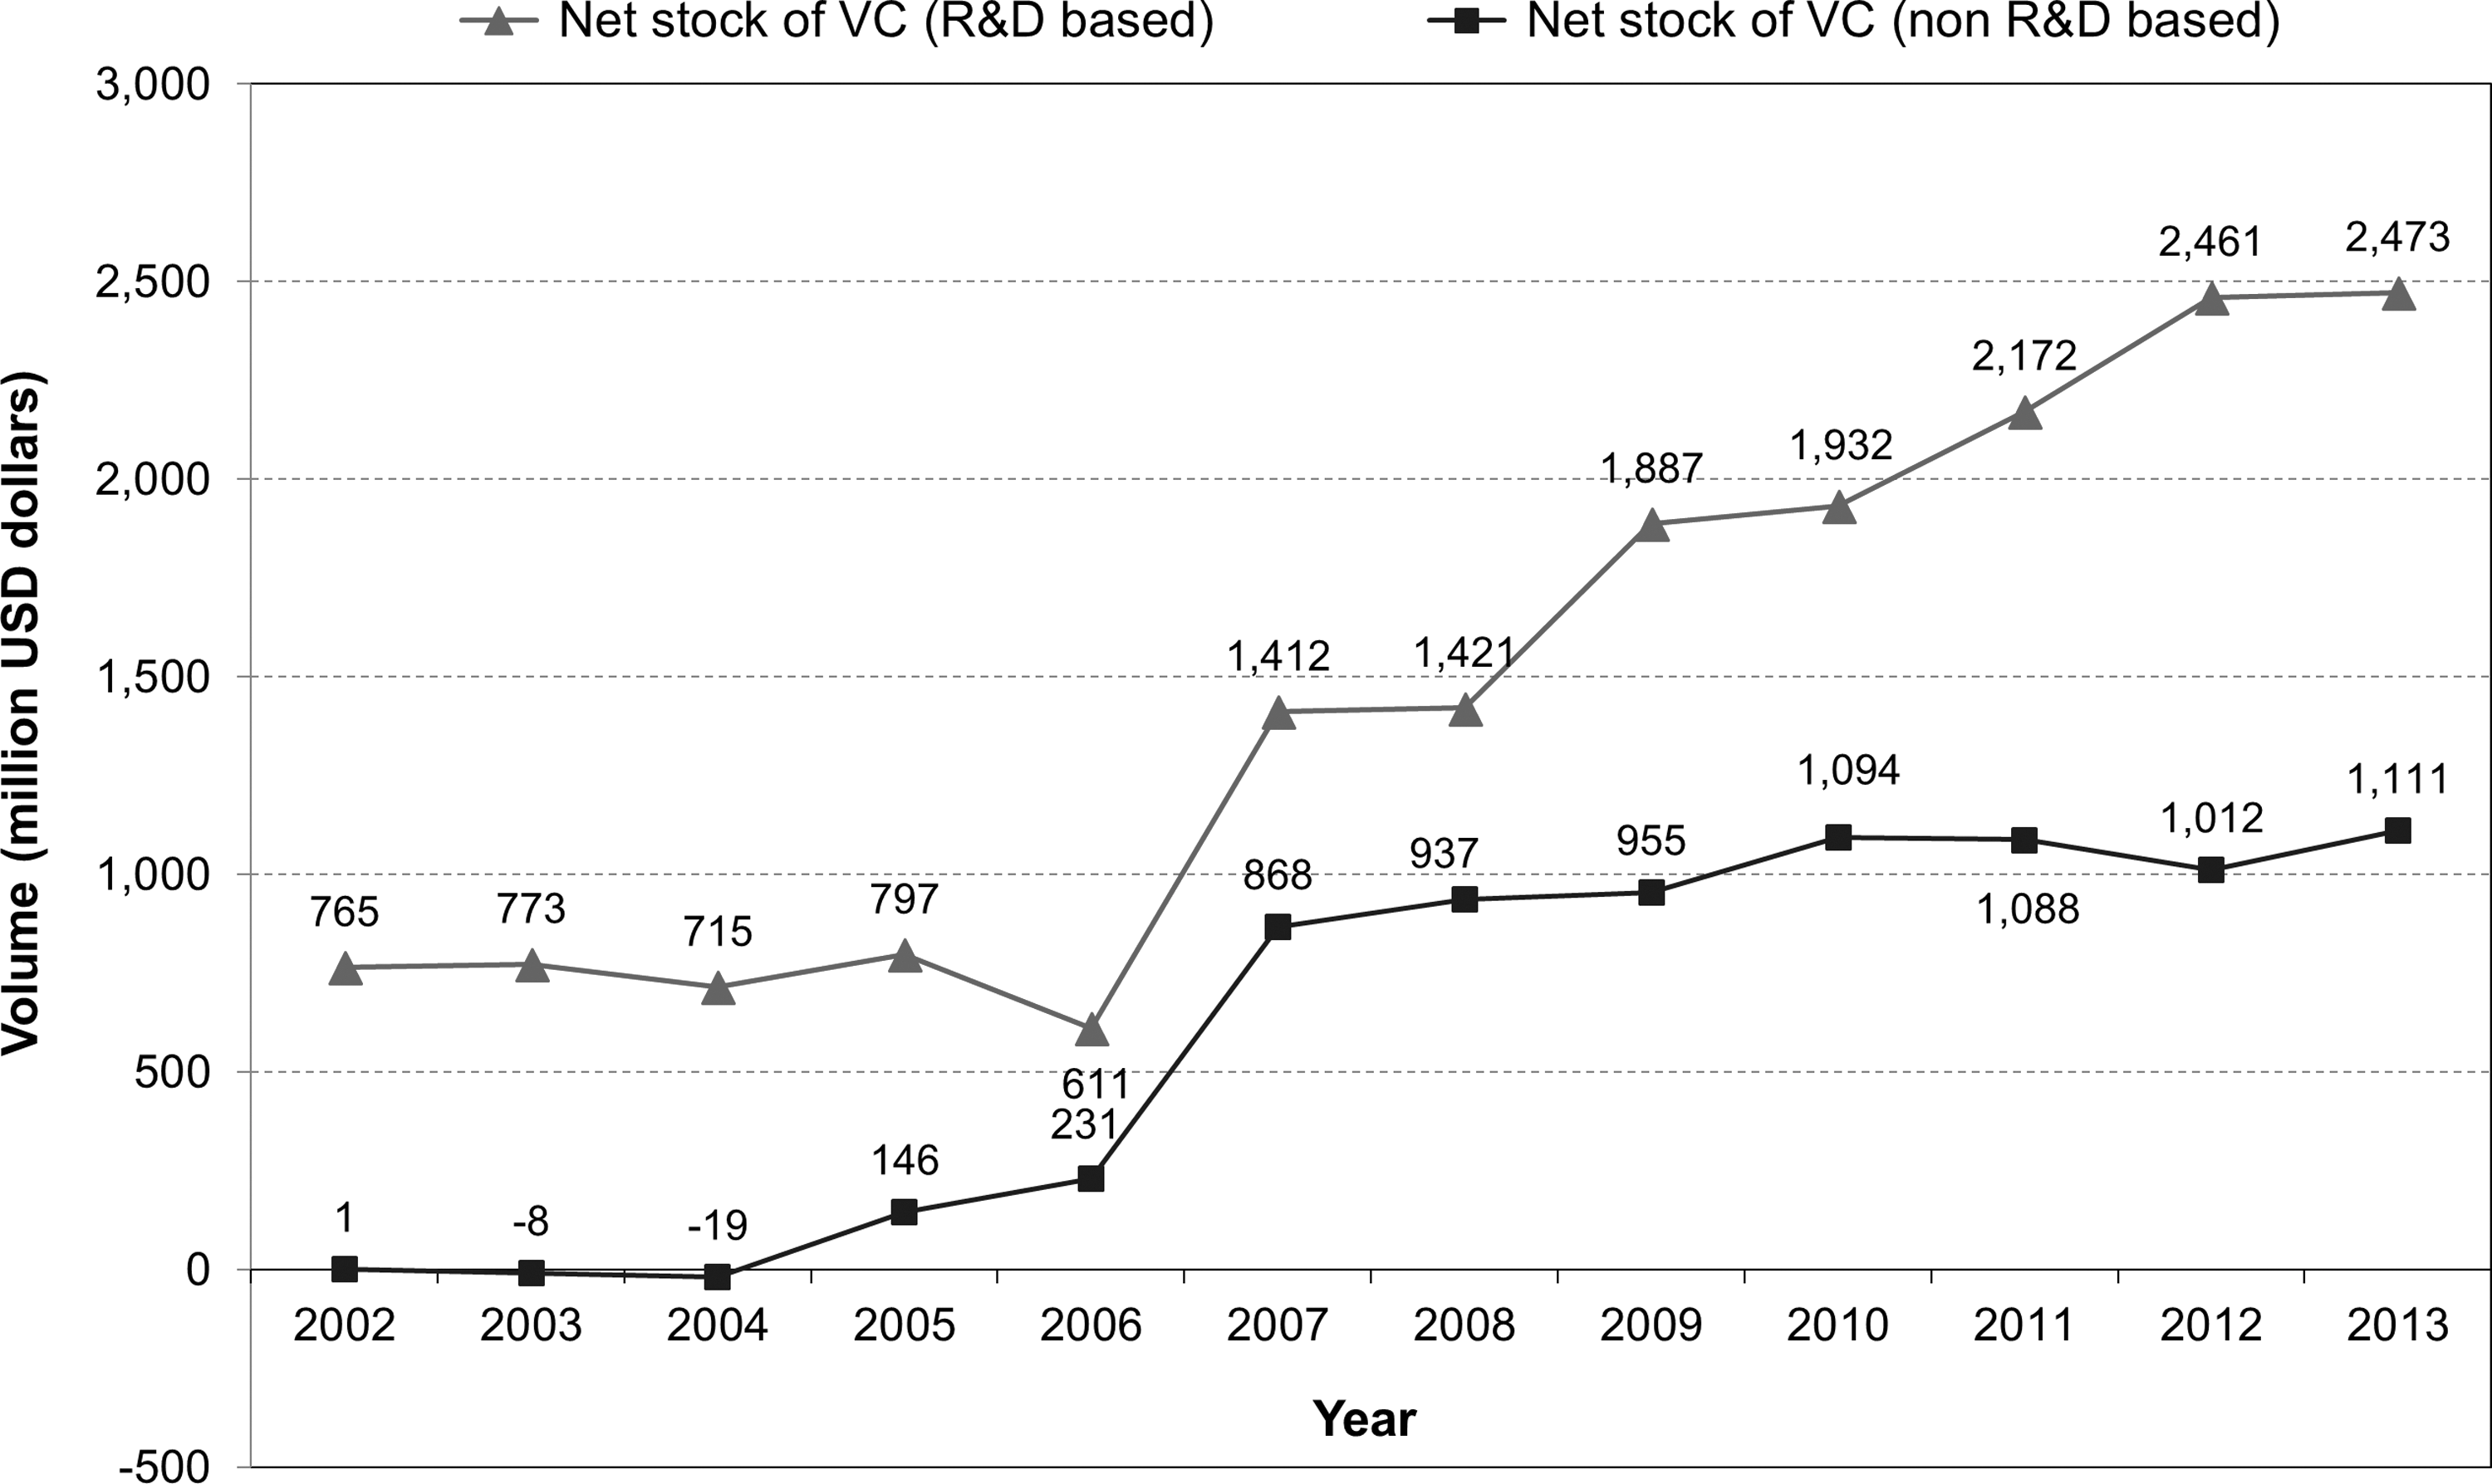
VC investment in the IB industry is much more targeted at R&D-based companies as compared to IB companies from the control group (i.e., firms that attracted other types of investors during the period analyzed) (Table 1). Sixty-one percent of all IB firms with VC investment owned patents at the time of receiving VC investment, compared to 21% for the control group. (For the control group, the “time of investment” is equivalent to the year external investors engaged in the IB firm, e.g., through M&A, IPO, and corporate investment.) The net stock of VC investment in R&D-based firms in 2013 was more than twice as high as the net stock in IB firms without own R&D activities ($2.5 billion compared to $1.1 billion in non-R&D-based companies), as shown in Figure 5. During 2002 and 2013, on average 67% of the VC investment volume in the IB industry was allocated to companies that applied for a patent before the year the capital was distributed. The focus of VC investment on R&D-based firms became significantly stronger after the year 2008.
VC investments in R&D-based and non-R&D-based companies.
Patent Portfolio of IB Firms Prior to and After VC Investment
Patents of IB firms plus control group firms.
Dynamics of Patenting
Patenting activities of IB firms with VC investment decreased in the post-investment period. When comparing the number of patent applications in the 5 years prior to and after the VC investment, the number of post-investment patents was 31.4% lower than the number of pre-investment patents. In the control group, the number of patent applications fell by only 13.3%. This finding indicates that VC investment focused more on firms with an already established technology portfolio in the IB field that could be exploited commercially without substantially investing in new technology development.
Technology Portfolios
The results of this analysis are not homogenous across fields of technology. In enzyme technology, patenting increased among IB firms with VC investment in the 5 years after the investment (by 11.4%) compared to the number of patent applications in the 5 years prior to VC investment. Patenting decreased by 14.9% among the IB firms from the enzyme technology control group. A main reason for the observed increase in patent activity is the low age of IB firms in the field of enzymes when receiving their first VC investment (4.7 years, compared to 14.6 years for the control group). This result indicates that the field of enzymes is a business area in which VC investors expect future returns from additional investment in new technology development. The strongest decrease in post-investment patenting is reported for biochemicals and bioactives related to agricultural and food applications.
VC investment shows a stronger focus on firms with patents in the field of biofuels. Examining the patent portfolio of VC-backed IB firms prior to investment, 4.7% of patents were in the field of biofuels, compared to only 0.4% for the control group. Of the total number of pre-investment patents in fuel technology (398 patents), 91% of the applications came from IB firms that received VC investment. On the other hand, VC investment was less significant in IB firms with patents in enzyme technology. The share of enzyme patents in the patent portfolio of IB firms with VC investment prior to investment was 24.3%, compared to 38.4% for IB firms with other types of investment.
Conclusions
Through the increasing volume invested in the IB sector as a whole, and in particular for R&D-oriented companies, VC can be regarded as an engine of growth in this emerging industry. The high percentage of VC volume allocated to companies with patents at the time of investment underpins the strong affinity of VC to R&D-oriented firms. But the situation is changing. Most VC investors have shifted their focus toward more mature and thus less risky investment projects during the last years. Before 2009, a significant share of the total VC investment volume was allocated to new companies with an age of up to 3 years. After the financial market crisis the vast majority of VC was directed to more mature companies with an age of more than 3 years.
This conservative investment policy of VC investors presents a worrisome trend for new IB ventures as it inhibits access to external capital. At the same time, this strategy strengthens the role of VC for commercializing new technology in the IB industry. By focusing investment on IB firms with protected new technology, the engagement of VC investors tends to shift the focus of IB firms toward transferring technology into innovation and growth, rather than on continuing to fund new technology development. For young IB firms, the current VC policy implies a stronger emphasis on offering a consolidated and patent-protected technology portfolio to attract external capital for financing the commercialization of technology and the firm's expansion opportunities.