
Abstract

Introduction
Brazil has a long history of biofuels production, starting in the 1970s with the development of ethanol. As a result of earlier efforts, the Brazilian Energy Matrix is currently comprised of 57.9% non-renewable energy and 42.1% renewable energy. 1 The country is considered the least carbon-intensive country in the world. 2 This status was achieved in large part due to government policies and investments in research.
The use of biofuels in the Brazilian Energy Matrix allows for a decrease in greenhouse gas (GHG) emissions. In 2014, the Brazilian Energy Research Company (EPE) calculated that the use of biofuels prevented GHG emissions equivalent to 67.8 million metric tons of CO2 emissions; ethanol use accounted for 59.4 million t of the total. 1 When compared to fossil-based diesel, B7 Biodiesel (7% biodiesel blended with fossil diesel) reduced GHG emissions by 5%. According to the Ministry of Agriculture, Livestock and Supply (MAPA), an increasing percentage of biodiesel in the blend leads to less GHG emissions. 3 In 2014, ethanol use avoided 59.4 million t of CO2 emissions. 1 Nassar and Moreira concluded that sugarcane ethanol produced in Brazil is energy efficient and uses residues in a much larger amount that any other feedstock. 4
This review presents government policies and market characteristics related to the two main biofuels produced in Brazil, biodiesel and ethanol. The primary goal is to characterize the framework put in place by the government, to recognize the potential production and environmental benefits, and to identify how research can help to improve biofuels production and to maintain Brazilian leadership in this area.
Biodiesel
Policies
In July 2003, the President of Brazil created, through a presidential decree, an interministerial working group to study the possibility of using biodiesel as an alternative energy fuel. As a result, in 2004, the National Biodiesel Production and Use Program (PNPB) was created and included three main goals: to promote the sustainable production and use of biodiesel focusing on social inclusion; to ensure competitive prices, supply, and quality; and to diversify feedstock use for biodiesel production in different regions of Brazil.
The Brazilian government participates in the biodiesel market from both the demand and supply sides. From the demand side, the government established a mandatory blend of biodiesel and diesel, through Act 11.097/2005, which included biodiesel in the energy matrix. The original schedule established the following: in 2005 a 2% biodiesel addition was optional; in 2008 a 2% biodiesel addition was mandatory; and finally, in 2013 a 5% biodiesel addition was mandatory. However, the biodiesel industry was able to respond more quickly than anticipated and the original schedule was changed: in July 2008 a 3% biodiesel addition became mandatory; in July 2009 a 4% biodiesel addition became mandatory; and, in January 2010 a 5% biodiesel addition became mandatory. As a result, the regulation was applied in its entirety 3 years ahead of schedule. More recently, in 2014, the blend increased to 6% in July, and 7% in November. 5
From the supply side, the government conceived a set of policies developed and implemented by different ministries to support the PNPB. In order to create employment and income for family farmers in rural areas, the Ministry of Agrarian Development (MDA) created a “Social Fuel Stamp” for biodiesel producers buying raw materials from family agricultural businesses. Through this certification, biodiesel producers are able to benefit from lower federal taxes, which vary according to region and crops; however, to qualify for the social fuel stamp they are required to buy a minimum amount of raw materials from family farmers, which varies according to the region. In the Center-West and North regions they must buy at least 15% of raw materials from family farmers. In the Northeast, South, and Southeast they must buy at least 30% of their raw materials from family farmers. The Ministry of Agrarian Development also sponsors the National Program for Family Farmers (PRONAF), which provides rural credit for small farmers.
MAPA coordinates a Sectoral Chamber for Oilseeds and Biodiesel Production Chain and a Sectoral Chamber for Palm Oil. These chambers work as an advisory forum to identify opportunities for the development of soybeans, other oilseeds chains, and palm oil, and to link the public and private sectors to define common priorities for biodiesel production. 6 Another action of MAPA and MDA is the agricultural zoning climate risk (ZARC), which is a tool to support the management of risks in agriculture. To be eligible for federal subvention of rural insurance, producers should follow agricultural zoning recommendations; some private banks have also defined conditions for granting rural credit based on the zoning recommendations. Furthermore, since 2005, the Ministry of Science Technology and Innovation (MCTI) has invested approximately $67.9 million (based on the 2014 average exchange rate) in the Brazilian Biodiesel Technology Network (RBTB), which articulates research and development of biodiesel. 7
Production
As mentioned previously, the regulatory framework put in place stimulated biodiesel production and, as a result, production increased from 736 m3 in 2005, to 3.4 million m3 in 2014. The rapid increase in production can be explained by the fact that vegetable oil producers were able to use their existing infrastructure to produce biodiesel. Figure 1 shows that biodiesel production capacity is higher than what is effectively produced; consequently, biodiesel producers are always expecting increases in biodiesel blending to be able to use their capacity.
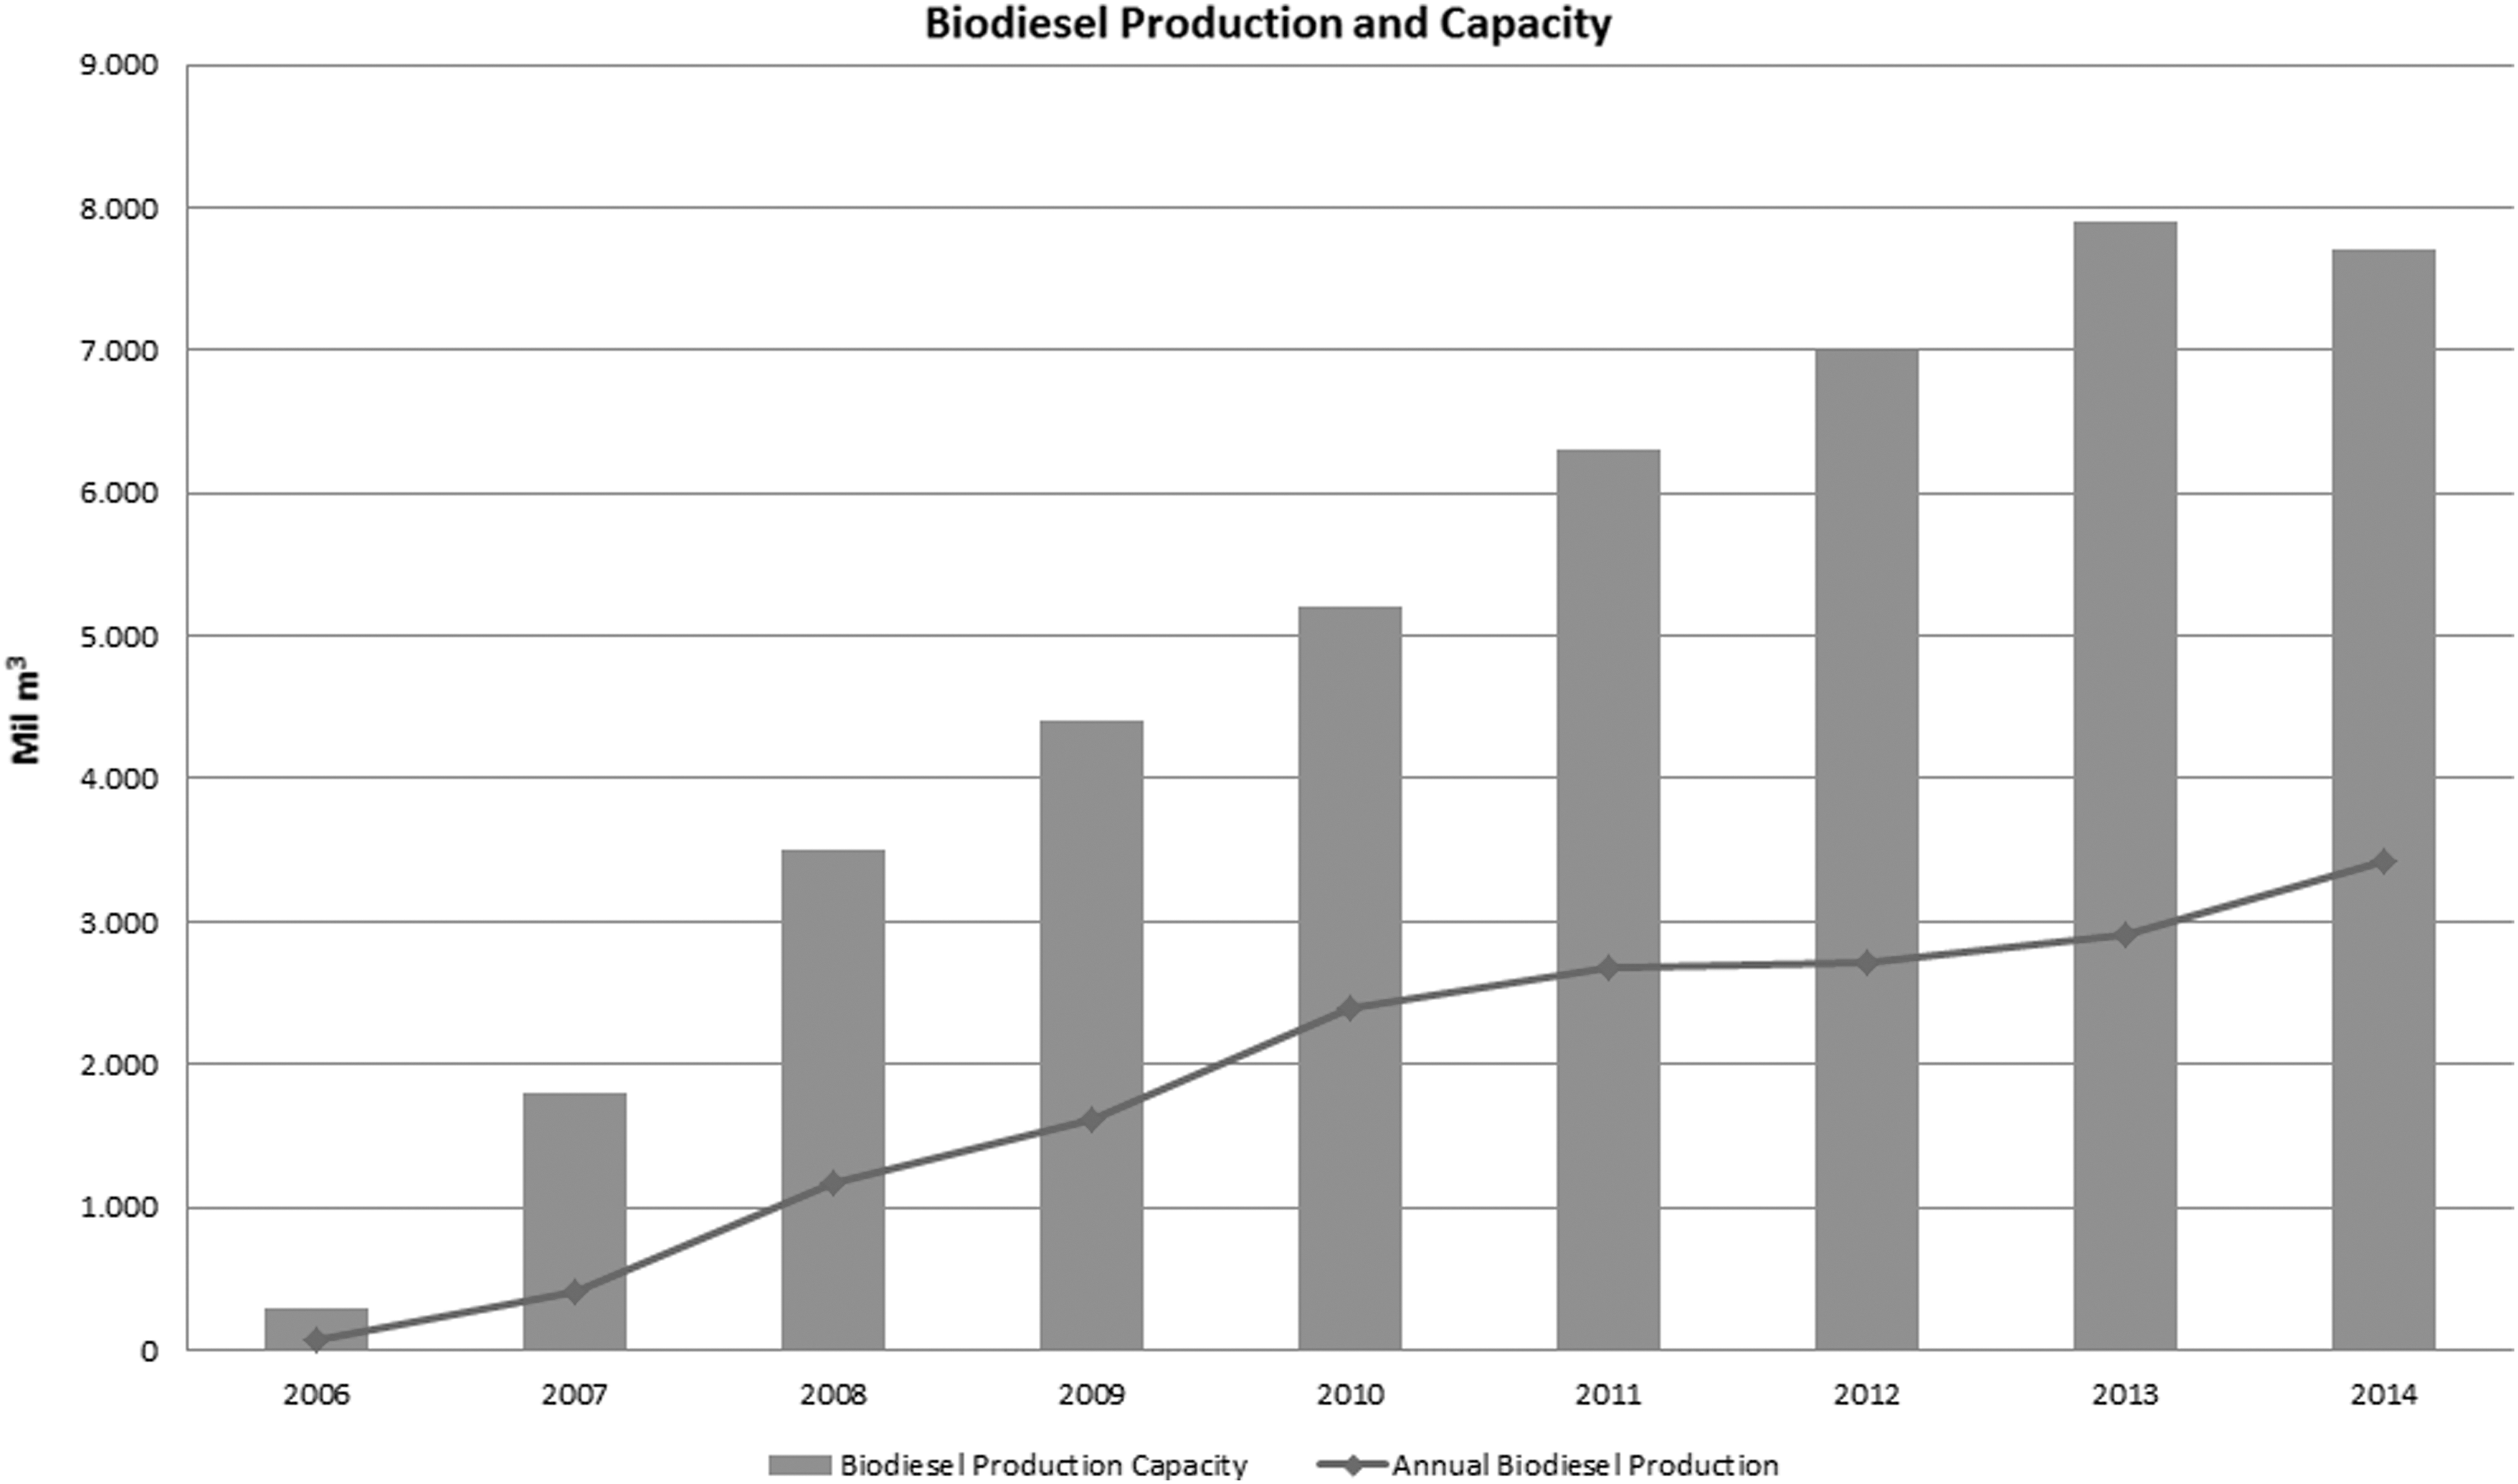
Biodiesel production in Brazil, based on data from the National Agency for Petroleum (ANP). 8
The biodiesel supply chain includes three stages: i) feedstock production, ii) biodiesel production, and iii) distribution. In this section we will concentrate on the first stage, for which there are different feedstock possibilities to produce biodiesel. Table 1 lists several possible crops for use in biodiesel feedstock production. Among the options, palm shows potential, since it has 20% oil content and yields 3–6 t/ha of oil. Compared to other possibilities, oil palm is an appealing alternative due to its low production costs, high potential for creating jobs and income, and the opportunity of using already degraded areas in the North region.
Characteristics of Oleaginous Crops in Brazil 9
When PNPB was launched there was an expectation that a range of feedstock would be used, allowing different regions to produce and benefit from the program. Nevertheless, in 2014, soybeans were responsible for 77% of biodiesel production. In the 2005–2014 period, cotton increased its share from 0.45% in 2007 to 2.25% in 2014. Instead of another crop, though, animal fat is the second main source of biodiesel production in Brazil.
When looking at biodiesel production by region, since 2008, the two main producers have been in the Center-West and South regions. Figures 2 and 3 show that PNPB's objective of having different regions produce biodiesel using many different feedstocks was not attained, indicating that possibly incentives were not enough to achieve this goal.
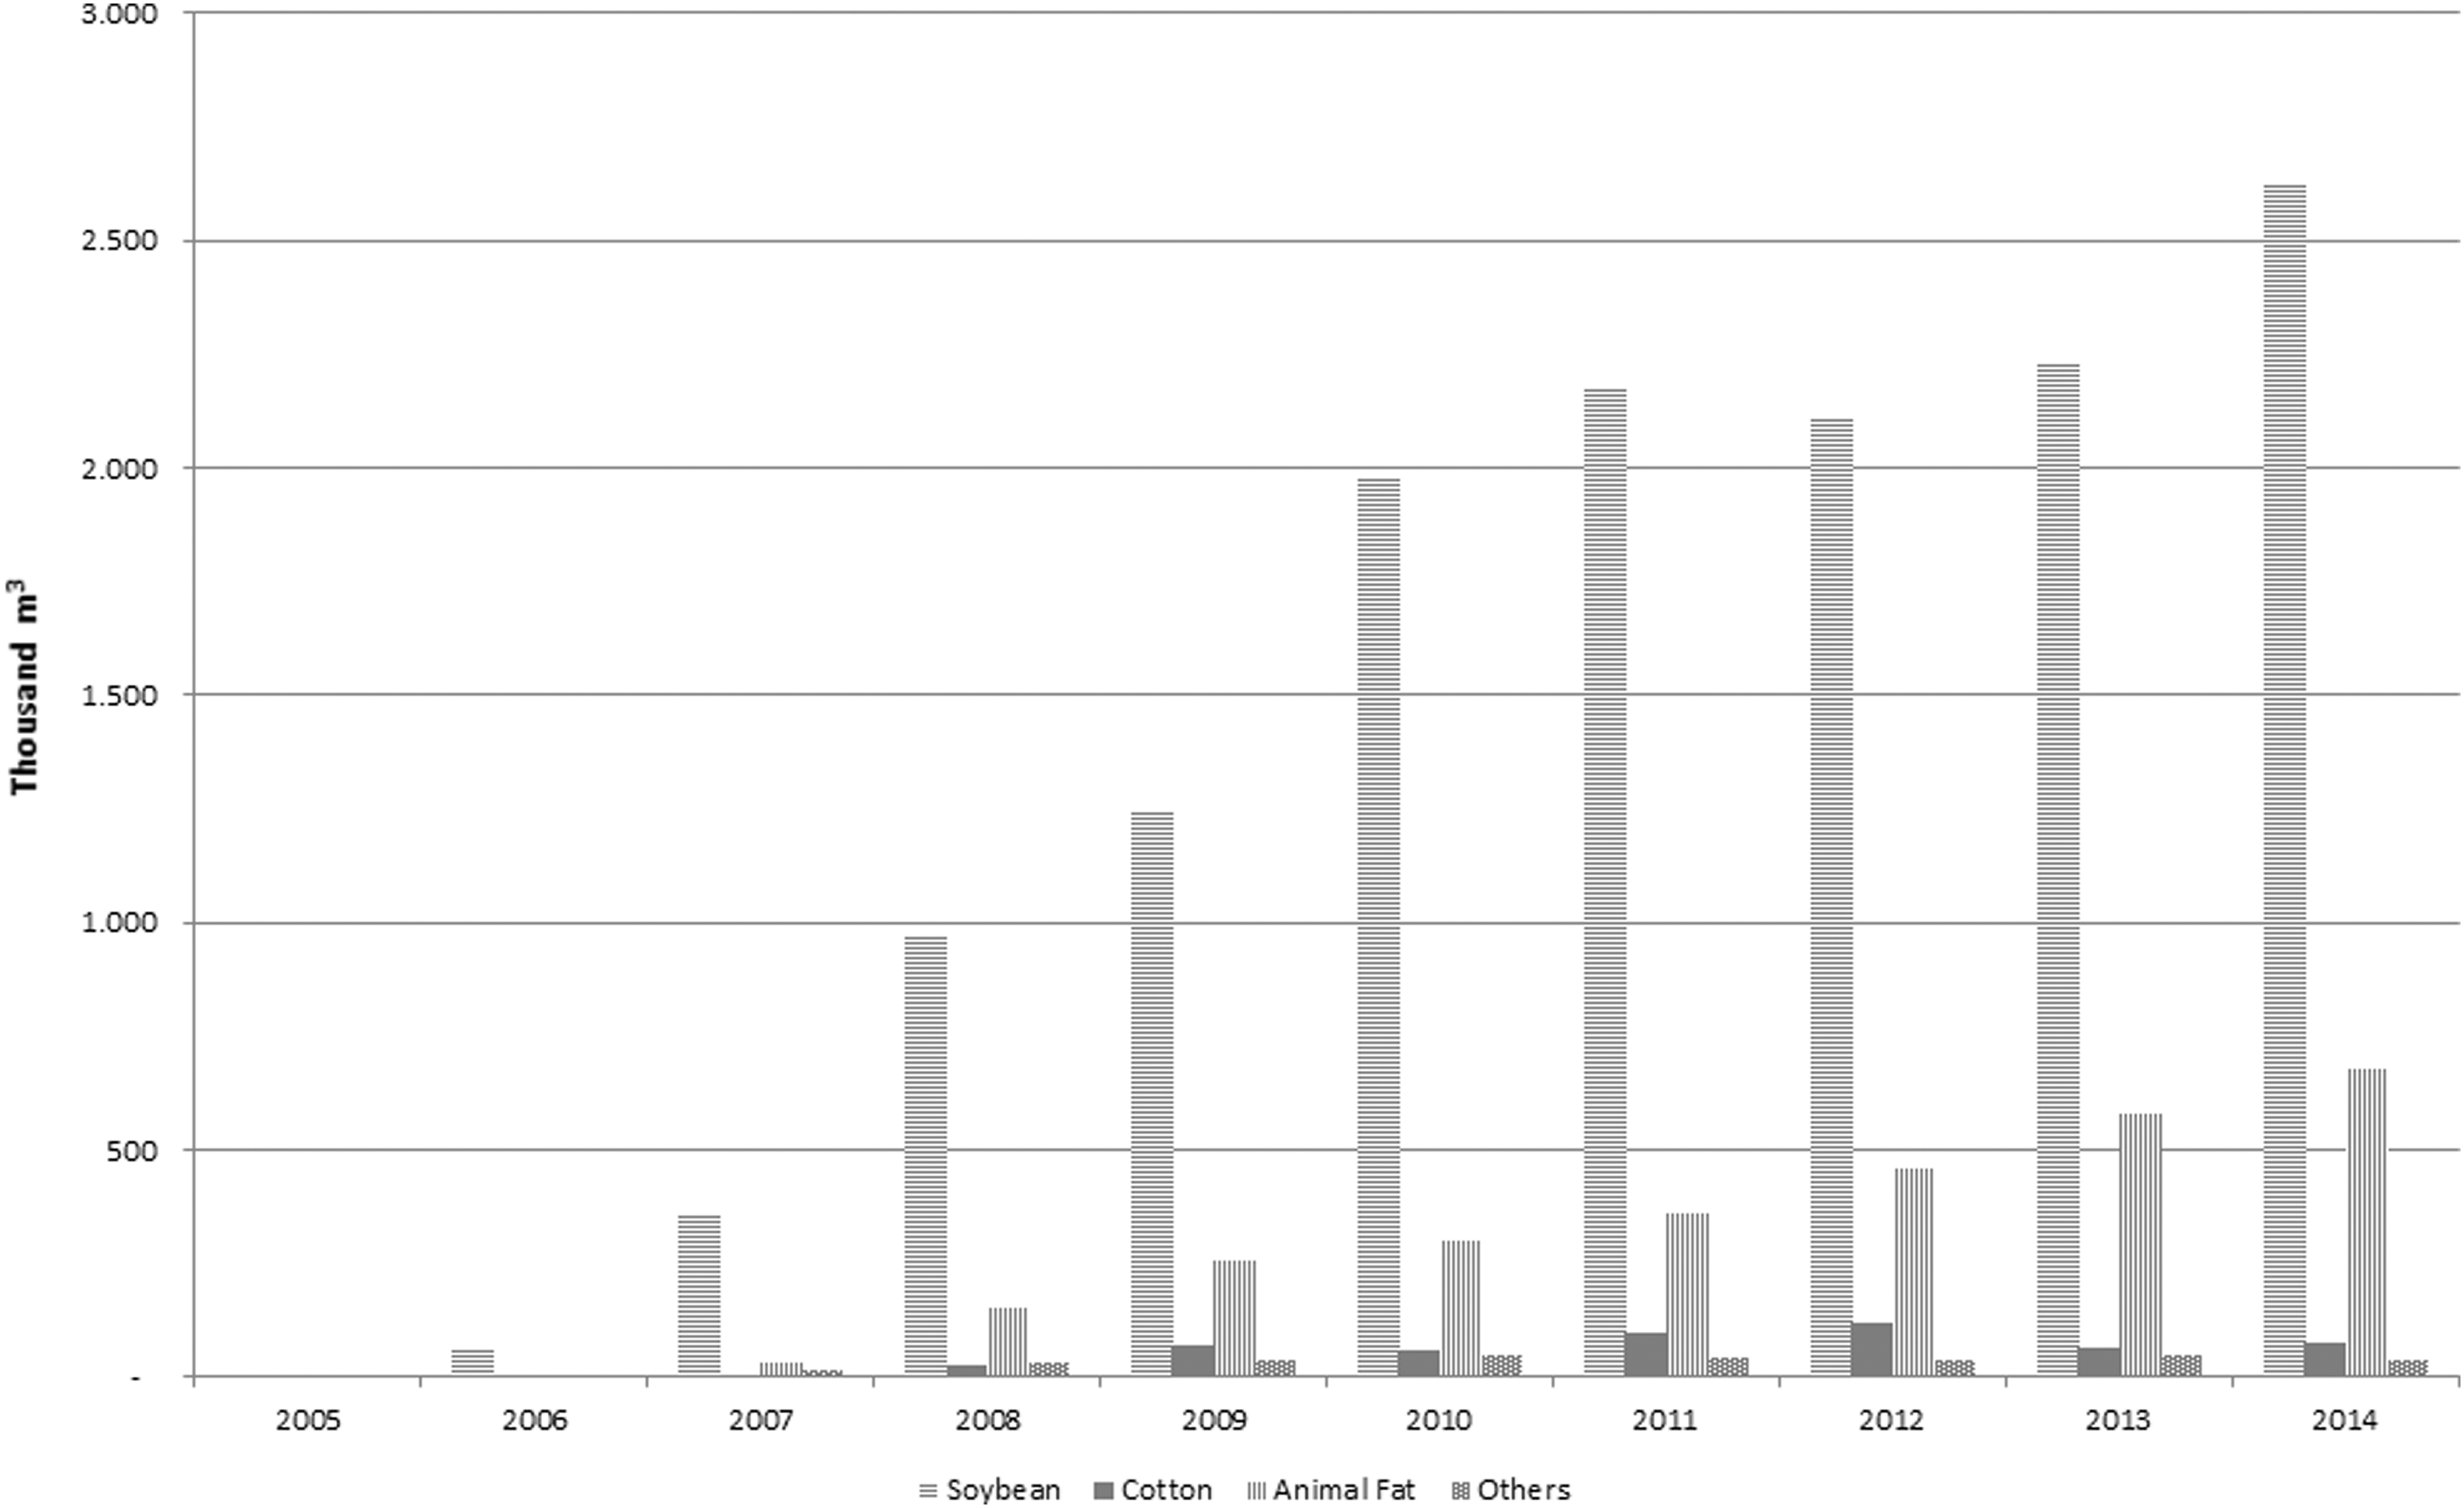
Biodiesel feedstock use in Brazil, based on data from ANP. 8
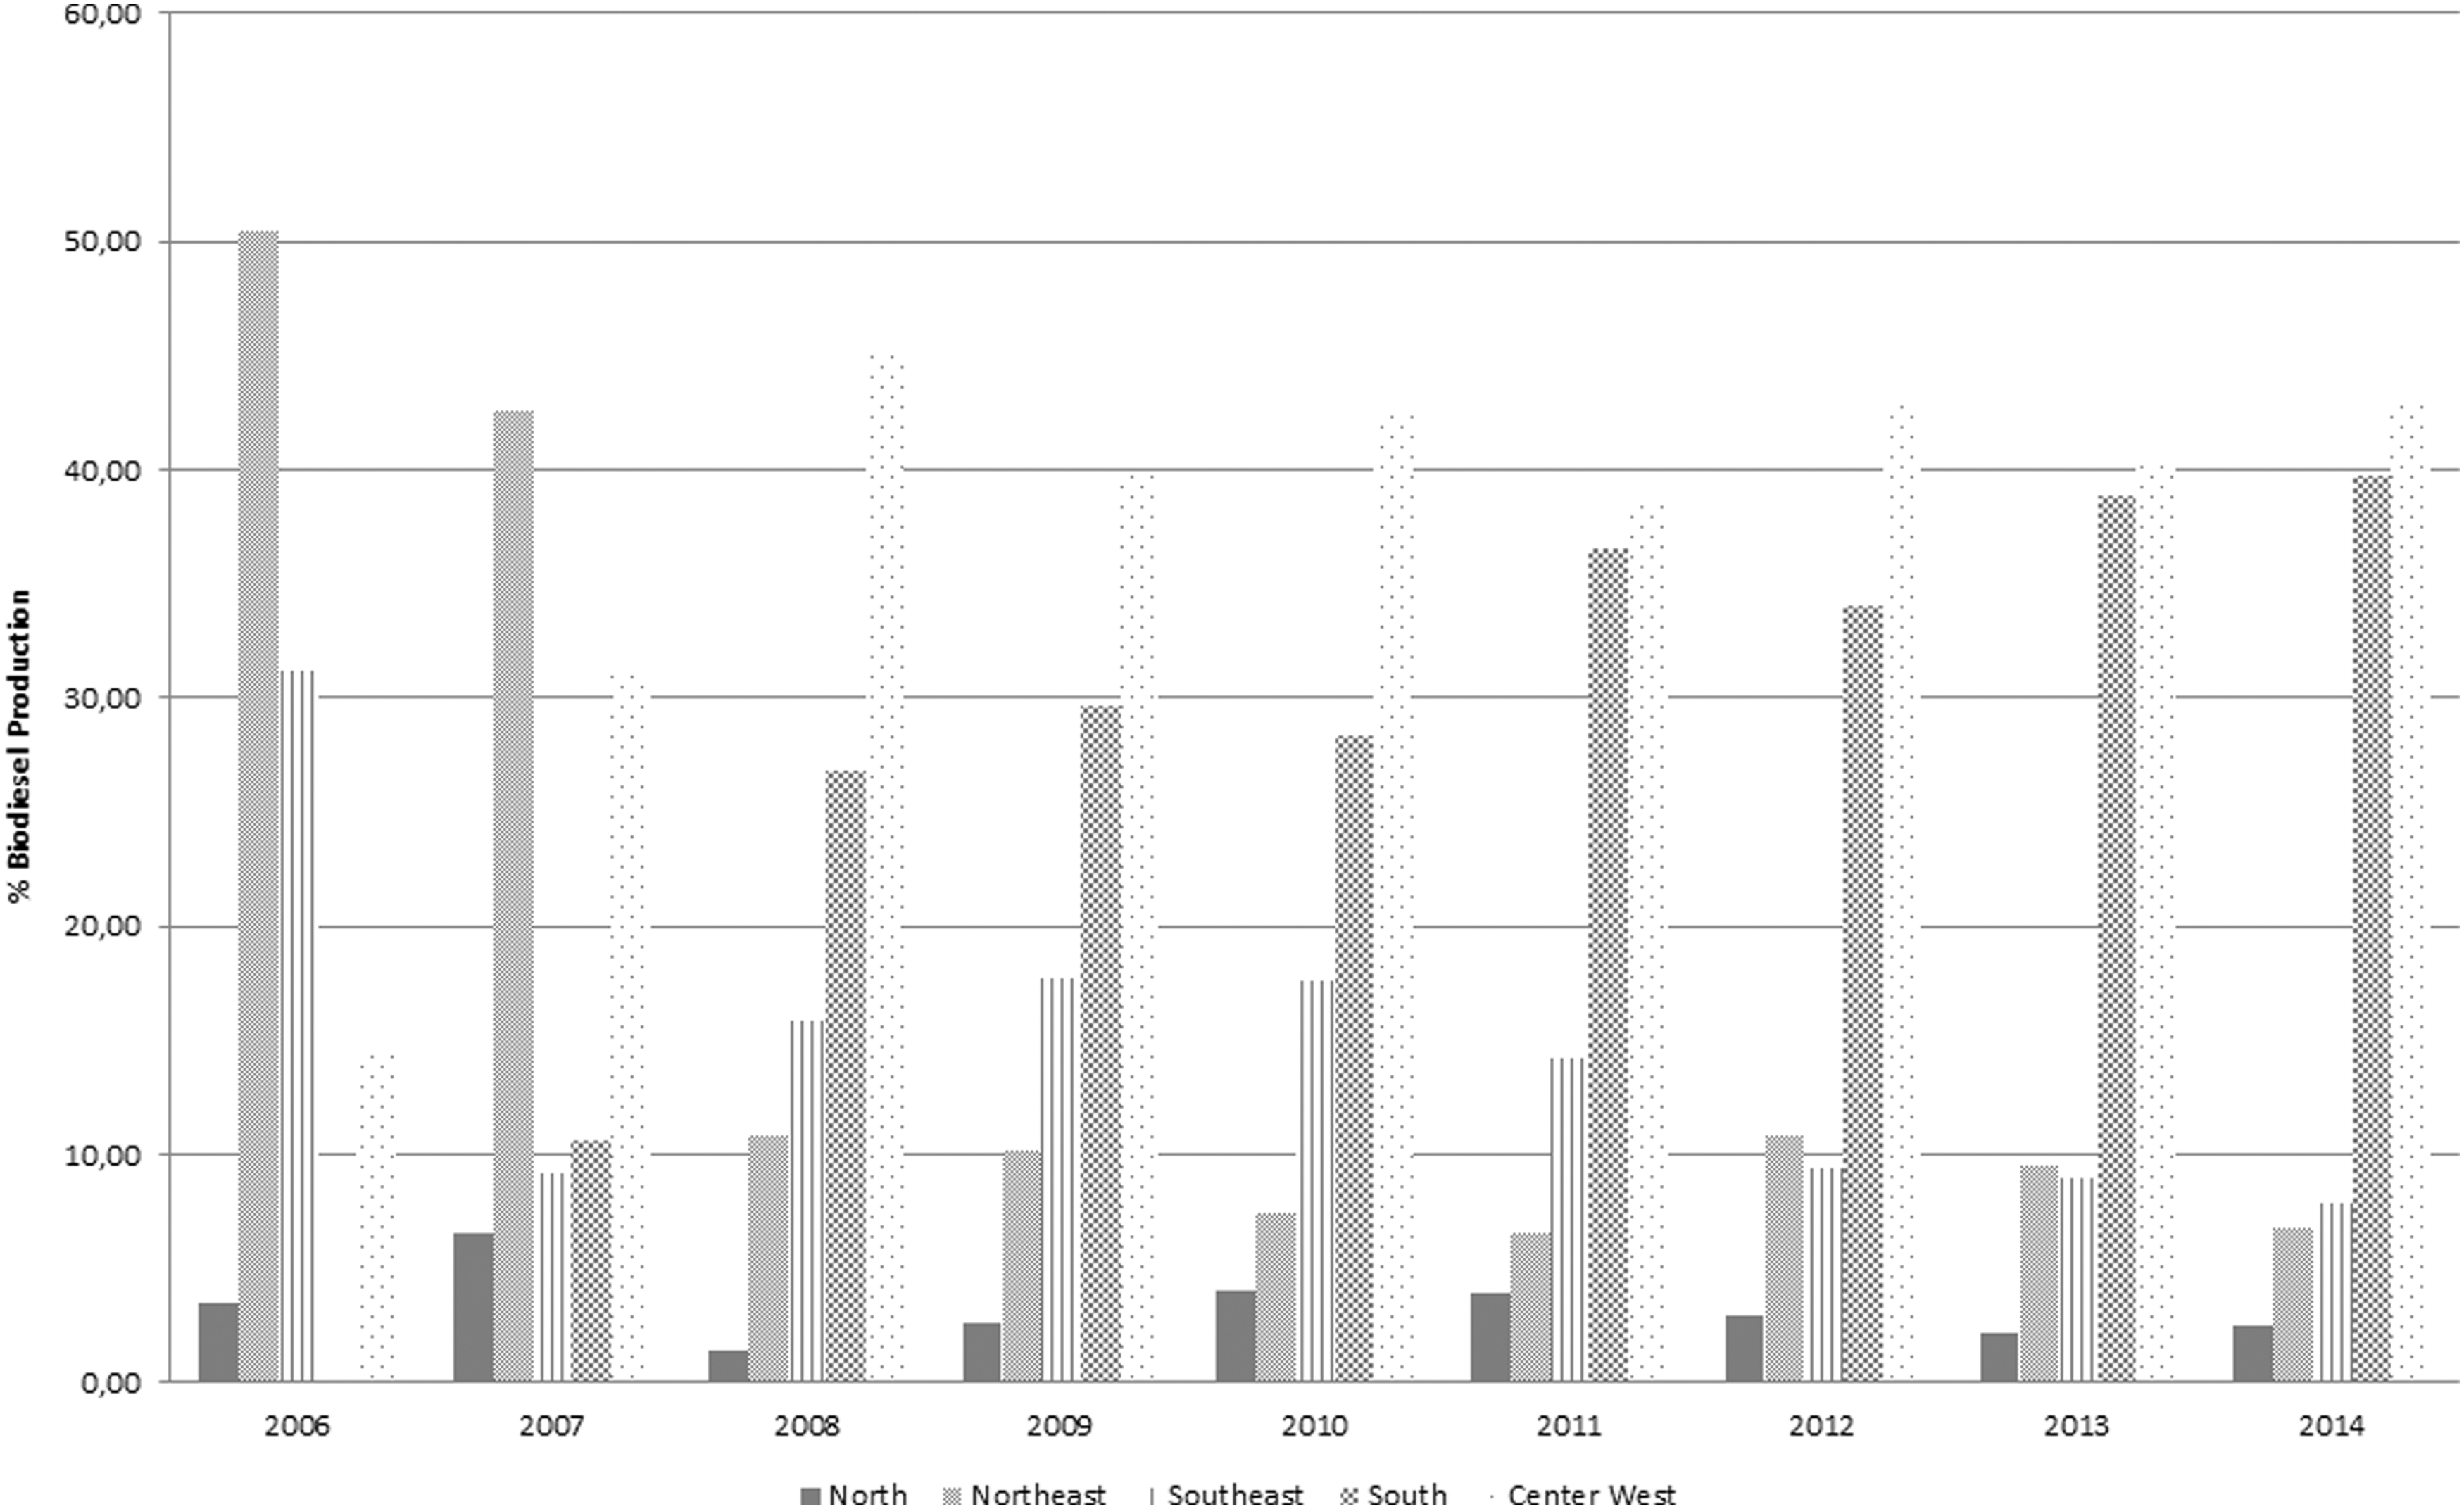
Biodiesel production by region, based on data from ANP. 8
Another important objective of PNPB was to promote social inclusion by incorporating family farmers, especially from the Northeast and North regions, in biodiesel production. Table 2 displays information about the number of family farmers participating over time and the values (in Brazilian real) of feedstock companies acquired from family farmers in each region. The first notable trend is the decrease in participation by family farmers in all regions. Another feature is the predominance of producers in the South region; according to Padula et al., this is due to crop and biodiesel producers being well organized in the region. 13 An analysis of the amount of resources received by family farmers over time showed that the South and Center-West regions benefitted from the largest share of purchases by companies, indicating that PNPB social inclusion has not been achieved as intended.
Number of Family Farmers and Feedstock Acquisition by Companies from Family Farmers Holding the Social Fuel Stamp by Region 12
Challenges
Generally, biodiesel is produced by a chemical reaction between a vegetable oil or animal fat with an alcohol. The chemical reaction requires a catalyst and results in the formation of methyl esters that we know as biodiesel. This process is called transesterification, which is a separation between oil and glycerol. During the process, removal of glycerol from the vegetable oil leads to a thinner oil with less viscosity. The raw material selected for use in the process is important because each of the possible feedstocks has a different composition of fatty acids, which affects the characteristics of the biofuel and its quality.
From the feedstock point of view, there are several possibilities for improvement. As previously mentioned, soybean is the main crop used for biodiesel production, but research is underway for the purpose of diversifying feedstocks to support PNPB in the long run. The idea is to be able to use other crops with higher oil content and higher productivity. Table 3 shows some of the alternatives and their challenges.
Some Alternative Crops for Producing Biodiesel
Ethanol
Policies
The first round of incentives for a major expansion of biofuels was put in place in the 1970s as a response to the 1973 and 1979 oil crises. At that time the focus was on ethanol production, and the Brazilian government elaborated and implemented the National Alcohol Program (PROALCOOL) to substitute (at least partially) ethanol for gasoline in automobiles. After a successful period of ethanol production and consumption, at the end of the 1980s, a decrease in oil prices and an increase in international sugar prices reduced the incentives to produce ethanol in Brazil. During this time, ethanol disappeared from gas stations and this led to a deterioration of consumer confidence in the PROALCOOL program. 15
A worldwide resurgence of interest in ethanol took place in the mid 2000s due to economic and political drivers. At that time oil prices were growing rapidly again and biofuels were considered as an option because they were renewable, and offered a way to reduce GHG emissions from transport. New policies were put in place to encourage the development of biofuels. Among these were the following: • Ethanol use mandate: mandatory since 1977 when the legislation required a 4.5% blend of ethanol to gasoline. This blend had risen as high as 25% throughout the years, but the minimum blend has remained at 18% since 2011. In March 2015, after technical studies, the Interministerial Sugar and Ethanol Council (CIMA) authorized the increase in the ethanol blend from 25% to 27% • Tax incentives for ethanol and ethanol fuel: have changed over time; in February 2015 the government raised federal taxes (CIDE and PIS/Cofins) on gasoline to R$ 0.22/liter (USD0.06/L). (These taxes include the PIS/Cofins and the Contribution for Intervention in Economic Domain [CIDE]. CIDE is a tax for fuels levied on the import and sale of oil- and gas-related products including ethanol; however, CIDE was never levied on ethanol, which increased ethanol's competitiveness.) Some Brazilian states also increased the state tax on trading goods and services (ICMS) on gasoline and reduced the tax for ethanol, further stimulating ethanol consumption • Credit lines: The National Bank for Social and Economic Development (BNDES) provides specific credit lines for the sugar, ethanol, and bioenergy industries to fund investments on sugarcane production, expansion of industrial capacity for sugar and ethanol, cogeneration, logistics, and multimodal transportation. Total financing for the industry in 2014 was R$ 6.8 billion (USD1.70 billion) similar to 2013 (R$ 6.9 billion [USD1.72 billion]). BNDES reports that a total of R$ 5 billion (USD1.25 billion) should be released in 2015 as a consequence of likely lower activity in the industry. In June 2015, MAPA announced the Brazilian Agricultural Crop and Livestock Plan 2015/16. A total of R$ 187.7 billion (USD46.9 billion) will be released to fund agricultural and livestock programs including Prorenova for sugar. The ethanol stock program also known as the BNDES PASS program should release a total credit of R$ 2 billion (USD0.5 billion). The interest rate is set at the “long term interest rate” (TJLP) plus 2.7% per year; payment is due within 270 days. Similarly, the amount of credit per beneficiary has not yet been decided, and the Government of Brazil has not yet given an indication when it will be determined • Ethanol import tariff: according to the Mercosur (Common Southern Market) agreement, the import tariff for ethanol is 20%. However, since April 2010, it has been included in Brazil's “list of exceptions” and the import tariff has been cut to zero
Production
An important issue was the introduction of vehicles powered by gasoline and ethanol, known as flex-fuel, into the Brazilian market. This technology stimulated ethanol consumption and production increased; in 2014, 28.4 million m3 of ethanol were produced (Fig. 4). The economic effects of ethanol substitution for gasoline have been remarkable; since the establishment of PROALCOOL in 1975, until 2012, ethanol replaced more than 2.2 billion barrels of gasoline, equivalent to USD266.3 billion. Estimates of investment for new ethanol facilities construction in the 2005/06 – 2012/13 period exceeded USD40 billion, both from well-established companies and new national and international firms. However, the expansion trend was completely reverted after the 2008 global economic crisis. Some of the factors that could explain this downward trend include:
• Pre-Salt reserves discovery and the expectation that Brazil would become an important player in the oil market
• Credit scarcity for investments in new ethanol facilities due to the 2008 global financial crisis
• Adverse climate conditions–intense rainstorms as well as extreme drought affected harvests in different regions
• Cost of production increases–higher wages, land prices, and interest rates contributed to hydrated ethanol being less competitive compared to gasoline
• Political decisions regarding gasoline prices and taxes affected ethanol demand since they are substitute products
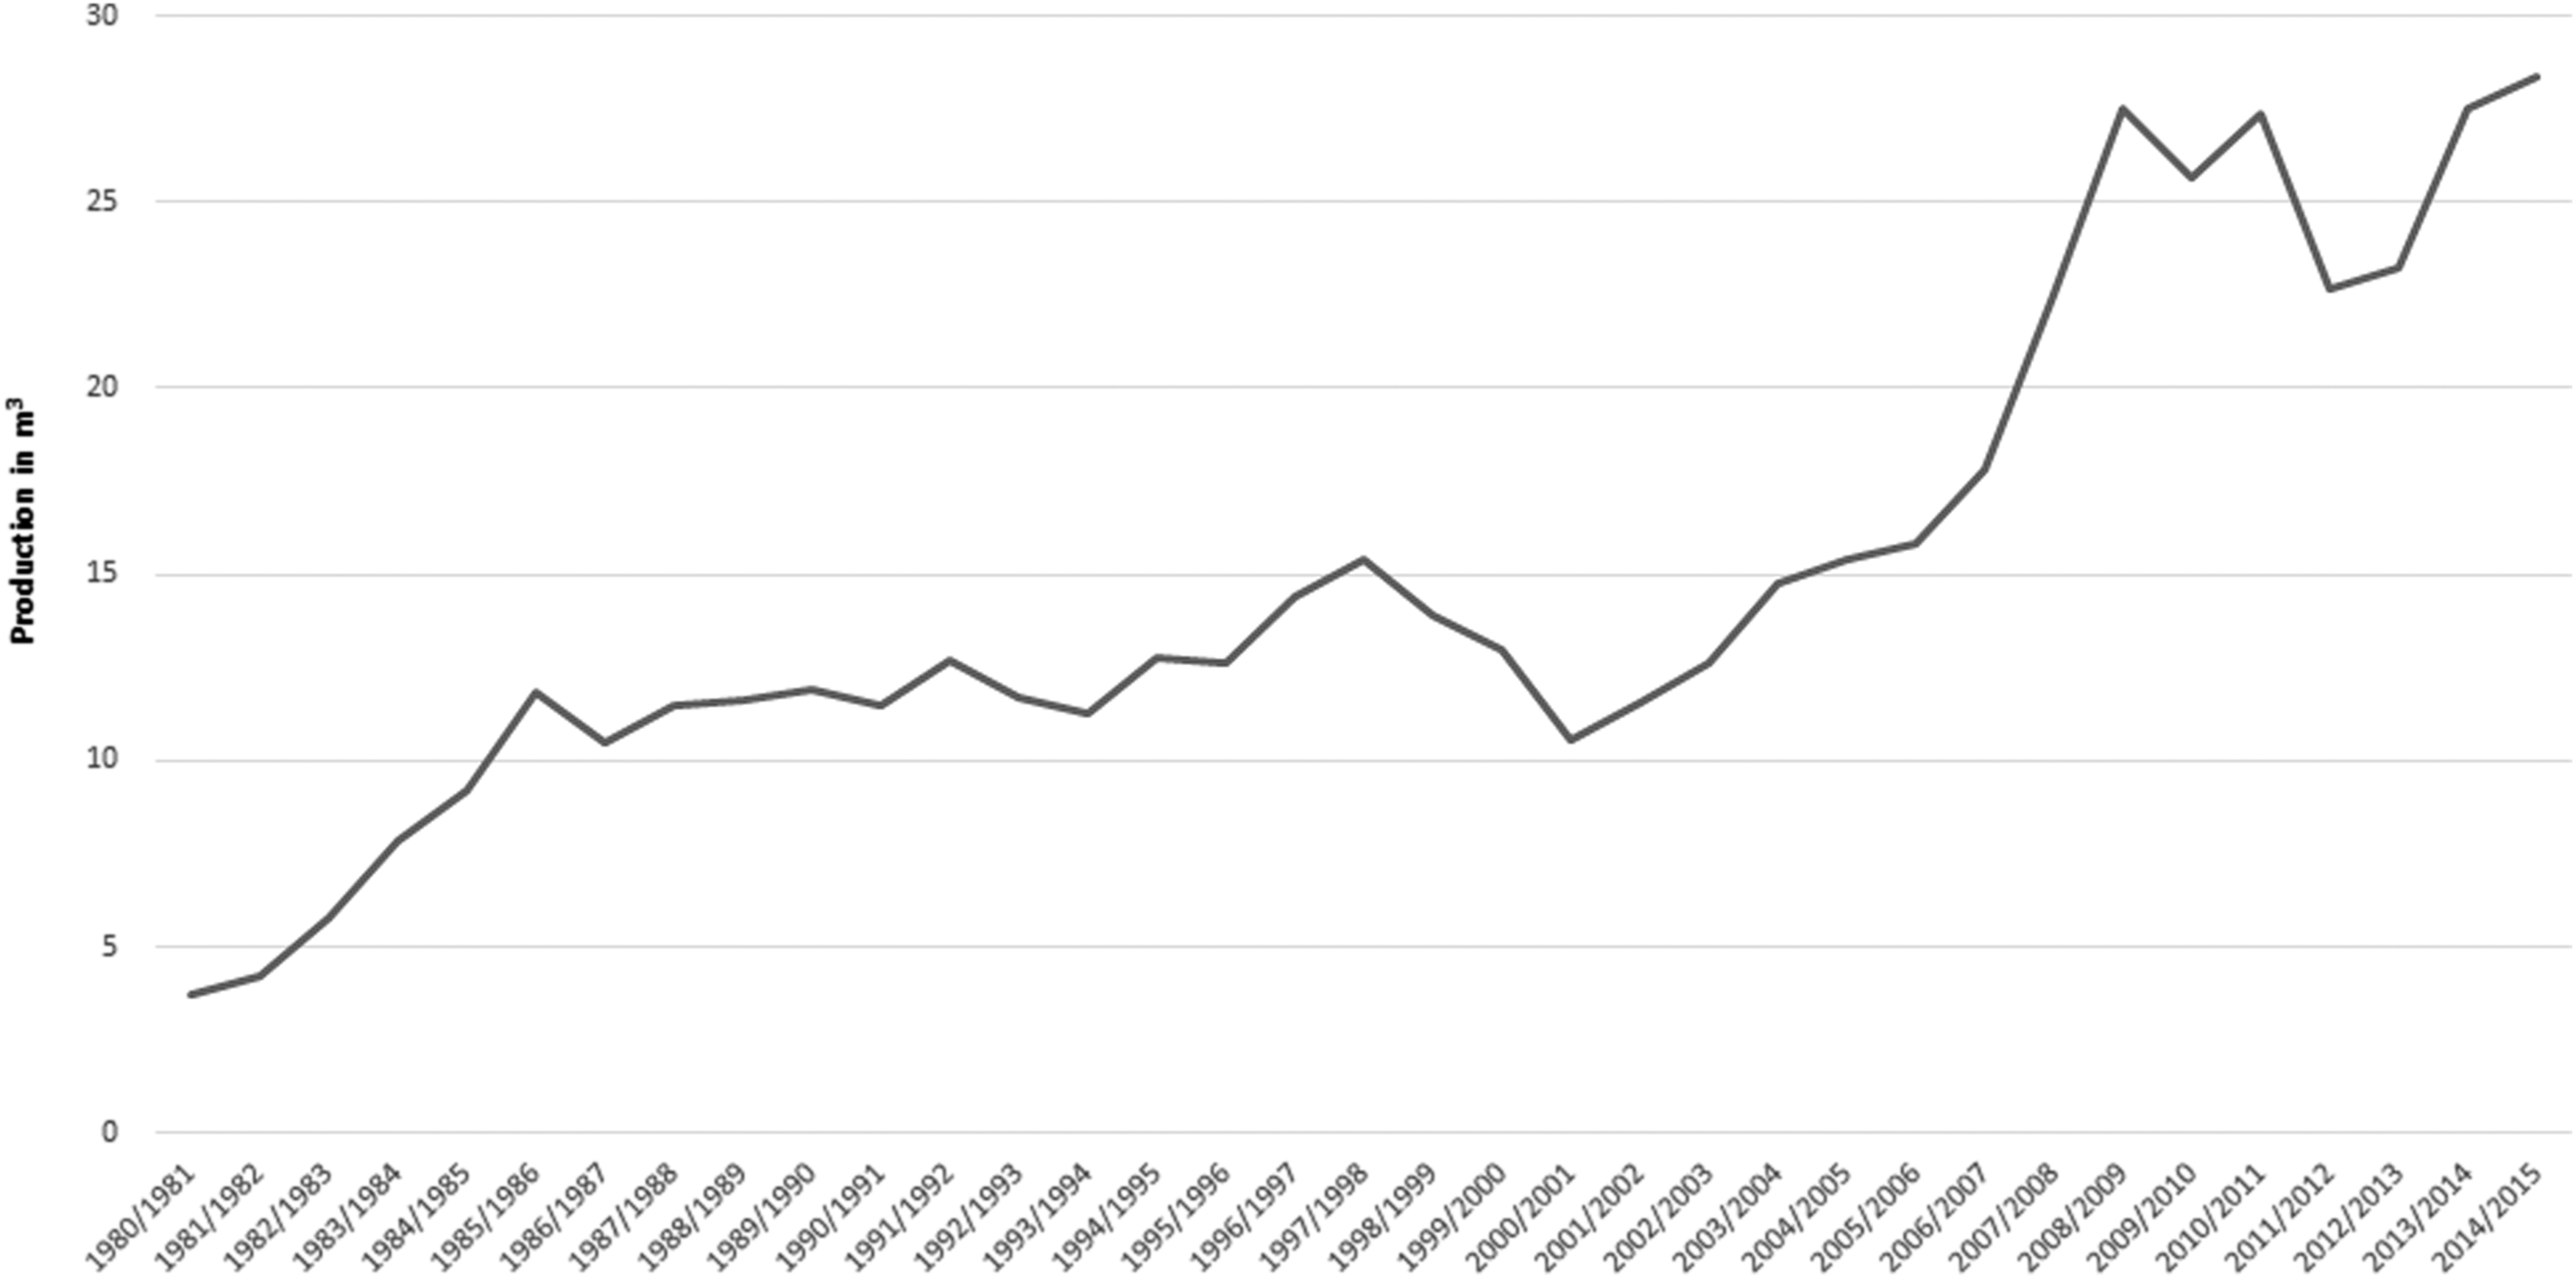
Brazilian ethanol production (in million m3), based on data from UNICADATA. 16
Ethanol production is projected to reach 27.3 million m3 in 2015/2016, and ethanol exports are forecasted at 1.8 million m3. 17 To boost ethanol production, sugarcane production has also increased, as shown in Figure 5. During the last 35 years, an ascending trend in sugarcane production is evident.
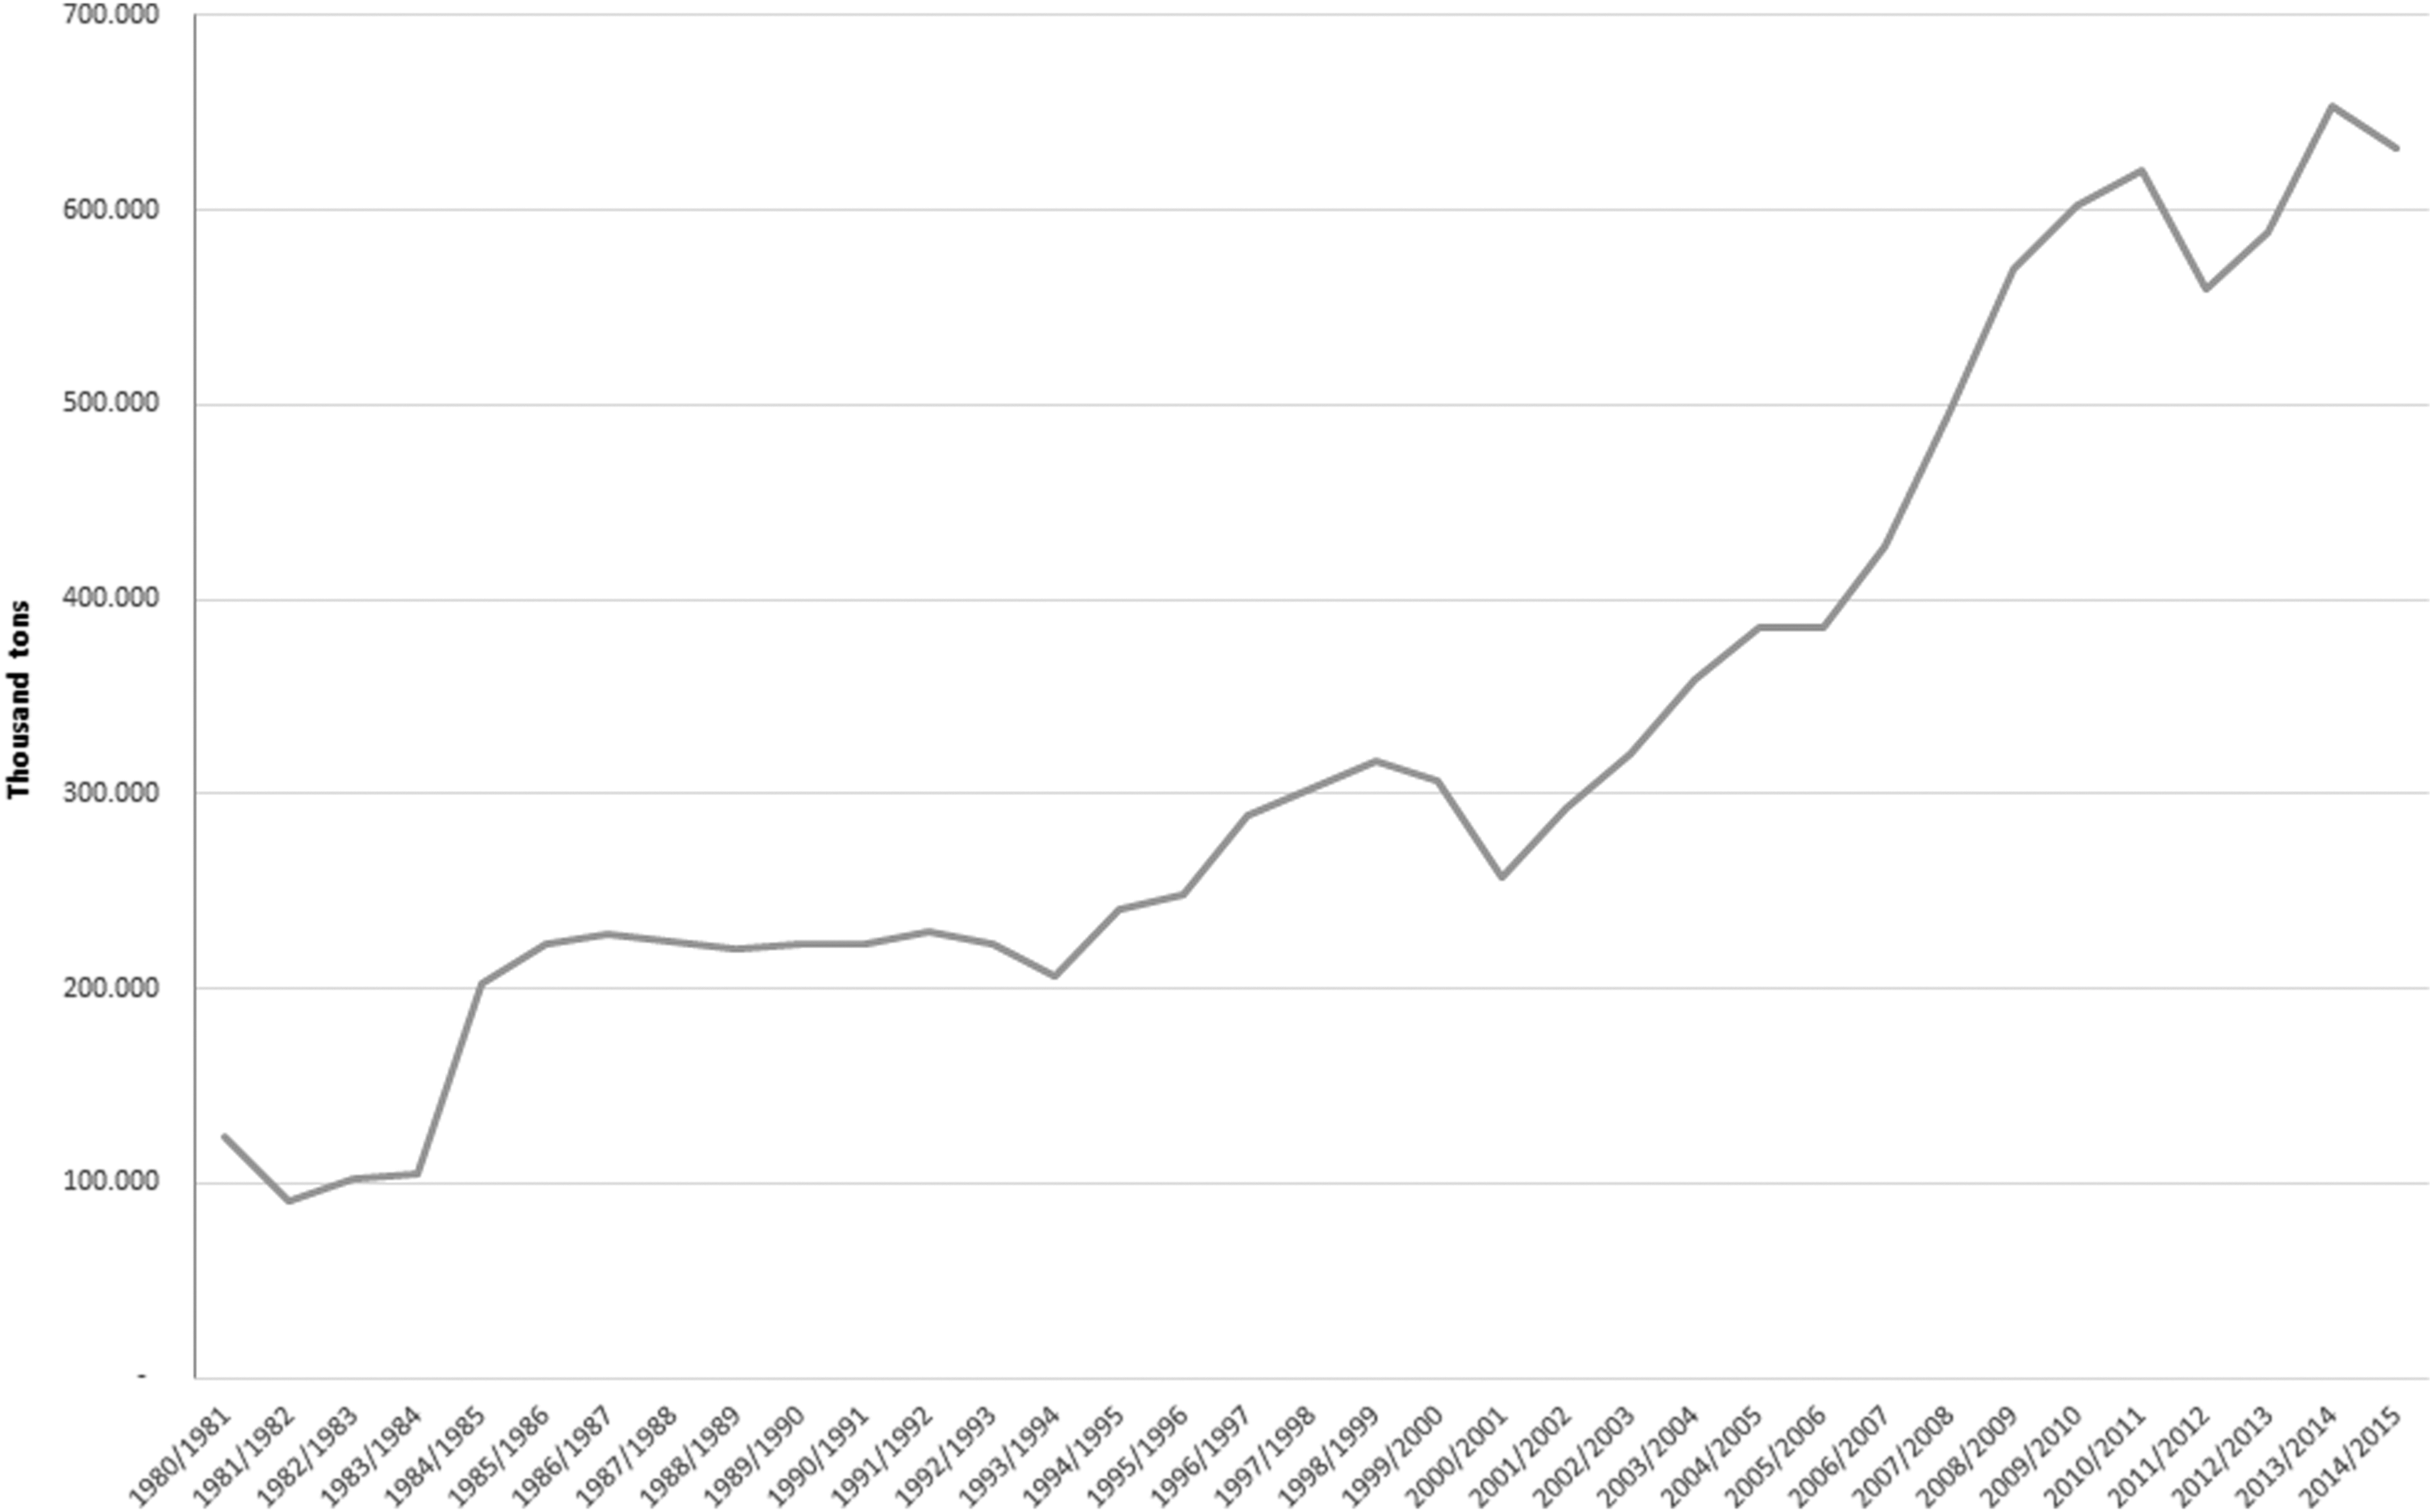
Sugarcane production (in thousand metric tons), based on data from UNICADATA. 16
During the period 2003–2010, production of flex fuel vehicles expanded, and currently there are 15 million flex fuel cars in Brazil (Fig. 6). The resulting increase in biofuels consumption will translate to a reduction of GHG emissions and a decrease in the country's dependence on oil imports.
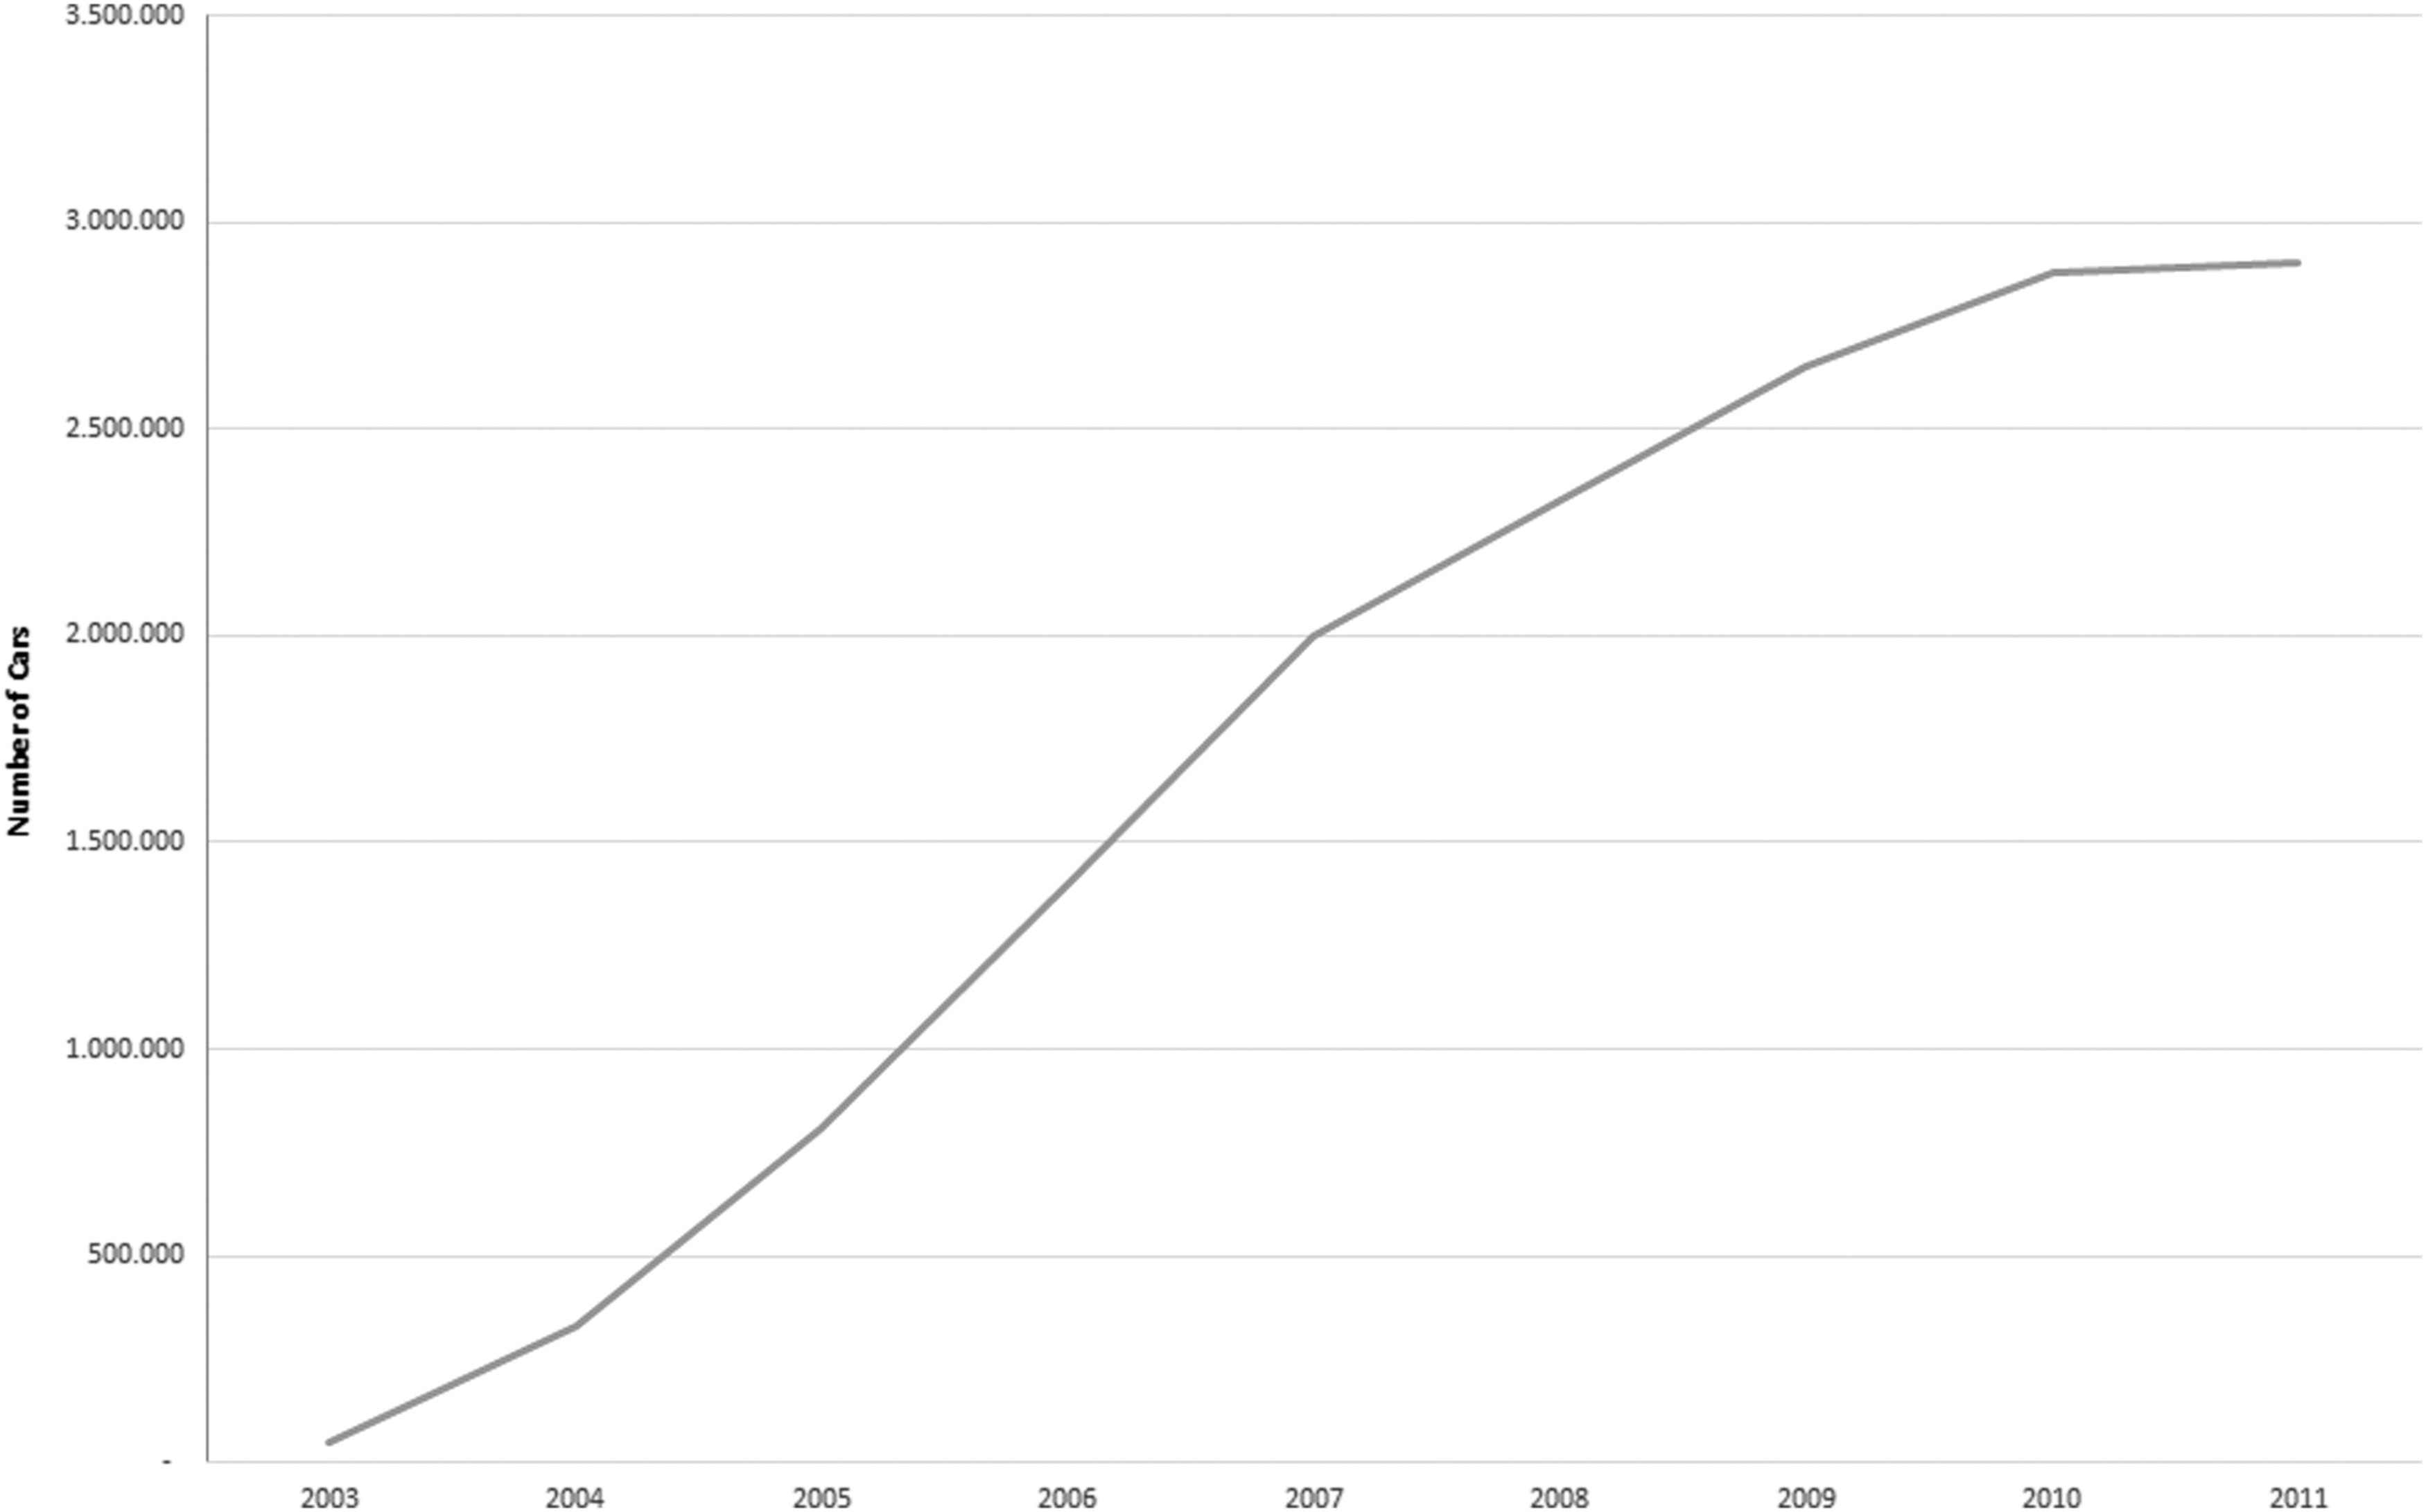
Number of flex-fuel licensed cars in Brazil, based on data from ANFAVEA/CNI. 18
Challenges
Companies working in this sector report challenges in ethanol production, mainly related to agricultural and industrial links in the supply chain, as detailed in Table 4. 19
Challenges in Supply Chain Links for Ethanol Production 19
Conclusions
The Organisation for Economic Co-operation and Development and Food and Agriculture Organization (OECD-FAO) Outlook for the period 2015–2024 presents projections about world and Brazilian biofuels production and anticipates that by 2024 global ethanol and biodiesel production will reach 134.5 and 39 billion liters, respectively. 20 The expectation is that Brazilian ethanol production will contribute most of the additional supply, while projections indicate that Brazil will be the world's third largest producer of biodiesel, with production increases boosted by the domestic mandate. Overall the prospect is that Brazil will continue to be a world leader in biofuels production.
In this review, we describe how ethanol and biodiesel have different challenges regarding production, technology, market conditions, and policies needed to maintain their competiveness in the national and international markets. In the case of biodiesel, there are several possibilities of feedstock for production; however, it is essential to invest in research, and researchers have indicated the main areas to target for improvement. Feedstock diversification will allow production in different areas in the country and inclusion of more producers. For ethanol, some of the main challenges are in the adaptation to mechanized harvesting, the efficient use of its residuals, and the improvement of technologies for producing second-generation ethanol. It is clear that when incentives are well placed, researchers and producers are able to deliver. Thus, it is necessary to find the correct incentives to be applied in areas already identified as priorities. It would be disappointing to lose the leading position that Brazil has achieved, and for which many countries are competing to attain.