
Abstract

Introduction
Enzymes—proteins that function as biological catalysts—play a crucial role in the majority of processes that occur in living organisms and are used routinely in the development, manufacture and application of products ranging from biopharmaceuticals to biofuels. Although studies of enzymes and the reactions they catalyze have been undertaken for over fifty years, there remains an ongoing need for increasingly efficient and detailed analysis to further enhance our ability to exploit the potential of enzyme-driven reactions. Reliable kinetic data is crucial when working to understand and control enzyme effectiveness or to inhibit enzyme-catalyzed reactions.
Obtaining kinetic data typically involves the use of biochemical activity assays, but isothermal titration calorimetry techniques (ITC) have been successfully applied more recently. ITC is a well-established, versatile technique that is widely used for measuring reaction thermodynamics. ITC generates real-time, continuous data, which can be used to efficiently build a reliable set of enzymatic kinetic data. In this article, we examine its use within this context, presenting example data associated with biofuel processing that demonstrate the advantages of ITC relative to traditional methods.
Understanding Enzyme Behavior
When catalyzing a reaction, an enzyme (E) first binds to a natural substrate (S). Initial interaction may be relatively weak, but subsequently induced conformational changes tend to strengthen the binding, bringing the substrate and catalytically active sites into close proximity. The reaction then proceeds via the formation of enzyme-substrate (ES) complexes (equation 1), which go on to generate a product (P). The enzyme can then be used for another catalytic reaction. For simple systems in which the substrate is present in excess, this process can be modeled using Michaelis-Menten kinetics (equation 2):
where k1 is the rate constant for the formation of ES; k-1 is the rate constant for dissociation of ES; kcat is the catalytic rate constant; v is the reaction rate; Vmax is the maximum velocity if all the enzyme was present as ES, and KM is the Michaelis constant (KM = (k-1 + kcat)/k1).
The mathematical definition of KM means that it effectively quantifies the affinity of binding between the enzyme and its substrate when product formation is the rate-limiting step. The lower the KM, the lower the concentration of substrate required to achieve a given rate. This makes KM a valuable metric for comparing and contrasting the performance of different enzymatic systems and, more specifically, for establishing the approximate concentrations of intracellular substrates; comparing the performance of enzyme isoforms from different organisms or tissues; comparing the performance of native and recombinant forms of enzymes; and identifying strategies for ligand-induced enzyme activity modification.
Measuring Kinetic Constants
Many enzymes can now be routinely expressed as recombinant proteins, and their associated substrates can usually be produced in a similar way or chemically synthesized. With both components in place, the challenge is then to identify an efficient technique for detailed study of the reaction. In systems where the substrate or product is amenable to detection, typically by spectrophotometry, KM and Vmax can potentially be determined simply by adding the enzyme to solutions of different substrate concentrations and monitoring the resulting product formation. This enables the construction of a rate curve—a plot of rate against [S] that can be used to determine both parameters (Fig. 1).
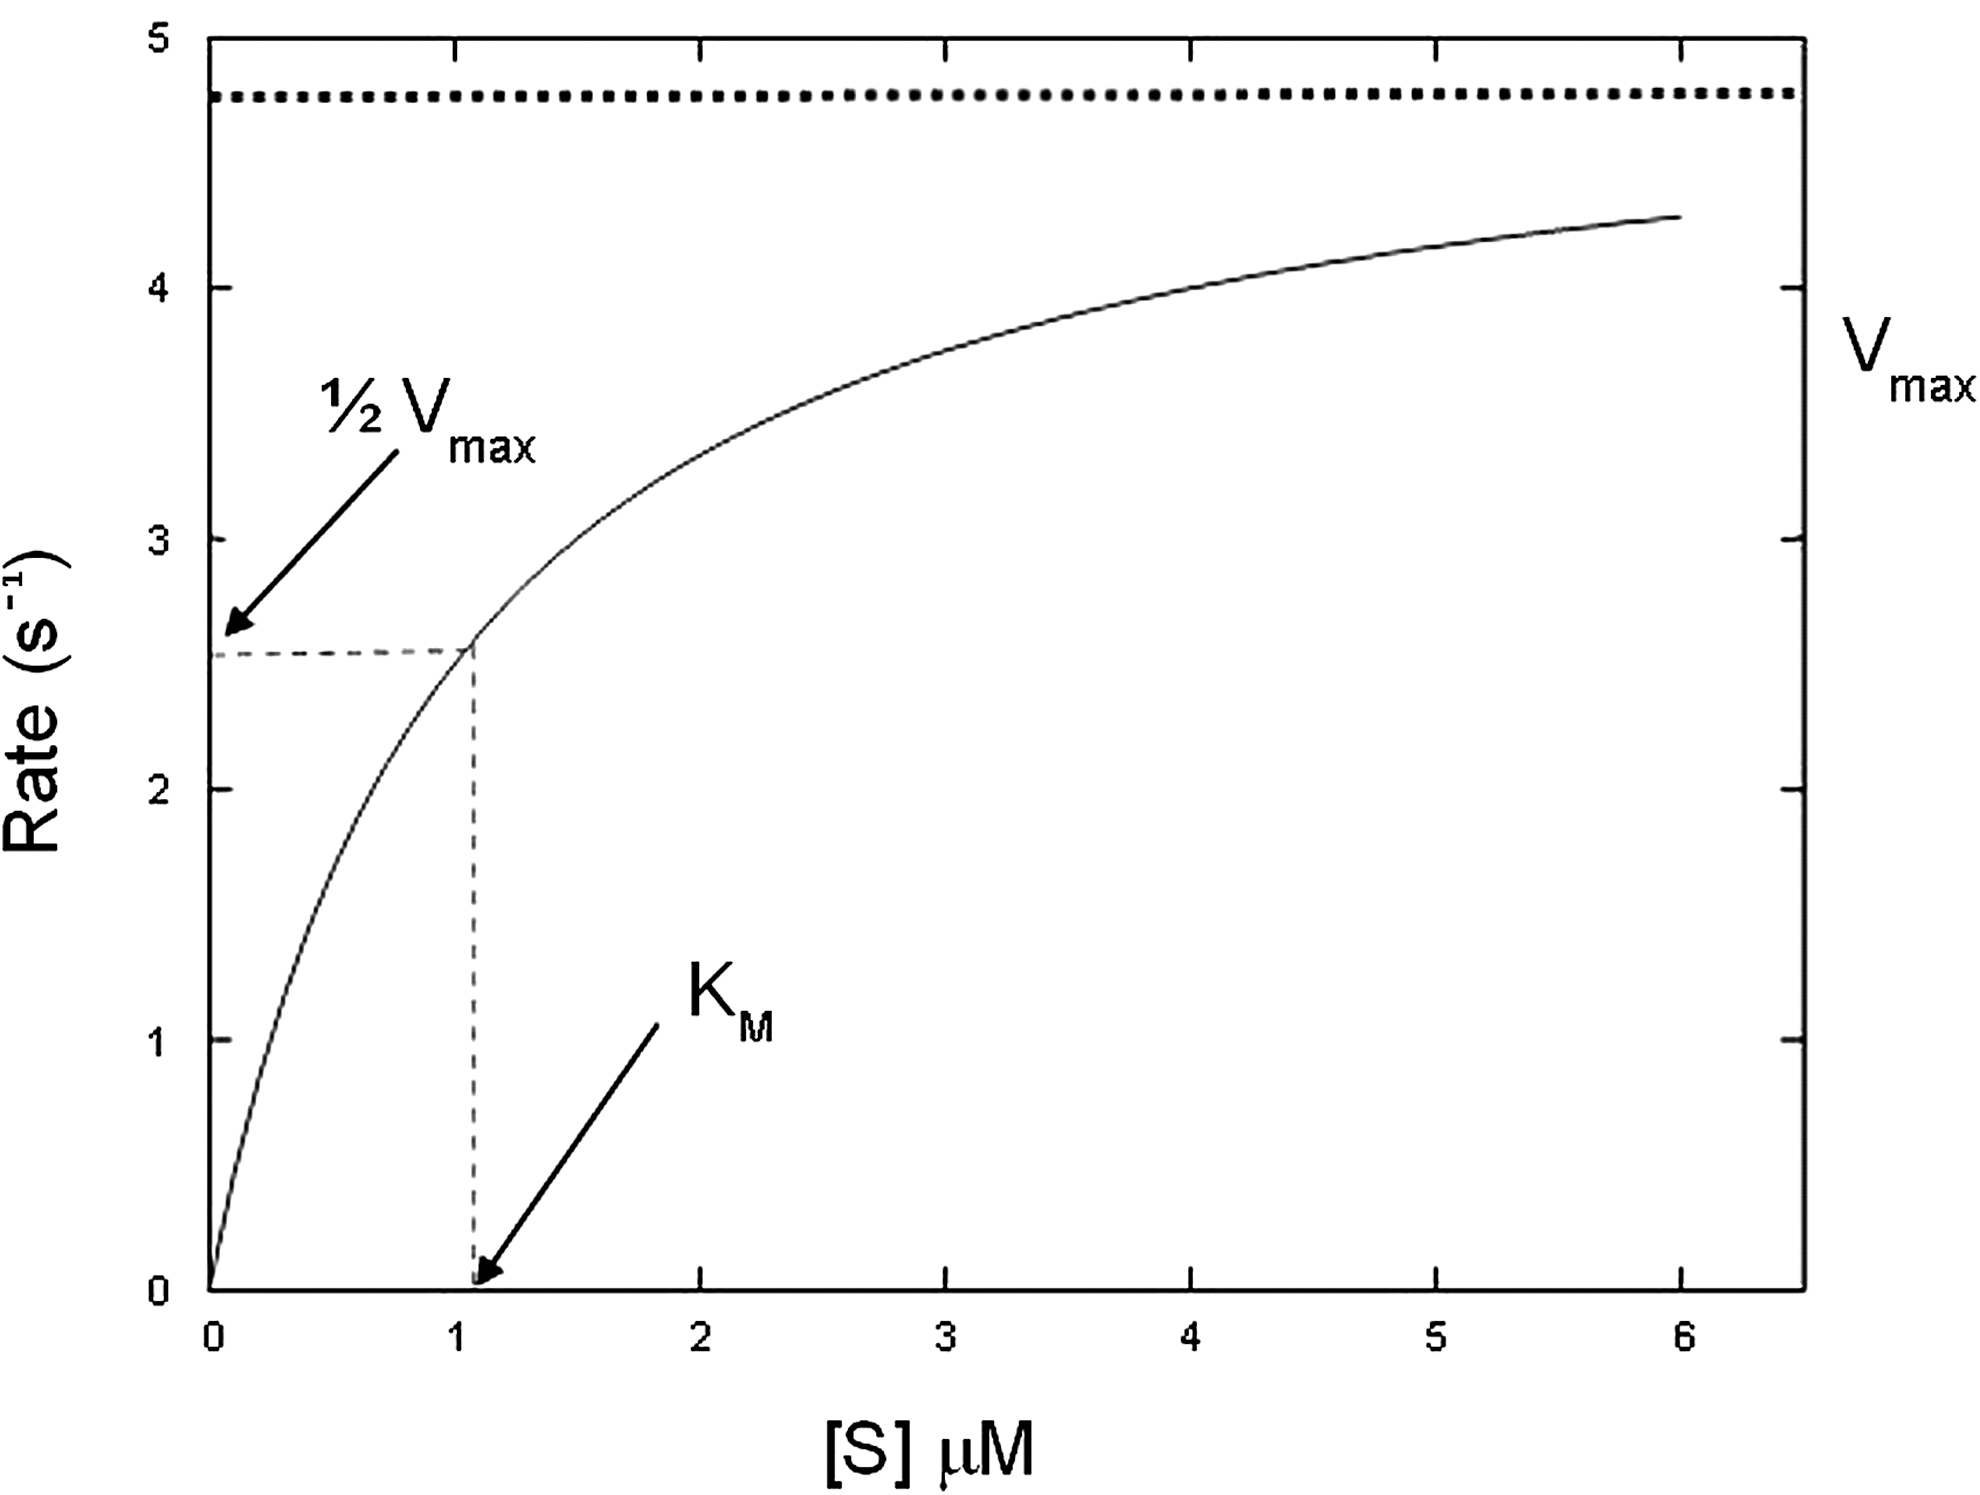
A simulated Michaelis-Menten curve (generated using equation 2); KM = 1 μM, kcat = 5/s; enzyme concentration fixed at 1 nM. At the substrate concentration denoted by the dotted line, exactly half the enzyme molecules are in an ES complex at any instant and the rate is exactly one half of Vmax.
However, in many instances the product does not have a convenient chromophore. Equally importantly, the use of chromophore-containing substrate analogs can complicate experimental design strategies and be cumbersome and expensive. An alternative approach in these situations is to use stopped-flow or quench-flow techniques. This involves conducting a single experiment multiple times, for increasing periods of time, by quenching the reaction. Again, this provides the data needed to generate a full kinetic curve and the required parameters. However, this approach can be relatively complex and time-consuming, especially when measuring fast kinetics and/or when it is necessary to isolate intermediates to measure their concentration.
ITC is a generally-applicable, label-free assay technique that can be applied to any enzyme-catalyzed system, provided that the reaction is associated with a change in enthalpy. Experiments are quick—typically in the order of just a couple of hours—and only small amounts of material are required, making it an appealing alternative to the methods outlined for kinetic studies.
Introducing ITC
ITC works by directly measuring the heat released or absorbed during a molecular binding event. In a microcalorimeter (Fig. 2) there are two cells—one contains water and acts as a reference cell, while the other contains one of the binding partners or reactants in solution. The microcalorimeter maintains these two cells at exactly the same temperature through the use of heat-sensing devices that detect any temperature difference and trigger a response from the heaters when necessary. This response compensates for any temperature difference, rapidly returning the cells to equal temperature as the second binding partner is injected into the sample cell in known aliquots over a well-defined time period.

How ITC works. Schematic of ITC cells and injection syringe (left); Representative raw ITC data from titration experiment (middle); Representative binding isotherm from ITC experiment, fit to one set of sites binding model (right).
ITC for enzyme kinetics
ITC experiments for enzyme kinetics reactions are typically conducted in the multiple titration mode, with multiple injections of the substrate generating multiple rate determinations under steady-state conditions in a single experiment. As the substrate is added via the titration syringe, there is a reaction that either takes in or releases heat, triggering a response from the ITC heaters. The data generated shows a spike with a positive or negative area associated with each injection. (Fig 3).

Raw calorimetric data for the measurement of the reaction rate for the hydrolysis of PNPP by PP1-y.
The amount of heat involved with converting n moles of substrate to product is given by the following expression:
where ΔHapp is the total molar enthalpy for the reaction and V is the volume of the reaction solution (the cell volume).
The rate of reaction is directly proportional to the thermal response measured by the ITC instrumentation, since it correlates directly with the heat produced (Q) as function of time: Power = dQ/dt. (Fig. 3). The mathematical manipulation of equation 3 shows how measurements of power made during ITC experiments, which are equal to the rate of change of heat, directly measure reaction rate, (d[P]/dt):
Developing a Michaelis-Menten plot using ITC relies on using the calorimeter to measure two parameters: ΔHapp and dQ/dt—power generated as a function of substrate concentration. To determine the total molar enthalpy, experiments are carried out using sufficient enzyme to convert all of the injected substrate into product in a given time period. Integration of the resulting peak measurements with respect to time yields the total heat produced by the reaction, which can be divided by the amount of substrate present to give ΔHapp. dQ/dt data are then generated via multiple titration mode experiments. The minimum response time of modern ITC systems is about 10–20 sec, so they are sufficiently responsive to directly study enzyme reaction rates.
ITC makes it possible to generate kinetic data and a thermodynamic profile for the enzyme reaction from a very limited number of experiments. The data generated include an approximate value for the equilibrium association constant for the enzyme-substrate complex when product formation is the limiting step. Furthermore, direct measurements of the apparent molar enthalpy for the reaction enable valuable energetic insights into linked protonation effects that can have a marked influence on enzyme performance. 1
These attributes make ITC an efficient and convenient tool for detailed investigation of the all the variables that can impact enzymatic reactions, including enzyme and ligand concentration, pH, ionic strength, and temperature. As a result, this technology has been used to characterize many types of enzymes. Todd and Gomez and Bianconi discuss the use of ITC to characterize almost every class of enzyme. 2,3 Other recent examples include, human salivary α-amylase, trypsin, Na+K+-ATPase, yeast hexokinase, cyclic nucleotide phosphodiestases, choline sulfatase, carbapenem-hydrolyzing class D β-lactamases, and Gingipain K (hydrolyzes IgG). 1,4 –10
ITC is also commonly used to study the kinetics of β-glucosidase and other cellulases and enzymes which have important roles in efficiently breaking down cellulose in biomass. 11 –14
The Practicalities of Performing Enzyme Kinetics Reactions with ITC
While ITC experiments are relatively straightforward, there are a few practicalities that require careful consideration. The first is buffer system choice. For ITC it is essential that reactants are made up in appropriate, well-defined buffer systems, taking into account any requirement to prepare substrate solutions at relatively high concentrations. Dialyzing the enzyme and, where practical, the substrate, in a particular buffer—as well as using the same buffer to make up the substrate solution—eliminates excessive heats of dilution. Checking the pH of all solutions and mixtures before and after titrations is good practice and avoids undetected pH drift, an issue that can impact data integrity.
Accurately determining the molar concentration of both the enzyme and substrate is a pre-requisite for ITC experiments, with spectroscopic methods often the most convenient approach. Determining the exact molar concentration of active enzyme in the solution makes it easier to calculate values for apparent molar enthalpy. Measurements of substrate concentration, on the other hand, in combination with an approximate value of KM, make it possible to generate a complete Michaelis-Menten curve with points above and below KM.
Performing the ITC assay itself involves two types of experiments. Total molar enthalpy is determined by titrating a relatively low concentration of substrate (in the syringe) against a relatively high concentration of enzyme in the cell, leaving a sufficient gap between each injection to ensure that all of the substrate is converted to product. Rate data is generated using a reverse set-up—high substrate concentration in the syringe and low enzyme concentration in the cell. Here, much shorter gaps are left between injections, with the aim of ensuring that steady-state conditions are maintained and no more than 5% of the substrate is depleted prior to the next injection. In combination, the data resulting from these two sets of experiments enable the derivation of KM, kcat, and Vmax, though it is also necessary to perform the usual dilution experiments associated with ITC, which involve injecting substrate solutions into the reaction buffer alone.
Typical enzyme and substrate concentrations for ITC enzyme assays are in the range of spectroscopic assays. Enzyme in the ITC cell is in the nanomolar to micromolar range (the higher the KM value, the higher the concentration needed). The required concentration is often less than that used for traditional ITC protein-ligand binding assays. Substrate in the syringe is in the micromolar to millimolar range, and is higher than the KM value.
Several studies provide details on performing ITC experiments for enzyme kinetics. 2,3,15,16
Case Study: Using ITC to Determine Xylanase Kinetics
This case study demonstrates the efficiency of ITC relative to chemical-reducing-end assays for determining kinetic data for xylanase.
Xylanase is used in industrial processes such as biobleaching and in the manufacture of biofuels to break down xylan, a class of hemicelluloses found in plants. The measurement of xylanase kinetics, therefore, has direct relevance for large-scale process optimization. In an experimental study, ITC was used to determine xylanase kinetics using two different, well-defined substrates, birch xylan and wheat arabinoxylan. The results were compared with data generated using chemical-reducing-end assays, a standard approach for this application. 17
Purified xylanase was produced from Aspergillus aculeatus (Aac). Following purification, the enzyme was analyzed and two different forms were found to be present: Aac-XynCD, a xylanase without a carbohydrate binding domain (CBM), and Aac-XynCBM, which incorporates a catalytic domain with CBM. Experiments were carried out with both forms of the enzyme.
Buffered birch xylan (X0502, Sigma-Aldrich, St. Louis, MO) and medium-viscosity wheat xylan (24 cStokes, Megazyme, Wicklow, Ireland) solutions of known concentration were made up using sodium acetate (pH 5.0) as a buffer. In preliminary experiments, the heat flow from the hydrolysis of xylan by xylanase was found to be below the limits of detection for accurate ITC, even at relatively high substrate concentrations. To address this issue, carbohydrate oxidase and catalase (Novozymes, Bagsvaerd, Denmark) were used as a signal amplification system. By oxidizing the mixed xylan oligosaccharides and/or xylose produced by the initial hydrolysis, these enzymes triggered a much larger heat flow signal that tests showed would enable successful ITC studies (Fig. 4).
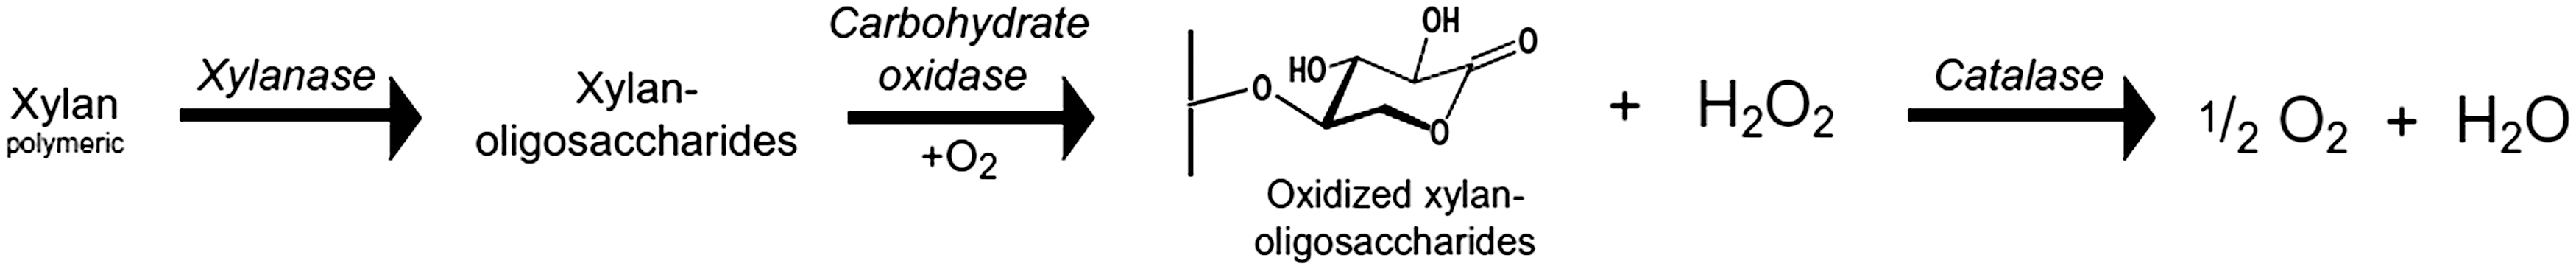
By oxidizing xylan oligosaccharides, carbohydrate oxidase in combination with catalase amplifies the heat generation signal produced by the xylanase-catalyzed hydrolysis of xylan. Image courtesy of Baumann M.
Once a suitable reaction assay had been established, a series of titrations were carried out using a MicroCal ITC 200 microcalorimeter (Malvern Instruments, Worcestershire, UK) equipped with a 200-μL sample cell and 40-μL injection pipette. All assays were run at 30°C using a xylan solution that had been pretreated to eliminate the effect of oxidizing reducing ends in both substrate sources. To measure molar enthalpies, pure xylan oligosaccharides generated from birch xylan were titrated to buffer and then separately titrated to the carbohydrate oxidase/catalase mixture.
In subsequent multiple injection enzyme kinetics experiments, xylanase, carbohydrate oxidase, and catalase in sodium acetate buffer were loaded into the cell while substrate was added from the pipette over the course of 30 injections. Experiments were carried out to determine a separation period—four minutes—for the injections to ensure a ‘pseudo’ steady state in which the heat flow after an injection was independent of the preceding injection. The pH of the assay solution was confirmed as unchanged by measuring pre- and post- assay.
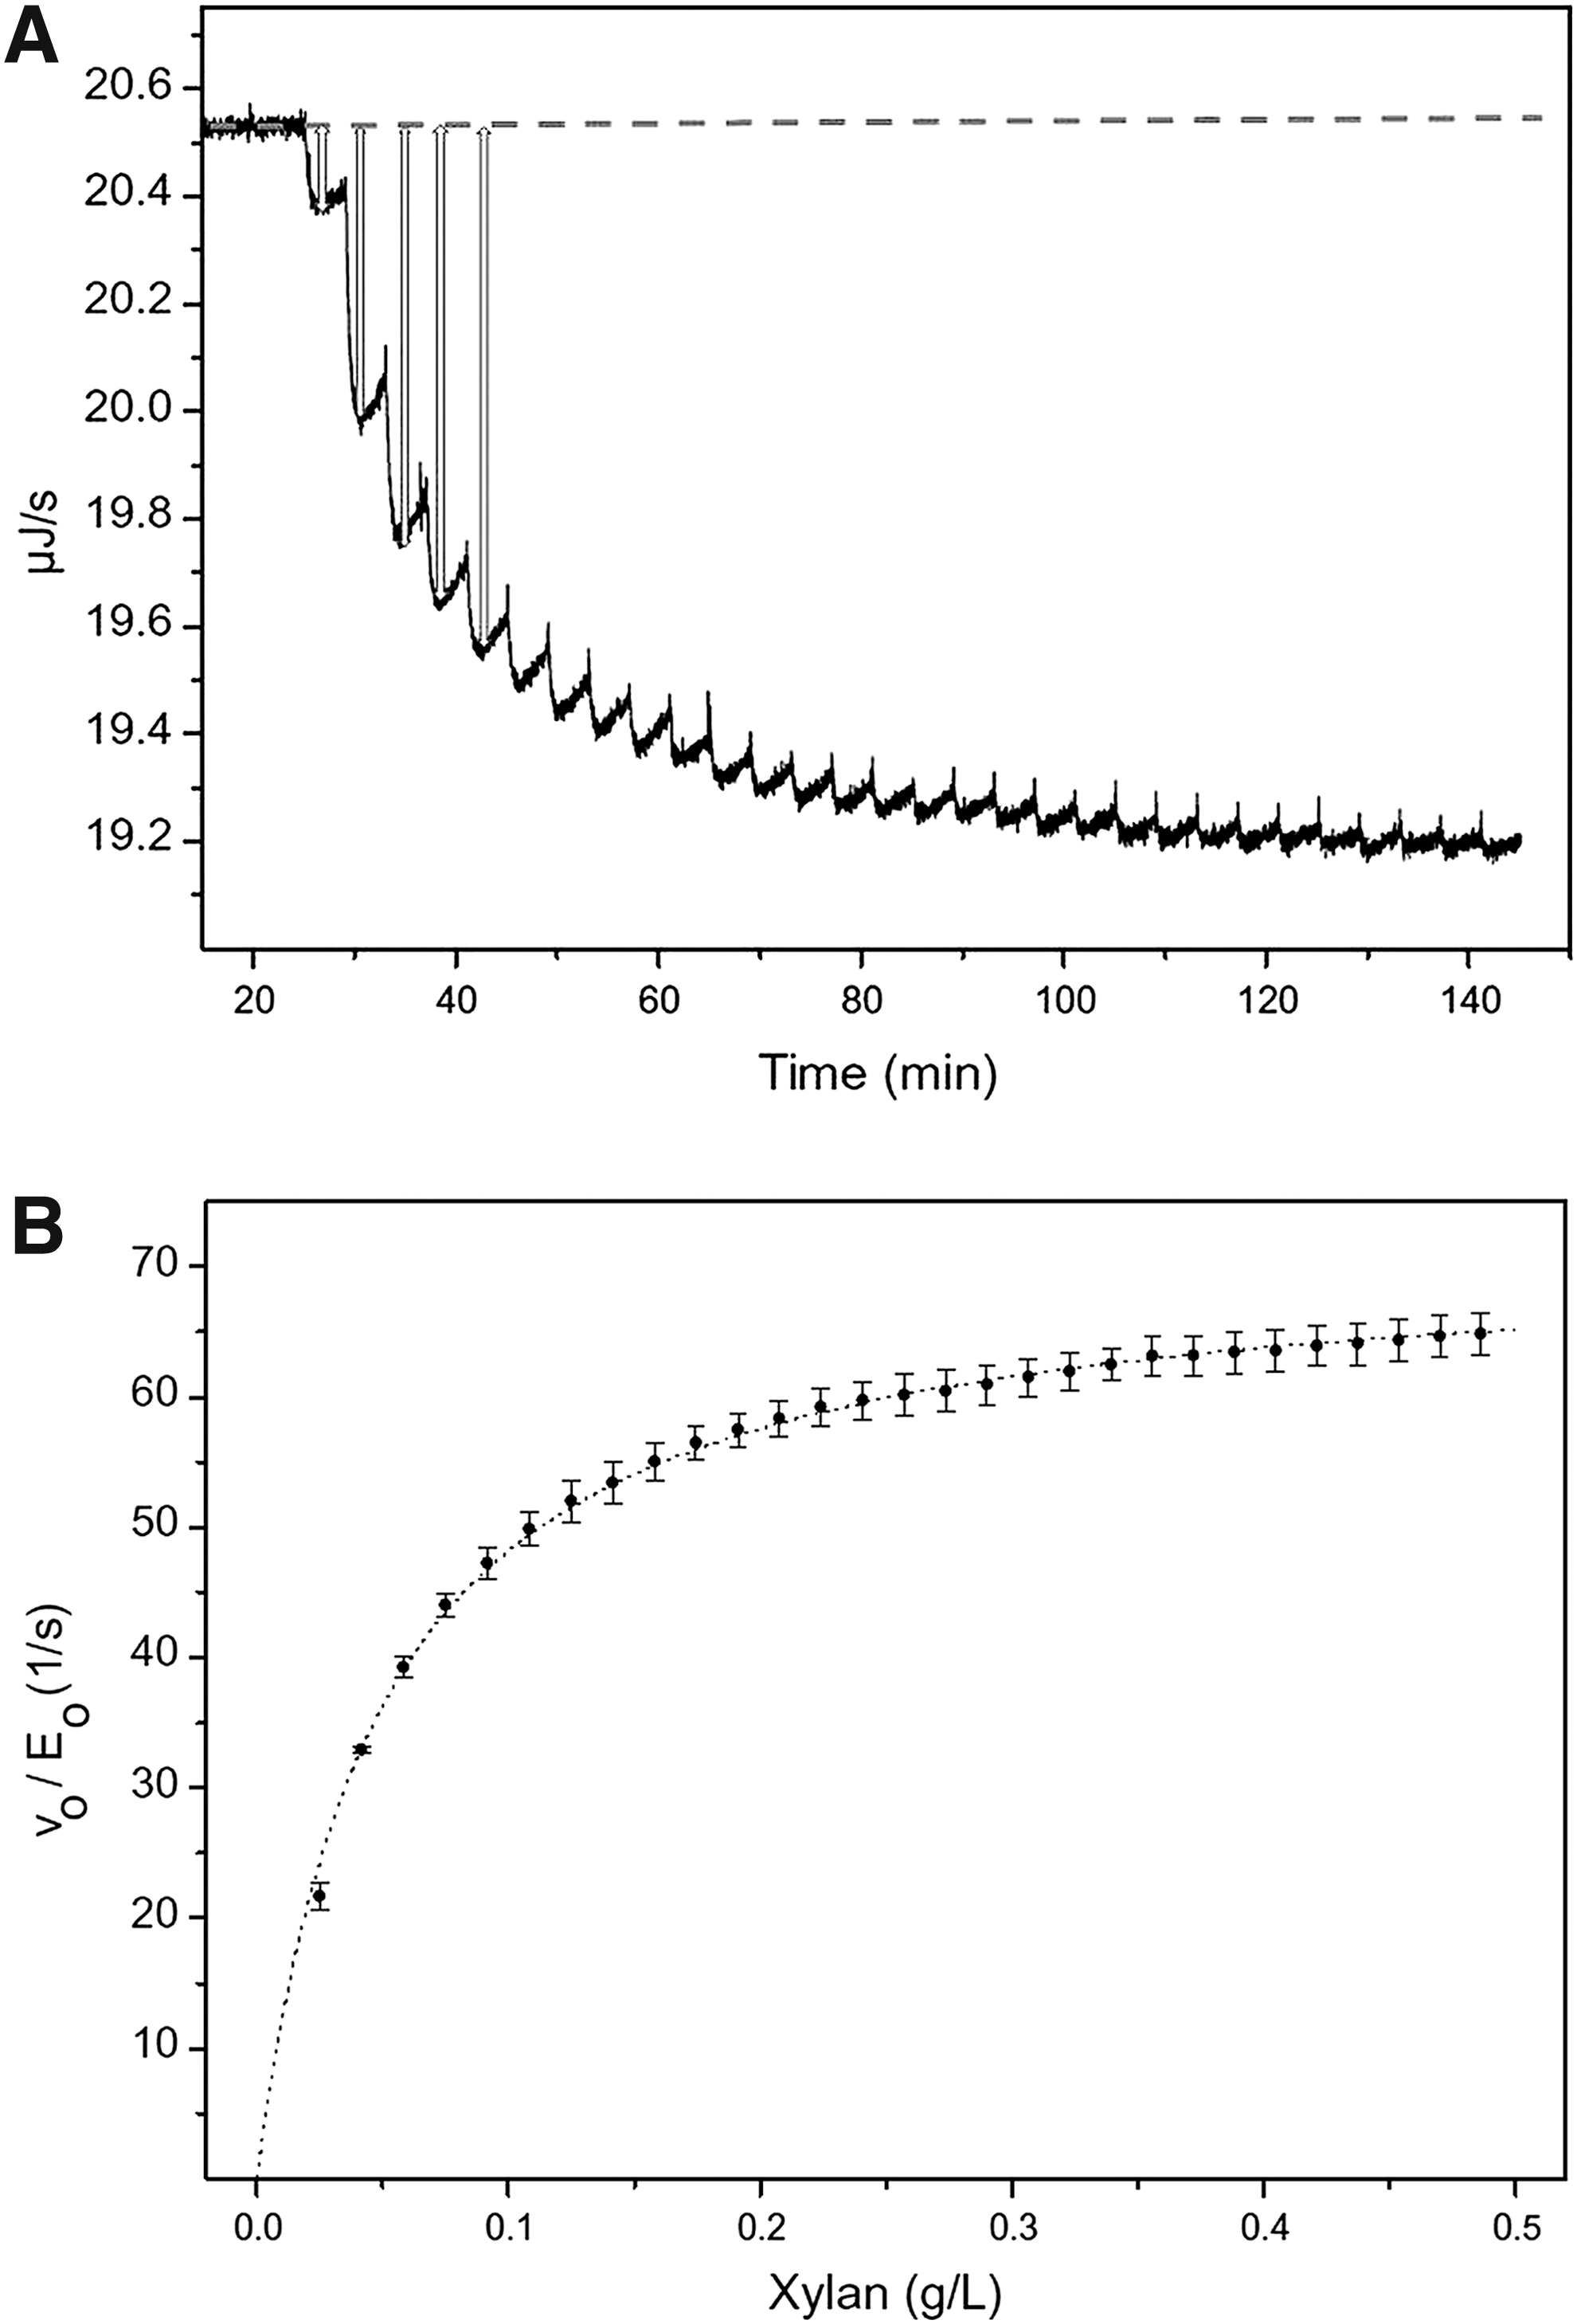
The raw data from a typical ITC experiment (Fig. 5) shows the heat flow pulse triggered by each injection, while the converted data shows enzyme activity fitted to a classic Michaelis-Menten equation (dotted line). These data quantify the activity of xylanase in the hydrolysis of birch xylan and enable the determination of a kcat value for the reaction. This was found to be in the region of 70 s−1, with somewhat lower values observed with wheat xylan. KM values are relatively similar across the two substrates, though slightly higher for the wheat xylan (Table 1). The values of kcat were found to be largely independent of the presence/absence of a CBM in the xylanase. In addition, KM values, which lie within the range 50–110 mg/L across all the experiments, are also relatively similar.
Kinetic Parameters for the Hydrolysis of Xylan Catalyzed by Xylanase (With and Without a CBM) Measured by ITC and by MBTH Assay
Data are calculated with the ΔH app values for the carbohydrate oxidation and hydrogen peroxide oxidation; bErrors are given from the curve-fitting algorithm based on ΔH of −64kJ/mol; cErrors are the standard deviations. Table reprinted with permission by Baumann M.
Chemical-reducing-end assays were carried out alongside the ITC experiments in order to compare and contrast ease of use and the data generated. Comparative data produced using a 3-methyl-2-benzothiazoline hydrozone (MBTH) assay is shown in Table 1. In general, the chemical-reducing-end assays were labor-intensive and prone to systematic errors. Sensitivity was also an issue and none of the available technologies were able to produce a full kinetic curve.
In contrast, the ITC method proved both fast and effective. Once the enzyme and substrate had been loaded into the calorimeter, the automated protocol could be used to produce an entire kinetic curve in less than 2 hours. In addition, the sensitivity of the ITC method was high; this resulted in low test volume requirements—about 15 ng of xylanase for the generation of a kinetic curve—and made it possible to carry out experiments using highly diluted systems to measure the low KM values observed with certain enzymes. Uncertainty over the value of ΔHapp was the primary limitation associated with ITC, but this would not be an issue for a substantial number of studies, including all those that are comparative.
Conclusion
The efficient and accurate measurement of enzyme kinetics is crucial to technical advancement and process optimization across a number of industries. ITC is a powerful and flexible technique for studying molecular interactions and can provide the information needed to generate a full Michaelis- Menten kinetic curve in less than 2 hours. High sensitivity means that sample requirements are low and allows experimentation with very dilute systems. The data presented here demonstrate the application of ITC to study the kinetics of xylanase-catalyzed hydrolysis, an important step in many applications, including, for example, the production of biofuels. Relative to traditional strategies based on chemical-reducing-end assays, ITC proved to be faster, less manually intensive and more informative.