
Abstract
The objective of this study was to evaluate the removal capacity of bacterial film formed by Pseudomonas sp., using commercial enzymes (pectinase, cellulase, and amylase) and the enzymatic extract obtained by solid-state cultivation (SSC) from Aspergillus niger ATCC 9642. The bacterial biofilm removal (Pseudomonas sp.) was evaluated using the commercial enzyme microplate technique and the crude enzyme extract (SSC). The effects of orange peel (9.28–22.72 g), corn steep liquor (0.32–3.68 g), and wheat bran (0–4 g) concentrations were evaluated on pectinase production in solid-state cultivation. The enzyme extract (SSC) satisfactorily removed 77 % of biofilm after 10 min contact, taking into account that there was no enzymatic extract purification treatment. The results indicated a promising and economically viable alternative to enzymatic removal of biofilms in the food industry.
Introduction
Biofilm formation is an endless cycle, in which bacteria-organized communities are encased in an extracellular polymeric substances (EPS) matrix that holds microbial cells to a surface. 1 Cells are surrounded by organic matter particles, characterized as an EPS matrix, which represents 85% of total biofilm. 2 EPS is composed mainly of biomolecules, exopolysaccharides, extracellular DNA (eDNA), and polypeptides that form a highly hydrated polar mixture contributing to the overall structural scaffold and the biofilm architecture. 3,4 Biofilms are usually formed by sanitation-stage negligence in hard-to-reach places, such as valves and pipe bends. The formation of biofilms is prevented by sanitation techniques for food and beverages processing lines surfaces, polished materials surfaces, embedded antimicrobial agents, quality control tools, and trained handlers. 4
As biofilms-surrounded bacteria are protected from environmental stresses, they tend to be more resistant to them, including antibiotics and disinfectants, than planktonic cells. 5,6 For this reason, biofilms are a frequent cross-contamination source in the food supply. For this reason, research to prevent adhesion and facilitate bacterial biofilms removal has been done in recent decades.7 Detergent enzyme-based bioproducts used in cleaning serve as a viable option for solving the biofilm problem in the food and beverages industry and their environmental impact.
Due to EPS heterogeneity and the enzyme action mode, a mix of enzymes (hydrolases and lyases) may be useful for biofilm degradation. Thus, formulations containing different enzymes appear to be essential to its control, 4,8 as prospective biocompounds could be produced and optimized in order to degrade biofilm matrix, contributing to cleaning-stage efficiency and for use in certain industrial circumstances. 1,2,9
This study aims to evaluate the removal capacity of bacterial biofilm formed by Pseudomonas sp. using commercial enzymes and enzymatic extract obtained by solid-state cultivation (SSC) with by-products.
Material and Methods
Commercial Enzymes
Pectinase (Rohapect® DA6L from Aspergillus niger, AB Enzyme, Darmstadt, Germany), cellulase (cellulase from Aspergillus niger, Sigma-Aldrich, São Paulo, Brazil), and amylase (α-amylase from Bacillus licheniformis, Sigma-Aldrich) were tested.
Pectinase Production
A. niger ATCC 9642 strain (FIOCRUZ, ATCC international distributor, Manguinhos, Rio de Janeiro, Brazil) was used. This culture was propagated on Potato Dextrose Agar (PDA) and incubated at 30°C until sporulation (1 week). Spores harvesting from the slants was done using 5 mL Tween 80-water (0.02 %).
Agro-industrial substrates used were corn steep liquor (CSL) donated by Corn Products (Mogi Guaçu, Brazil), orange peel, (juice production residue, 65% moisture content) acquired from a restaurant in Erechim, Brazil, and wheat bran (Olfar Ind. & Com. Óleos Vegetais Ltda., Erechim, Brazil). The agro-industrial waste remained frozen at −20°C until used.
The effects of the culture medium composition on the pectinase bioproduction were assessed by a 23 central composite rotatable design (CCRD; 17 assays with 3 central points), and the independent variables investigated were orange peel (9.28–22.72 g), corn steep liquor (0.32–3.68 g), and wheat bran (0–4 g). The substrate mixture was added to a polypropylene beaker (500 mL), sterilized in a vertical downward autoclave (Phoenix, AV7 model, São Paulo, Brazil) for 15 min at 1 atm. A 5 × 10⁶ spores/gwetmatter spores concentration has been inoculated on the mixture and incubated in a germination chamber (Tecnal, TE401 model, Ourinhos, Brazil), with 65 % moisture content, at 30°C for 96 h.
For the SSC-produced enzymes recovery process, 10 g fermented medium were diluted in 25 mL of 0.1 mol/L NaCl (1:2.5 ratio, w/v). The mixture was then homogenized and incubated for 30 min at 30°C, and agitated at 180 rpm in an orbital shaker. The enzymatic extract was separated from both the mycelium and the solid medium by filtration process, followed by centrifugation (MPW Med. Instruments, Model 351R, Warsaw, Poland) at 4,000 rpm, for 15 min at 4°C. 10
The dependent variable (response) was pectin lyase (PL) activity. Exo-polygalacturonase (exo-PG) and pectin methyl esterase (PME) enzymatic activities were also evaluated on the crude PL enzyme extract. The pectinase activity was expressed in units (U) per gram (g) of the substrate (wet matter, wm; dry matter, dm).
After the production optimization step, substrate consumption kinetics (total reducing sugar, TRS), biomass, pH evolution, and PL, exo-PG, and PME activities were examined by periodic sampling.
In order to determine the optimum temperature and pH values in terms of enzyme activity (PL), a 22 CCRD was carried out using the enzymatic extract from A. niger ATCC 9642. The evaluated pH and temperature ranges were 3.09–5.91 and 30–80°C, respectively.
Biofilm Formation and Removal
For cell activation, the Pseudomonas sp. strain was inoculated in Luria-Bertani Agar (LBA) at 30°C for 24 h. The cells were diluted in a saline solution (0.9 % NaCl) and the turbidity was compared to a 0.5 McFarland scale (equivalent to 1.5 × 10⁸ UFC/mL). The cell suspension was diluted in LB broth to obtain 5 × 10⁶ UFC/mL (biofilm) initial inoculum. A 150 μL aliquot of the initial inoculum was added to each cavity of a 96-well polystyrene microplate (Olen, K30-5096P model), incubated at 30°C for 24 h. 11
In order to evaluate the removal of biofilms formed by Pseudomonas sp. the commercial enzymes; Pectinolytic complex (Rohapect® DA6L of A. niger, AB Enzyme), cellulolytic complex (Cellulase from A. niger, Sigma-Aldrich), amylolytic complex (α-amylase from Bacillus licheniformis, Sigma-Aldrich), and crude enzyme extract (condition maximized of PL) were tested.
For planktonic cells removal from microplates cavities, the culture medium was removed and microplates were washed twice with 200 μL saline solution (0.9 N NaCl). Afterwards, a 200 μL aliquot of commercial enzyme complexes (pectinolytic, cellulolytic, and amylolytic complexes) and crude enzymatic extract (SSC) were applied to the biofilm, previously formed in the microplates and incubated for 1 h at 30°C.
In addition, a 200 μL aliquot of enzymatic extract (SSC) and its dilutions (2 and 3 times) were applied to the biofilm and incubated at 30°C for different periods (10, 15, 20, 30, 60, 120, and 360 min).
The microplates' cavities were washed with saline solution for enzyme removal. Then, the cells were fixed with methanol (99%), stained with 100 mL crystal violet solution (4 g/L in 20% methanol), incubated for 5 min, and resuspended with glacial acetic acid (33 %). 12 The reading was performed in a spectrophotometer (EL 900 Bio Tek Instruments, Winooski, VT) at 490 nm (λ490). All assays were performed with growth control and sterility. The results were expressed as biofilm removal percentage.
Analytical Methodology
Exo-PG activity
The exo-PG activity was determined using the methodology reported by Miller. 13 One exo-PG activity unit was defined as the amount of enzymes that releases 1 mmol D-galacturonic acid per minute of reaction (U = μmol/min) from citrus pectin under test conditions, according to a standard curve (0.1–10 mg/mL) established with α-D-galacturonic acid (Sigma-Aldrich) as the reducing sugar. The exo-PG activity was expressed in activity units per milliliter (U/mL). The pH values were determined using a pH meter (DMPH-2, Digimed, São Paulo, Brazil).
PME Activity
PME activity was determined following methodology described by Hultin et al., 14 with some modifications. One PME unit was defined as the amount of enzyme capable to catalyze the pectin demethylation corresponding to 1 μmol of NaOH/min/mL consumption, under the assay conditions.
PL activity
PL activity was determined using the methodology described by Pitt. 15 One enzyme activity unit was defined as the amount of enzyme causing a 0.01 absorbance change at 550 nm, under the assay conditions.
Total cellulase activity
Total cellulose (FPase) activity was measured according to Ghose. 16 The mixtures optical density was recorded at 540 nm and compared with a standard glucose curve to determine the amount of reducing sugar (mg/mL) produced during cellulose hydrolysis.
Xylanase activity
Xylanase activity was measured according to Bailey et al. 17 . One xylanase activity unit was defined as the amount of enzyme that releases 1 μmol reducing sugars as xylose per minute, under the described assay conditions.
Carboxymethylcellulase activity
Carboxymethylcellulose (CMCase) activity was measured according to Ghose. 16 One CMCase activity unit was defined as the amount of enzyme that releases 1 μmol reducing sugars as glucose per minute, under the described assay conditions.
Total Reducing sugars
The amount of total reducing sugars was estimated using 3,5 dinitrosalicylic acid method with glucose as standard. 13
pH
The pH was monitored using a potentiometer (Digimed, DMPH-2), after calibration with pH 4.0 and 7.0 standard solutions.
Cell concentration
For cell concentration determination the indirect method described by Scotti et al. 18 was used, measuring the amount of glucosamine.
Statistical Analysis
The other results were treated by analysis of variance (ANOVA), followed by Tukey test. All analyses were performed using Statistica software 5.0 version (Statsoft Inc, Tulsa, OK).
Results and Discussion
Pectinase Production
Table 1 presents the complete 23 factorial design coded and real values and the responses in terms of PL activity. The maximum PL production was 78.50 U/gwm (224.3 U/gdm) in the medium composed of 88.9% orange peel and 11.1% corn steep liquor (run 11), 65% moisture content, 5 × 10⁶ spores/gwm, pHinitial of 4.3, at 30°C for 96 h.
Matrix of 23 CCRD (Real and Coded Values) with the Responses of PL
X1 = Orange peel (g), X2 = Wheat bran (g), X3 = Corn steep liquor (g). Independent variables fixed: 5x10⁶ spores/gwm , moisture content of 65%, at 30°C for 96 h.
The statistical analysis enabled the development of a second-order coded model Equation 1 (Table S1, Supplementary Data are available online at
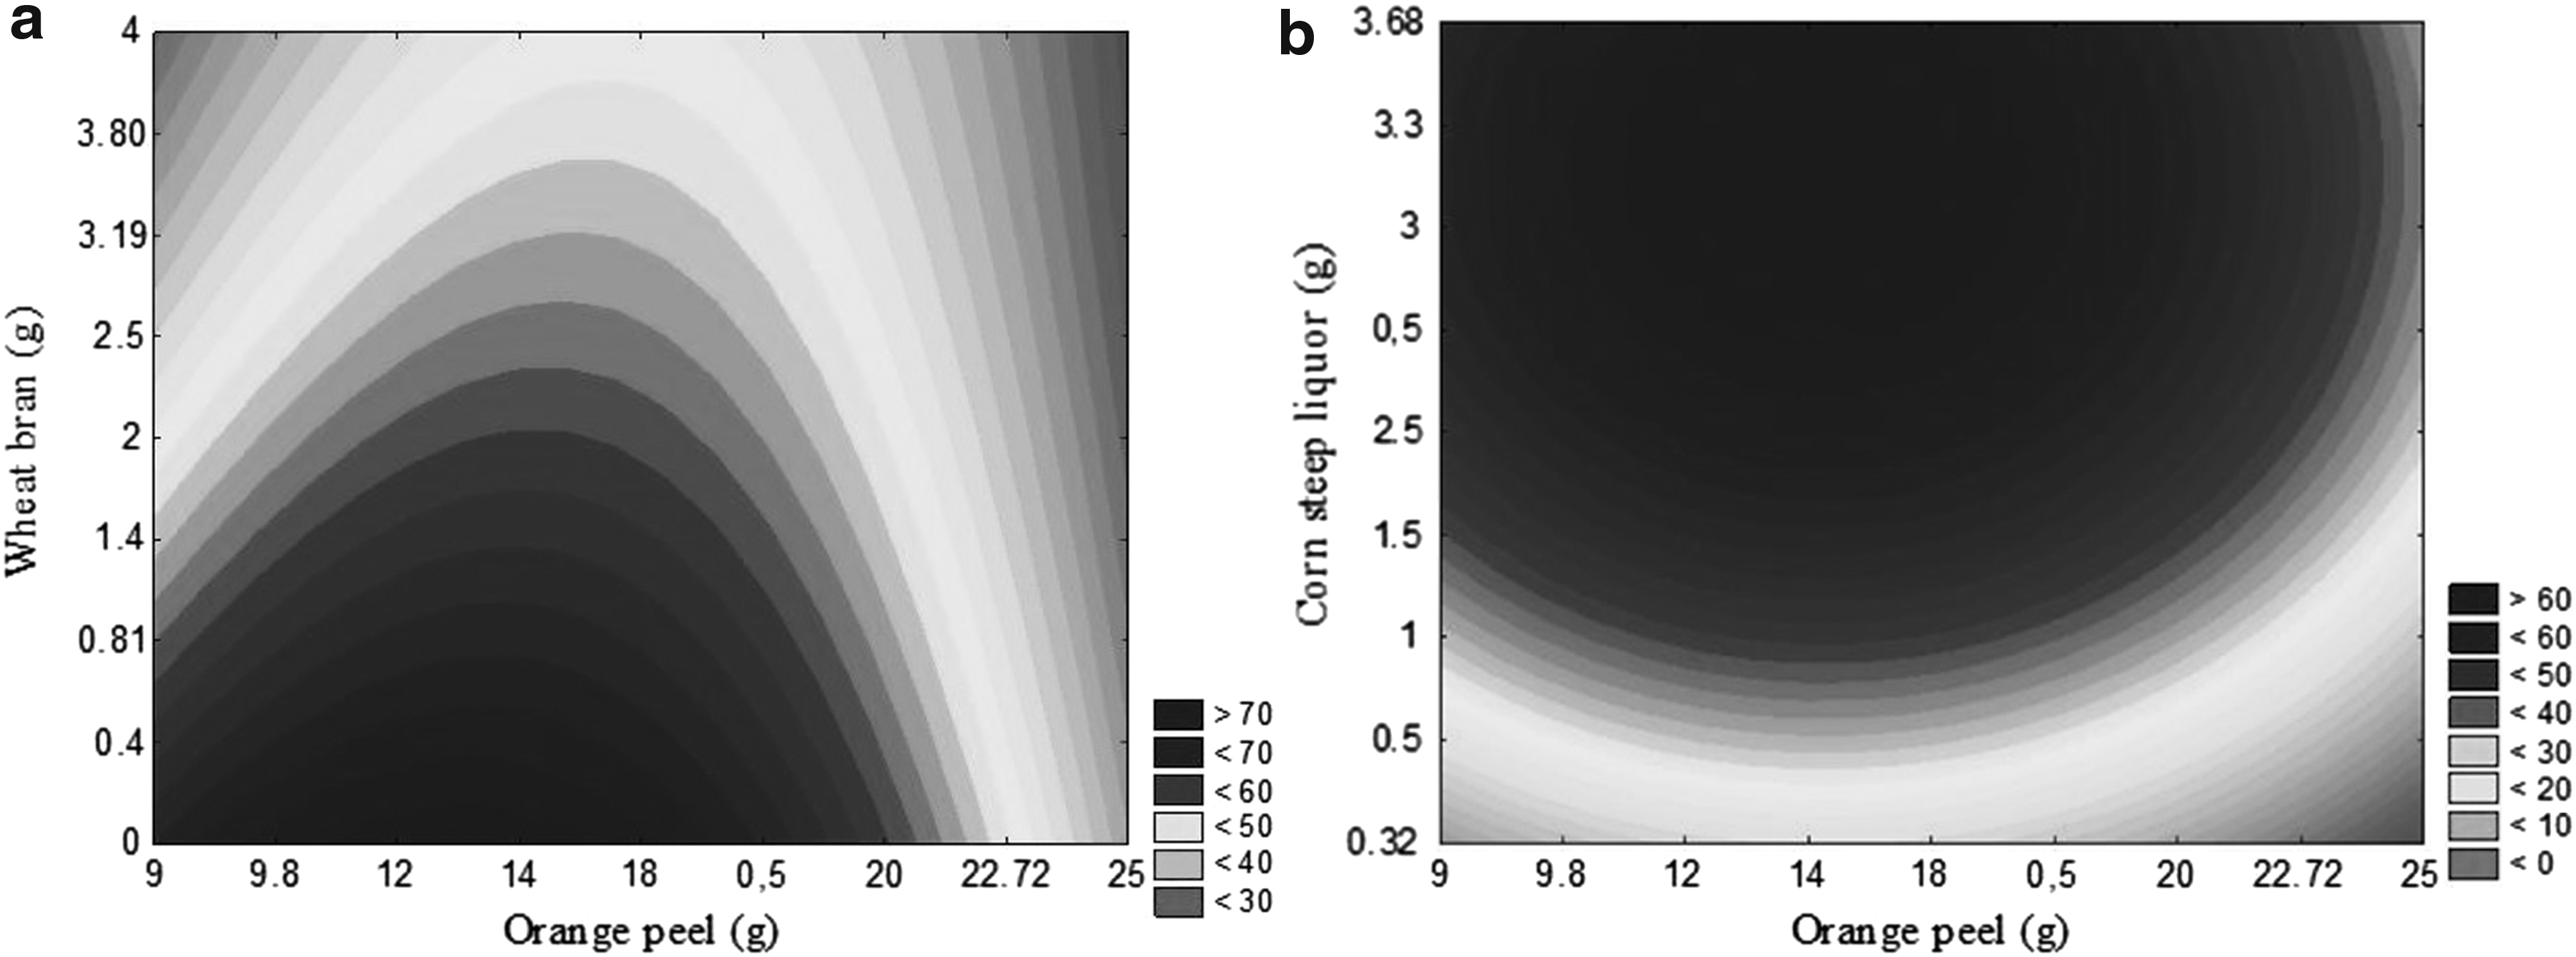
Contour curve for pectin lyase as a function of concentrations of
Results show that by decreasing wheat bran concentration (<0.81 g) and using orange peel in the 12–16 g range (Fig. 1a), there was a tendency to maximize PL production. Fig. 1b shows production area optimization in the 12–16 g and 2.5–3.5 g ranges, for orange peel and corn steep liquor, respectively. The carbon sources, the presence of inducers (pectin), and minerals composition (N2, k, Mg, Mn, Fe, and others) of agro-industrial substrates (orange peel, corn steep liquor, and wheat bran), as well as the adequate operational conditions, potentiated and regulated the pectinase synthesis from A. niger by SSC. In addition, orange peel contains large amounts of soluble carbohydrates, such as fructose, glucose, sucrose, and pectin, which are used in biocomposites production, including enzymes.
where PL is pectinase lyase activity (U/g wm ), X1 is orange peel, X2 is wheat bran, and X3 is corn steep liquor.
Figure 2 presents PL activity kinetic evaluation, biomass production, substrate consumption (reducing sugar), and optimized conditions pH. The maximum PL activity (Fig. 2a) was 126 U/gwm (359 U/gdm), obtained after 132 h bioproduction. The biomass (Fig. 2c) is associated with PL production; the maximum value was obtained at 120 h. The maximum exo-PG and PME activities (Fig. 2b) were 17 U/gwm (49 U/gdm) at 144 h and 24 U/gwm (70 U/gdm) at 48 h, respectively.

Kinetic curves for bioproduction of the optimized conditions:
The total reducing sugars (Fig. 2c) were consumed in 24 h, and the maximum power consumption (∼67 %) was observed at 24–60 h intervals, and there was a consumption of approximately 16% in the 60–132 h range.
The fermentation medium pH (Fig. 2a) showed a slight decline in the first 36 h (from 4.5 to 3.5), and after 48 h there was a progressive increase (5.0) to up to 96 h, which remained constant in the 96–156 h range, with a slight increase (5.5) until the end of the formulation.
Such behavior was also reported by Camargo et al. 19 using Aspergillus medium comprised of orange pulp as a carbon source, wherein the maximum pectin lyase production was obtained at 168 h and biomass accumulation was proportional to the increase in enzyme synthesis. Mata-Gómez et al. 20 evaluated the pectinase activity by Aspergillus sojae ATCC 20235 in a medium containing beet sugar as a carbon source obtaining the (123 U/g) maximum production at day eight. Silva et al. 21 obtained the maximum PL activity (∼3,540 U/gdm) by Penicillium viridicatum with SSC in a 10-day cultivation period using orange peel residue and wheat bran (1:1 ratio, w:w).
The evaluation of optimum pH and temperature was carried out using a 22 CCRD. Table 2 presented the experimental design matrix with the studied ranges of the variables and responses in terms of PL activity. The highest activity was 107 U/gwm (307 U/gdm) (run 8), at 55°C and pH 5.91.
Matrix of 22 CCRD (Real and Coded Values) with the Responses of PL (U/g wm )
X1 = pH, X2 = temperature (°C).
The results were statistically treated and the empirical models were obtained (Equation 2). These models represented the PL activity behavior in terms of temperature and pH over the studied range, validated using analysis of variance (ANOVA), which showed a 0.88 correlation coefficient and F values 1.2 greater than the tabulated ones. This yielded the contour curve plotting shown in Fig. 3, demonstrating that maximum PL production occurs at around pH 5.5 and 55°C. Similar optimal pH and temperature results for the SSC pectinase enzyme were reported by Dinu et al.
22
Contour curve for PL as a function of temperature (°C) and pH.
where PL is pectin lyase activity (U/gwm), X1 is pH and X2 is temperature (°C).
Biofilm Formation and Removal
Figure 4 shows the Pseudomonas sp. biofilms removal results after commercial enzyme application and enzymatic crude extracts (SSC). The commercial cellulolytic complex removed 68% of the biofilm, followed by SSC (58%), commercial amylolytic complex (15%), and commercial pectinolytic complex (15 %).

Biofilm bacterial removal (Pseudomonas sp.):
The enzymatic extract (SSC) was efficient in the biofilm removal when compared to the commercial enzyme complex (Fig. 4a). Based on the results, new tests were conducted by varying the enzyme extract concentration and incubation time at 30°C (results are shown in Fig. 4b). There was not a significant difference (p > 0.05) in biofilm removal using the SSC enzyme extract incubated for 30, 60, and 360 min at 30°C, in which about 70% biofilms formed by Pseudomonas sp were removed. However, when performing dilution (three times) in the enzyme extract incubated at 30°C for 30 min, a low biofilm removal efficiency (20%) was found. However, a removal rate increase (p < 0.05) was noted when increasing contact time for the same concentration.
Based on these results, new tests were conducted varying incubation time (Fig. 4c) to maximize SSC biofilm removal. It was observed that a 10-min incubation time was sufficient to remove 77% of bacterial biofilm when using crude SSC enzymatic extract—a satisfactory value, considering that the enzyme extract did not have any purification treatment.
In vitro microbial biofilm removal reports using enzymes were found in the literature. Orgaz et al. 9 evaluated the removal capacity of biofilm formed by Pseudomonas fluorescens, using the supernatant produced by submerged fermentation of three fungal strains (A. niger, Trichoderma viride and Penicillium spp) and obtained 84% and 60% removal values when employing biological extracts from T. viride and A. niger, respectively. By applying the A. niger fermentation-produced supernatant, 60% biofilm removal was achieved after 1 h contact. A report cited by the authors stated that biofilm removal is caused not only by the tested enzymes action (pectin esterase, polygalacturonase, pectin lyase, cellulase, alginate lyase, and arabinase) as it might also be influenced by other metabolites formed during bioproduction.
Possibly, biofilm removal is associated with synergy among the enzymatic complex enzymes. Therefore, exo-PG, PME, PL, FPase, and CMCase enzymatic activities, as well as SSC xylanase enzyme extract and commercial enzyme complexes (Table 3) were evaluated. The PL and xylanase enzymes had the highest hydrolytic activity, proving synergy among different SSC enzymes in biofilms removal formed by Pseudomonas sp. Similar results were also obtained by Torres et al., 23 who evaluated 17 commercial enzymes in biofilms removal using bioreactors in a continuous system. They noticed that the enzyme pectin methylesterase was capable of reducing biofilm formation by 71%. This result was similar to the one reported by Zanaroli et al. 8 , who analyzed commercial hydrolytic enzymes acting (α-chymotrypsin, ficin, α-amylase, cellulase, and lipase) on removing bacterial biofilms (Pseudoalteromonas and Rhodobacter) and found greater removal efficiency (90%) when enzymes were mixed.
Enzymatic Activity (U/mL) of Commercial Enzymes (Pectinolytic, Cellulolytic and Amylolytic Complex) and the Crude Enzyme Extract (U/g wm ) Obtained from SSC
The same letters/column indicate no significant difference at 5% (Tukey test).
There are studies in the literature regarding the application of commercial enzymes in the biofilm removal and formation prevention on equipment in the food, paper, pulp, and dental plates industries. 23 –25 Lequette et al. 25 suggested an enzyme combination, surfactant components, and dispersing and chelating agents as an effective alternative for equipment surfaces cleaning. Johansen et al. 26 evaluated Pectinex Ultra SP (protease, pectinase, arabinase, cellulase, hemicellulase, β-glucanase, and xylanase) commercial enzyme action on biofilms formed by Staphylococcus aureus, Staphylococcus epidermidis, Pseudomonas aeruginosa, and P. fluorescens, and obtained a significant reduction in bacterial cell numbers, indicating that enzyme activity occurs primarily due to extracellular polysaccharides degradation. Araújo et al. 27 evaluated the combination of selected enzymes (β-glucanase, α-amylase, lipase, and protease) with cetyltrimethylammonium bromide (CTAB) in biofilm inactivation, and P. fluorescens removal and regrowth. The effects of combining enzymes with CTAB significantly reduced the number of bacterial cells, particularly for β-glucanase and protease (2.07 and 1.93 Log CFU/cm2), respectively.
Conclusion
Maximum PL activity (88.9% orange peel and 11.1% corn steep liquor) was 126 U/gwm, obtained after 96 h (65% moisture content, 5 × 10⁶ spores/gwm, pHinitial of 4.3, 30°C). The enzyme extract (SSC) also presented exo-polygalacturonase (17 U/gwm), pectin methyl esterase (24 U/gwm), total cellulose (1.75 U/gwm), carboxymethylcellulase (2.75 U/gwm), and xylanase (154 U/gwm) activities, respectively. Partial crude PL enzyme extract characterization showed an optimum 5.5 pH and 55°C.
The enzyme extract (SSC) satisfactorily removed 77% of biofilm (Pseudomonas sp.) after 10 min contact, taking into account that there was no enzymatic extract purification treatment. The results indicated a promising and economically viable alternative forenzymatic removal of biofilms in the food industry.
Footnotes
Acknowledgments
The authors would like to thank the National Council for Scientific and Technological Development (CNPq), the Coordination for the Improvement of Higher Education Personnel (CAPES), and the Research Support Foundation of Rio Grande do Sul State (FAPERGS).
Author Disclosure Statement
No competing financial interests exist.
References
Supplementary Material
Please find the following supplemental material available below.
For Open Access articles published under a Creative Commons License, all supplemental material carries the same license as the article it is associated with.
For non-Open Access articles published, all supplemental material carries a non-exclusive license, and permission requests for re-use of supplemental material or any part of supplemental material shall be sent directly to the copyright owner as specified in the copyright notice associated with the article.