
Abstract
The Bioeconomy Strategy of the European Commission, launched in 2012, aims to develop the production and use of biomass within the European Union as a strategy to limit the consumption of fossil carbon while fostering jobs and growth. The quantification and timely reporting of biomass flows are crucial for the monitoring of such a strategy. Within this framework, the present work focuses on the quantification of primary agricultural residues in the European Union, which could be a potential feedstock for the biobased material and bioenergy sectors. Harvest indices, or residue-to-product ratios (RPRs), determined at crop level, are used in the calculation of primary agricultural residues. Building on RPR functions of yield, we acknowledge a relationship between primary crop residue quantity and crop yield. Finally, we estimate that 395 million tonnes of dry matter (Tdm) of primary agricultural residues was produced in Europe in 2013 from more than 130 crop commodities, of which 297 million Tdm should be left in the fields for the maintenance of ecosystem services (using conservative assumptions) and 29 million Tdm is collected for agricultural use. Consequently, 69 million Tdm is collectable as feedstock for the biobased material and bioenergy sectors. Collectible residues are mainly composed of cellulose (42%) and sugar and starch (10%). The production of primary agricultural residues is concentrated in the major cereal-producing countries and is stable over time. Nevertheless, a wider adoption of ad hoc harvesting machinery, the optimization of logistic processes, and the maturation of the new biobased value chains could help to take advantage of the current production of agricultural residues.
Introduction
Although animal feed and food are by far the major outlets for agricultural biomass, it also serves a wide range of non-food uses. Based on expert opinion, the nova-Institute (Huerth, Germany) has estimated that 42% of the feedstock used by the European textile sector comes from agricultural biomass. 1 This is also the case for 9% of the feedstock used by the chemical sector, 17% of the feedstock used by the pharmaceutical sector, and 6.3% of the feedstock used for the manufacture of plastics and rubber. 2 In addition, biomass accounts for approximately 8.5% of the total final energy consumption in Europe. 3,4 Obviously, there is still potential for development.
Resource efficiency in general, and the development of non-food uses of biomass in particular, has consistently been high on the European Union agenda. Strong institutional signals have arisen from the 2020 European climate-related targets set in 2008, as set out in the Roadmap to a Resource Efficient Europe published in 2011, and from the launch of the European Bioeconomy strategy in 2012 (European Commission, 2008, 2011, 2012). 5,6 The Bioeconomy strategy, named Innovating for Sustainable Growth: a Bioeconomy for Europe, reaffirms the importance of improving resource efficiency to meet the next set of European societal challenges (i.e., food security, environment, energy, climate, and job- and growth-related challenges). 6 The wider use of biomass in non-food sectors (i.e., the biobased material and bioenergy sectors) is a cornerstone of this strategy.
Primary agricultural residues, defined as crop residues remaining in fields after harvest, are seen as promising feedstock for the European bioeconomy. Often considered as under-utilized and thus relatively inexpensive, they are also, interestingly, not yet affected by the food versus fuel 7,8 and land-use change and indirect land use change (LUC–ILUC) 9 –11 debates (in contrast to energy-dedicated crops). 12 –15 In addition, they are a possible new source of income for farmers and could potentially contribute to climate change mitigation strategies. 15
Within the framework of the European Bioeconomy Observatory, the present work seeks to provide a methodology for the quantification of primary agricultural residues and their potential industrial use that can be replicated in each of the EU Member States and for several years to come. Among the five methodological approaches classified by Vis and van den Berg in their Best Practices and Methods Handbook for biomass resource assessments, we oriented our methodological choices towards a resource-focused basic statistical method. 16 This approach relies on the use of official statistics as a basis for calculation, which has the dual advantage of providing data that are both harmonized across countries and are updated annually. Therefore, it fulfils the requirement for timely reporting to the European Bioeconomy Observatory with quickly updatable and harmonized data at the Member State level. This method is described later.
The results presented and discussed are to be seen as partial inputs for the quantification of the overall biomass produced in the EU and Member States. A more refined methodology combining a statistics-based and a remote sensing-based approaches is under development in the European Commission's Joint Research Center, in the framework of the Biomass Assessment project. It will complement the present work as soon as results are available.
Methods
A two-step approach is followed. First, the total production of primary agricultural residues is derived from UN Food and Agriculture Organization (FAO) statistics on agricultural production by applying ad hoc residue-to-product ratio (RPR) functions of crop yield. Second, the amounts of biomass serving environmental purposes and agricultural uses are subtracted from the primary agricultural residues total, giving the amount of residues that are collectable for the biobased material and bioenergy sectors. The residue biomass are then decomposed into their main components.
Total Production of Primary Agricultural Residues
Primary agricultural residue production (PARP) in 1,000 tonnes dry matter for crop j in country i is given by the equation:
where
RPRs Utilized in the Present Work
Esteban et al. 2010 report a variation in the RPR for vineyards between 0.20 (Spain) and 0.40 (France).
Note that various ways of calculating RPRs are reported in the scientific literature: • Constant RPRs are derived from the harvest indices
1
(HI)—the ratio of harvested crop to total crop—as follows for crop j:
Assuming that crop residue production is proportional to crop production, 23 –27 constant RPRs are often situation specific (i.e., specific to a given cultivar produced under specific soil and climatic conditions and specific crop management practices). Region-specific 21 or even country-specific RPRs 23 integrate more variability and are best suited for estimations at a more aggregated level.
In the present study, we make use of constant RPRs for crops in which the harvested part and the supporting tissue are inseparable (such as tobacco, hemp, and flax), and for permanent crops (olive trees, tree nuts, and fruit trees) as recommended in the literature. 24
• Functional RPRs link the RPR to the crop yield in the case of annual crops, the level of yield capturing the variability of crop production across space and time. Functions reported are either linear, 24,28 logarithmic (Scarlat, et al, further used in Monforti, et al. and in Daioglou, et al.), 13,29,30 hyperbolic, 31 or exponential. 22 Table 2 compiles examples of those different functional forms for estimating RPRs, for similar crops. 22,24,29,31 Using the same sources as in Table 3, Fig. 1 illustrates the variation of RPRs for a range of crop yields in the EU (left), plotted against the primary crop residue yield (right). 22 –24,27,28,29,31 –33
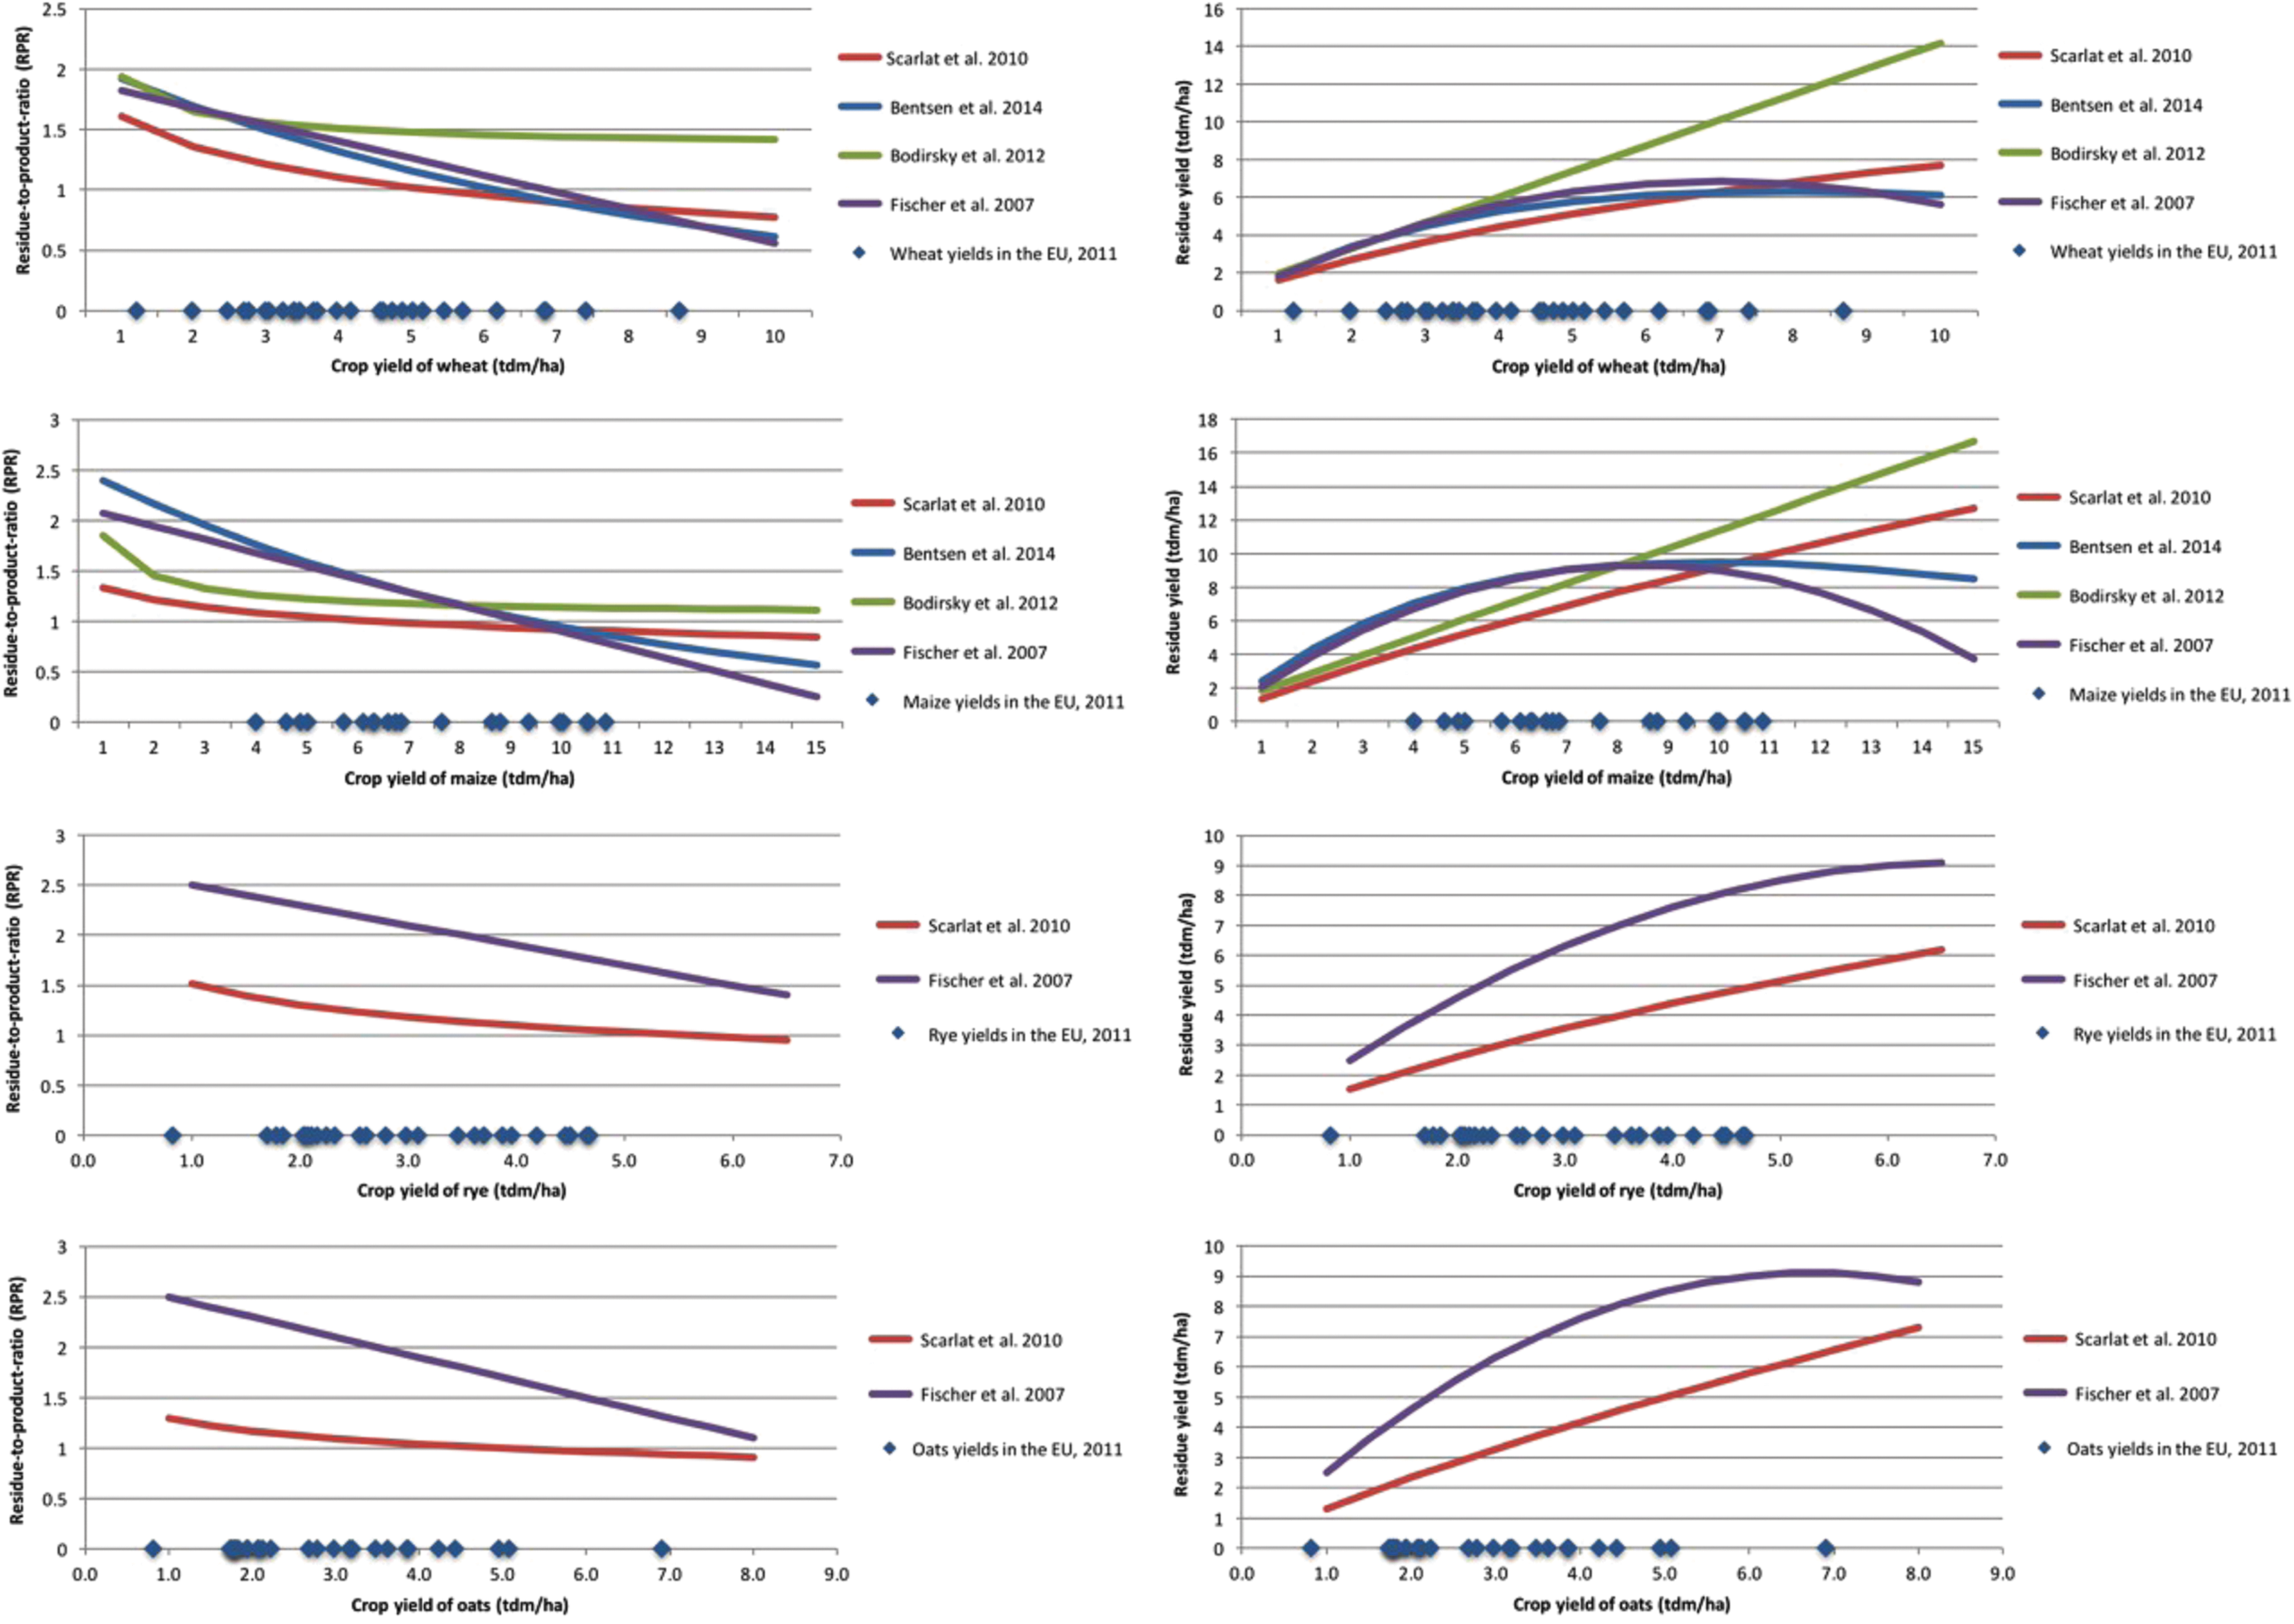
Graphical cross-comparison of four functional forms for the estimation of RPRs for selected crops.
Examples of the Four Different Functional Forms for Estimating RPRs Reported in the Scientific Literature
Most Recent Estimation of Crop Residue Production Within Europe and Comparison With Own Estimation for the Same Data Concept a
i.e., following the same definition as in the original source in terms of geographical scope, year of reference and commodities covered; bResidues remaining in the field are not accounted in those estimations; fm stands for fresh matter and dm for dry matter.
In Fig. 1, functions mainly differ for high level of crop yields where only linear and exponential RPR functions show a negative relationship between RPR and crop yield. This negative relationship was expected considering that high crop yields result from plant breeding efforts oriented at increasing the production of grains relative to the production of residues, i.e., the production of primary crop residues does not increase as quickly as the harvested production above a certain threshold. But linear RPR functions imply that primary crop residue yield could even decrease at very high levels of crop yields, in contrast to the predicted outcome.
Therefore, in line with the last publication of Bentsen et al., we opted for the use of RPR exponential functions for annual crops. 22 Wheat, maize, barley, rice, and soybean functions are from Bentsen et al. and complemented with authors' estimated functions for missing crops. 22 Authors' functions satisfy two mandatory conditions. First, at average crop yield levels, these functions should predict RPRs similar to those found in the literature. Second, they should not predict decreasing residues, even at very high yields.
In summary, our estimation of the European production of primary agricultural residues builds on the determination of RPRs for 37 commodities or commodity groups. Of these 37 RPRs, nine are from the scientific literature and 28 have been determined for the purposes of this study as an exponential or constant functions of crop yield (Table 1).
Multiple Uses of Primary Agricultural Residues
To evaluate how much of the total production of primary agricultural residues available for bioindustrial uses once traditional uses have been fulfilled (i.e., environmental and agricultural uses), we assume that a proportion must remain in the field for environmental purposes and a further proportion is used in agriculture. The remaining biomass is then considered as potential feedstock for the biobased industry, including biobased material and bioenergy production.
Environmental uses
It is both unavoidable and desirable that a proportion of the residues produced remains in the field to meet environmental requirements, for example the maintenance of soil fertility, water retention, the mitigation of erosion, etc. 24 In particular, the conditions for the maintenance of soil organic carbon (SOC) have recently been much investigated and debated as a key factor for soil conservation and climate mitigation strategies. 34 Environmental requirements are calculated in the literature using sustainable removal rates of primary agricultural residues (i.e., the maximum proportion of crop residues that can be removed from the field without reducing soil fertility and other environmental services). Highly variable removal rates have been reported since miscellaneous factors enter into play (including in-site factors). 35,36 Although removal rates tend to correlate positively with SOC content and negatively with temperature, other factors weaken these relations, such as management practices (in particular, (no)tillage practices and straw/stover cutting height). Analyzing the extensive literature, Bentsen et al. 22 report a “trend towards recovery rates of general validity between 25% and 60%,” while Blanco-Canqui 37 reports this range as 25–50% and Scarlat et al. 29 suggest 30–60%.
We conservatively assume that, regardless of the type of crop, only 25% of all agricultural residues can be sustainably extracted in the form of “removable” residues.
Agricultural uses, biobased material production, and bioenergy
This study assumes that the removable part of primary agricultural residues can be used within the agricultural sector or in the biobased industry. Classical uses of primary agricultural residues are mainly the use of cereal residues for livestock feed and bedding, and for mulching in horticulture and mushroom cultivation. Their estimation is consistent across sources. Based on national livestock inventories, and assuming constant-level horticultural use in Member States, Scarlat et al. 29 estimate that, on average in the EU, around 25% of removable residues are used for animal feed and bedding and mushroom cultivation. These residues consist of cereal straw and stalks from rapeseed and sunflower. This estimate, corresponding to 28 million tonnes of dry matter (Tdm), is in the same range as the demand for 31 million Tdm for straw used in animal feed and bedding, as estimated by Piotrowski et al. for the EU-28 in 2013. 38 –40 After reviewing the literature, Bentsen et al. quotes figures ranging between 20% and 33%. 22 Ericsson and Nilsson conclude that roughly one-third of harvested straw is used in animal husbandry. 41
Apart from straw, sugar beet leaves constitute a significant quantity of primary residues. In spite of its interesting content in protein, vitamin A, and carbohydrates, 41 it is rarely accounted for in the literature on agricultural residues (5.7 million tonnes in the EU-27 in 2013 or 20% of the EU straw demand according to Iqbal et al. 43 We assume that the proportion of collectible sugar beet leaves will not be higher than 10%, and the same concerning the level of agricultural use for fruits and vegetable residues. Potato haulms could also be a good source of biogas but they are usually desiccated before harvest. 44 Percentages of the removable residues used for agricultural and horticultural purposes that we considered in this work are compiled in see Table 4 for the main commodities.
Shares of the “Removable” Residues Used for Agricultural and Horticultural Purposes
Sources are detailed in the text.
Decomposition
Primary agricultural residues are further disaggregated into the main components of interest for the biobased economy, for example protein, fat, sugar, starch, cellulose, and other (that includes lignin). This disaggregation is calculated at a commodity level based on the Nutritive Factors list published by the FAO, which gives the total calorie content as well as the protein and fat contents of almost all agricultural crops. 45 The amount of carbohydrates was calculated as the difference between total calorie content and the amount of protein and fat. For those crops that are not contained in the Nutritive Factors (mainly fiber crops), various other sources were used to estimate the proportion of each main components of primary agricultural residues.
DataM: Data Processing and Data Access
To provide the European Bioeconomy Observatory with timely data, emphasis was put on data that could be easily accessed and were updated regularly. All the calculations described above can be automatically executed and updated four times a year. Estimates of the amounts of primary agricultural residues, as well as their composition, are accessible online with disaggregation at Member State and crop levels for the period 1961–2013. The full database is available online. 46
European Production and Use of Primary Agriculture Residues
The Production of Primary Agricultural Residues in Europe
The total production of primary agricultural residues in the EU-28 is estimated in this study as 395 million Tdm in 2013, while the average was 379 million Tdm over the period 2000–2013. Of the total 395 million Tdm produced in 2013, 297 million Tdm should remain in the fields for the provision of ecosystem services (the non-removable part), using conservative assumptions, and 29 million Tdm is estimated to be used for agricultural purposes (livestock feed and bedding and mulching in horticulture and mushroom cultivation). As a result, 69 million Tdm of primary agricultural residues is collectable for bioenergy and biobased product production (67 million Tdm based on the 2000–2013 average).
Comparing our results with other sources is not straightforward, since estimations of primary agricultural residues reported in the scientific literature vary according to the geographical scope of the study as well as with the year(s) of reference considered and the number of commodities covered. Nevertheless, in order to assess the consistency of our estimates with previous studies, we have applied the methodology described above to the data concepts that informed other studies (Table 3). The comparison between our “re-estimations” and the original figures shows that our results are similar to previously published work. Compared with previous work, our methodology has the advantages of covering a wide range of commodities (over 100) and a long time period (1961–2014).
At Member State level, estimates show that the geographical distribution of primary agricultural residue production in Europe is similar to the distribution of cereal production, which is their main source (Fig. 2). Thus, 60% of primary residues production is concentrated in five Member States. France ranks highest by a considerable margin, with a production of 76 million Tdm in 2013, followed by Germany (49 million Tdm), Poland (41 million Tdm), Romania (36 million Tdm) and Spain (34 million Tdm). A very similar distribution is observed for removable residues and residues that are collectable for biobased material and bioenergy uses.
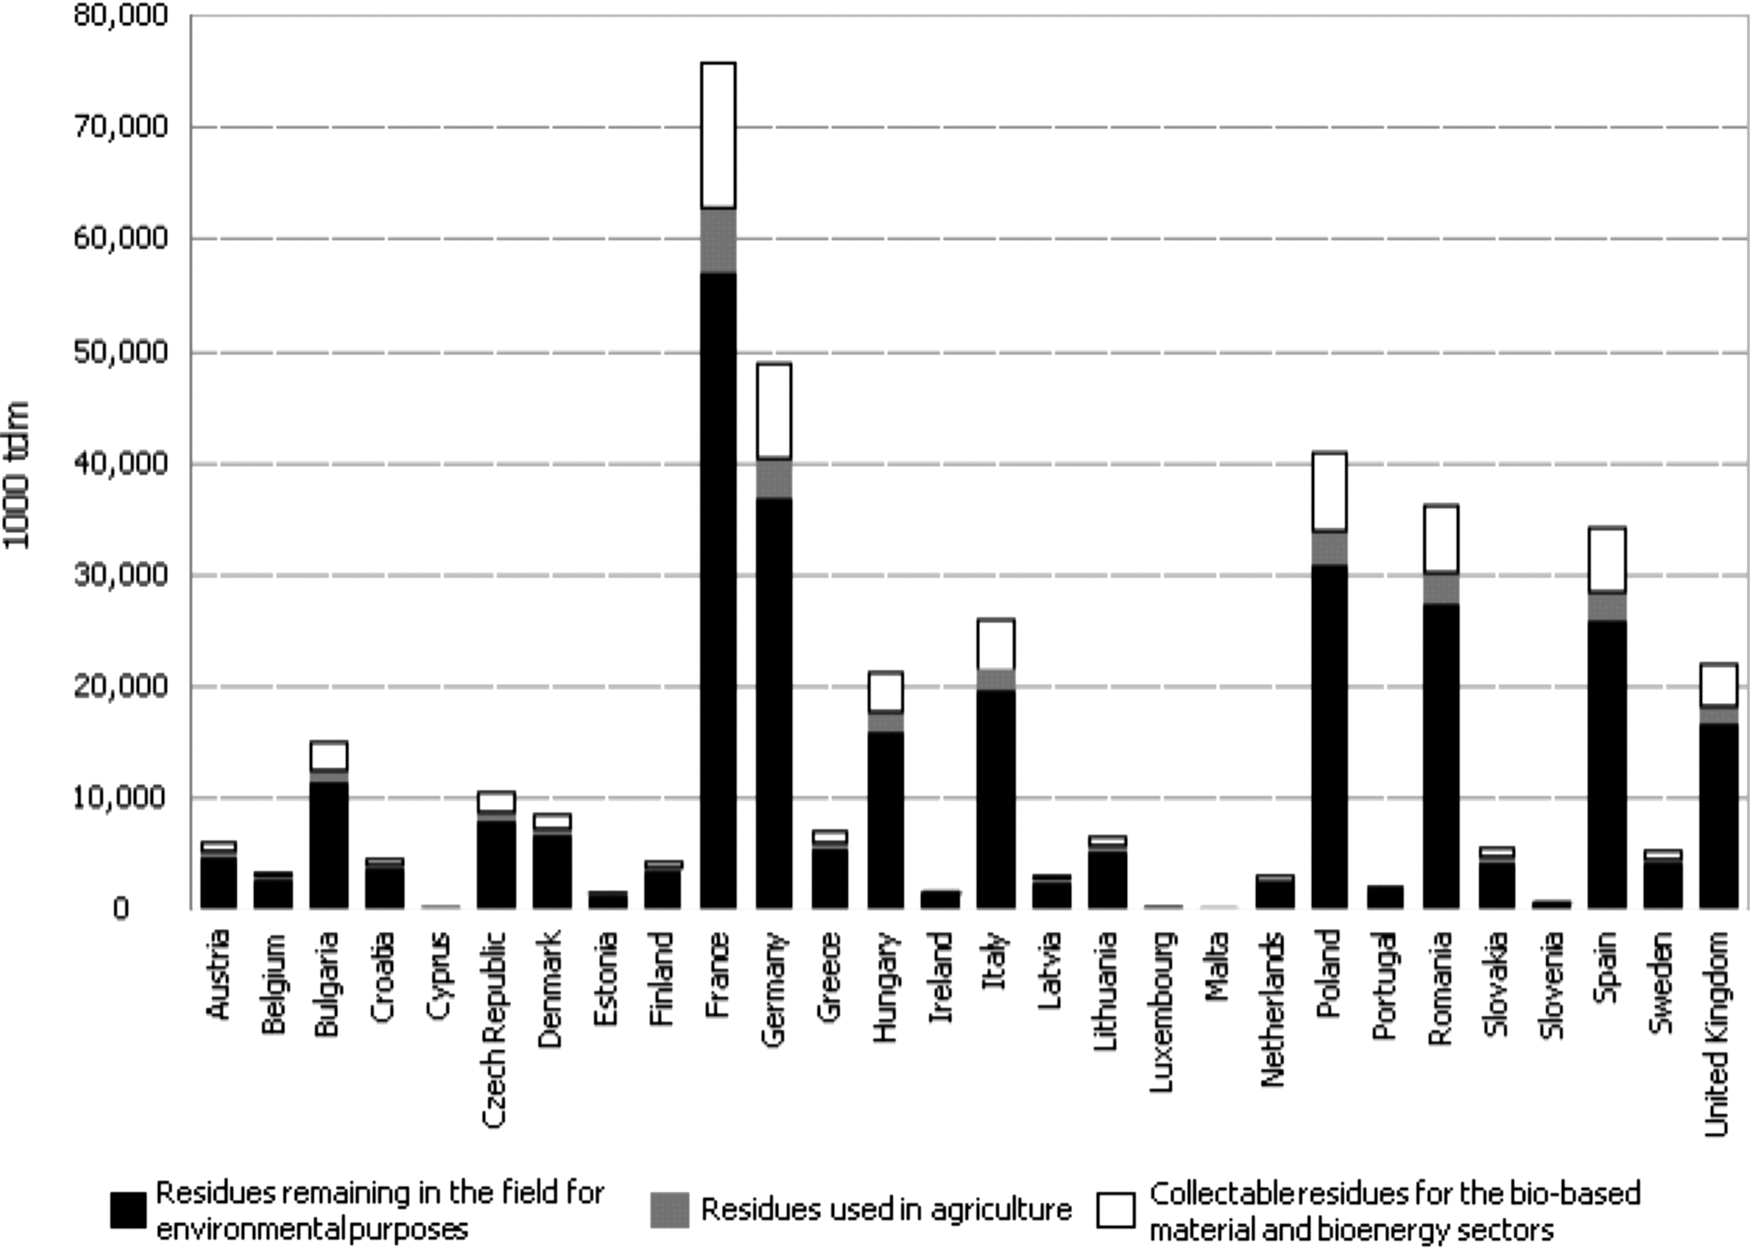
Primary agricultural residue production and possible uses in the 28 member states of the European Union (2013). The total primary agricultural residue production ia also the sum of the residues remaining in the field, the residues used in agriculture and the residues here considered collectable for the biobased industry.
Composition and Potential Uses of European Primary Agricultural Residues
The European production of primary agricultural residues is hugely dominated by cereal residue production (78% of dry matter). Oilseed residues contribute 13%, and sugar crops and starchy roots residues contribute 6%. Considering that 75% of the residues produced remain in the field for environmental use, we estimate that approximately 99 million Tdm could be harvested annually in the EU-28 (i.e., removable residues). For the European crop mix described above, this would be composed of 64% cellulose, 8% sugar and starch, 6% fats, 4% proteins, and 19% other components (Table 5).
Composition of Collectable Residues for the Biobased Industry in the 28 Member States of the European Union (1,000 Tdm, 2013)
The agricultural sector is using approximately 37% of the 99 million Tdm of removable residues, mainly in the form of cereal straw for animal bedding and horticultural mulching. As a result, the remaining 63% of removable residues are collectable for biobased material and bioenergy uses (i.e., 62 millions Tdm or the 16% of total primary agriculture residue production). This is composed of 36 million Tdm of cellulose, 7 million Tdm of sugar, and starch, 5 million Tdm of fat, 3 million Tdm of protein, and 11.5 million Tdm of other components (Fig. 3). Owing to the predominance of cellulosic components, primary agriculture residues constitute a potential feedstock for second-generation industrial processes where these are developed. 47
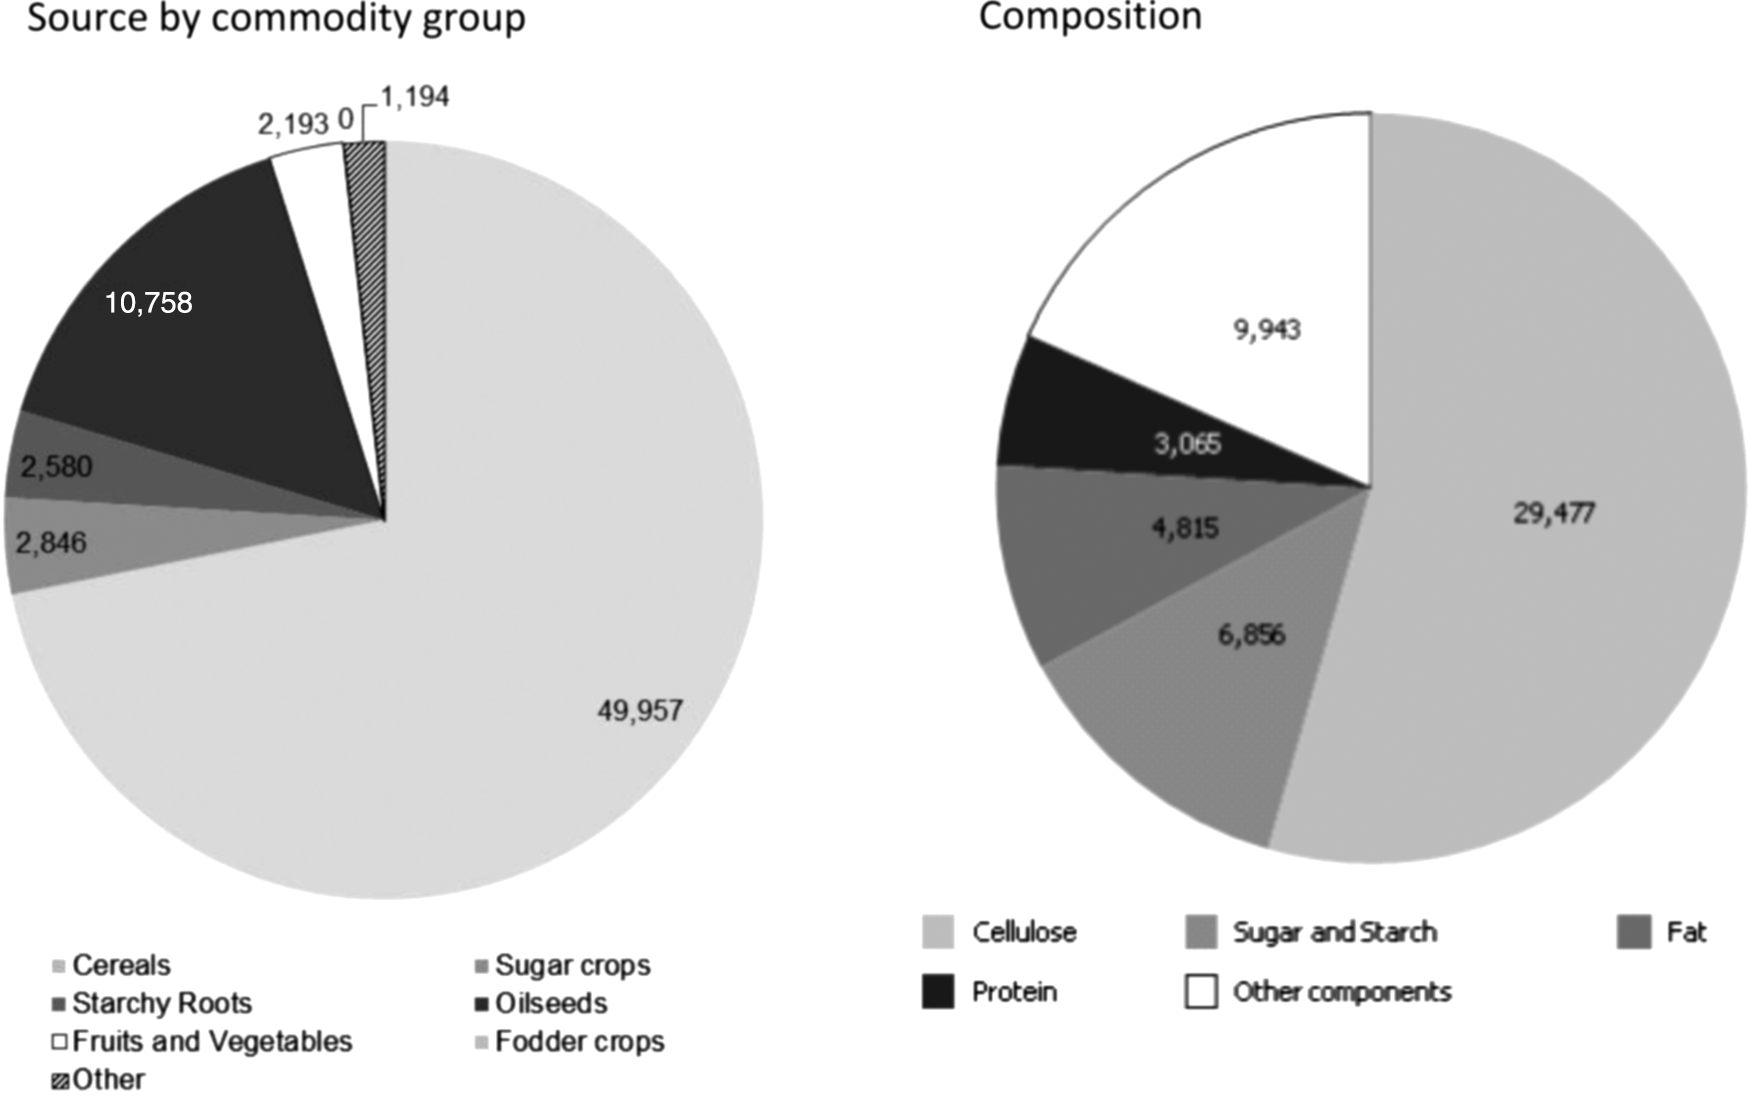
Source and composition of agricultural residues collectable for the biobased industry in the EU-28 for 2013 (1,000 Tdm).
At the Member State level, 42% or more of collectable residues is in the form of cellulose, except in a few countries, including Belgium and the Netherlands, where the contribution of sugar crop residues is significantly higher. In Belgium, collectable primary agricultural residues comprise 36% cellulose and 28% sugar and starch, while in the Netherlands the corresponding figures are 23% and 47% (for comparison, sugar and starch accounted for, on average, 10% of collectable agricultural residues in the EU-28 countries in 2013).
The European Production of Primary Agricultural Residues Over Time
The European production of primary agricultural residues shows very little variation over time, ranging from 355 to 410 million Tdm over the period 2000–2013. This stability partly stems from the calculation method. Assuming that crop residue production does not increase as fast as harvested crop production, RPR functions tend to lessen the impact of crop yield gains over crop residue production. As a result, at the EU level, the amount of collectable residues for the biobased industry in the years between 2000 and 2013 varied only from 62 to 72 million Tdm.
If no major disruptions occur within the agricultural sector and biobased value chains over the next 10 years, the overall picture described above is likely to remain almost unchanged. Using the baseline projections of the European Commission for agricultural production to 2025, 18 our methodology shows an almost zero average year-on-year growth rate for the production of primary agricultural residues in the EU-28 over the next decade. This predicted stability is consistent with past trends and with Bloomberg's projections for 2020. 48
Nevertheless, other scenarios are possible. Among the multiple drivers of primary agricultural residue production, the literature highlights the role of climate change on crop yields, the impact of changes in animal product consumption on residue uses for feed and animal bedding, and the development of biobased value chains as the most important drivers. 16,49
Discussion
Limitations of the Methodology
Large data sets of crop yields and corresponding residue yields are seldom available. This was the main difficulty we faced. An exception is the study by Unkovich et al., which consists of more than 600 data points for 20 crops grown in Australia, including data on yields, harvest index, and the year of data collection (from 1979 to 2007). 50 For the crops with sufficient data in this dataset, we tested whether an exponential function would provide a good fit to the data. For the four crops, wheat, barley, canola and field peas, R 2 for the fitted exponential functions ranged between 0.15 and 0.34.
The remaining RPR functions proposed in this study are not based on empirical data, but have been defined based on the conditions that they would have to fulfil. This compromise was a starting point to fill the current data gaps. As commented in the introduction, a more refined methodology combining a statistics-based and a remote sensing-based approaches is under developpement in the European Commission–Joint Research Centre (EC-JRC) in the framework of the Biomass assessment project. As soon as more precise RPR functions are established, a more precise quantification of primary agricultural residues will become feasible.
From Residue Production to Residue Availability
It is important to clarify the status of the estimates presented in this study. Our estimation of “total primary agricultural residues” gives an indication of the order of magnitude of primary agricultural residues produced in Europe and how this changes over time. However, it is much higher than the level of residues available as feedstock for bioindustrial uses. Another data concept, here termed “residues collectable for the biobased industry,” provides a rough estimate of the proportion of total primary agricultural residues that could feed the biobased industry (including bioenergy and biobased products production) after discounting the share of residues remaining in the field for environmental purposes and the share of residues serving agricultural uses (mainly animal bedding and horticulture). This data concept is close to the “technical potential'” described by Vis and van den Berg 16 and adopted by the EC-JRC. 51 It does not take into account the various economic, implementation and sustainability constraints that biobased value chains face in reality. 52 Consequently, it overestimates the amount of primary agricultural residue feedstock that is actually available for the biobased industry.
Determining the actual level of primary agricultural residue availability for the biobased industry would require the integration of additional parameters reflecting intra-annual variations in supply and quality, and also the relative competitiveness of agricultural residues compared with alternative feedstocks, for example fossil fuels.
Increasing the Residue Availability by Managing the Inherent Variability of Agricultural Biomass
The supply curve of primary agricultural residues peaks just after harvest and pruning periods. These periods of high availability also determine the periods of lowest biomass feedstock price. Downstream biobased industries therefore have to adapt their business model to intra-annual supply variations or to develop strategies to spread their use of biomass feedstock over time (e.g., multi-sourcing or storage), albeit at additional costs.
In addition, biomass feedstock is not stable by nature, which poses a challenge for industrial processes that are based on physically and chemically consistent materials. The quality of biomass feedstock, determined by its composition in terms of carbohydrates, lignin, extractives, ash, and other components, varies over time and between providers. 53,54 It is noteworthy, according to Kenney et al., that “feedstock moisture is probably the single most problematic biomass property affecting feedstock supply and biorefining operations.” 53 Feedstock moisture is mainly a result of harvest, storage, and processing conditions. Variations in composition stem from the soil, the climatic conditions at cropping, genetics, and agronomic practices. These authors describe a set of quality management options starting at farm level, with genetic approaches for crops and a normalization of agronomic practices, and ending at industry level with storage and blending practices in order to reduce variations in composition.
Increasing the Residue Availability by Dealing with the Specific Cost Structure of Biomass Feedstock
Costs also determine the economic availability of primary agricultural residues. Kircher estimates biomass feedstock costs at 60–90% of production costs in biobased fuels and bulk chemicals. 55 These costs are mainly made up of the harvest and logistic costs of crop biomass (approximately 40% of operating costs according to the same source). This is also underlined by the representatives of European biobased industries 56 interviewed in 2015 by Nattrass et al., 57 who cited the “increased or variable feedstock costs” as the second main barrier to the development of biobased products, after high production costs. Innovations in harvesting machinery could help with lowering harvest costs while delivering better-quality agricultural residues. 53 Options to reduce logistics costs (mainly transport and storage costs) largely depend on the business model of biobased industries. Although local sourcing to reduce transport costs is an option envisaged by some, it does not allow the economies of scales sought by others. The multi-feedstock sourcing approach is attractive in terms of “risk reduction through feedstock diversification, reduced storage costs through sourcing materials that can be harvested at different times throughout the year, and reduced transportation costs through taking full advantage of all available local resources,” 54 although this approach is not well adapted to highly specialized processes requiring specific and stable feedstocks. 54,58 Cost structure improvements are also expected as bio-based processes and markets become more mature. 55
Following the establishment of the Biomass Crop Assistance Program 59 by the US government in 2009, Bloomberg claimed that a supportive EU policy to foster the harvest of agricultural residues would drive more biomass to the European biobased industry. 48 Later, in 2015, Kim and Dale stated that any measure—whether direct or indirect—aimed at increasing the biomass supply would entail reduction in logistics costs and economies of scales, and would stimulate the biobased economy. 60 The European Commission acknowledges that a sufficient supply of biomass feedstock of good quality at competitive prices is crucial for the success of its bioeconomy strategy. 6
Agricultural Residues as a Feedstock with Low Competition for Uses
The development of the first generation of biofuels has sparked off multiple debates and controversies surrounding the possible adverse effects of scaling up the mobilization of edible biomass for non-food uses. Controversies have crystallized around sustainability issues that involve the contribution of biofuel feedstock to greenhouse gas savings (when accounting for agricultural inputs and LUC–ILUC effects) and possible issues in food markets. At first sight, the mobilization of primary agricultural residues is less controversial.
First, the volume of biomass at stake for the mobilization of primary agricultural residues is incomparably smaller than the potential volume of biofuel crops 61 and, second, agricultural residues are usually in the form of non-edible biomass, which is not connected to food markets. However, as can be learned from previous debates, primary agricultural residues are a priori not considered completely neutral in terms of impacts on food markets and land allocation choices. 8,57 The initial impact assessments show interactions with land use patterns and food markets, albeit of a relatively small magnitude. 10,63 For example, Thompson and Meyer 10 estimate that fulfilling the US target of cellulosic ethanol production by 2020 using wheat or maize residues would trigger a 6% decrease in the corresponding crop price compared with the baseline, although this would not significantly affect domestic food prices. In the case of using maize stover, feed prices would also change as a result of substitution effects (a 6% decrease in distiller grain price and a 5% decrease in soybean meal price), thus reducing the cost of production for livestock.
Improving the Resource Efficiency: The Next Challenge for the European Bioeconomy
Interestingly, the lines of the debate have been evolving in Europe since the 2010s. From questions (as described above) related to the adverse effects of biomass use, the debate shifted progressively towards renewed approaches to enhance resource efficiency throughout all biobased value chains. At the first level of biomass production, resource efficiency maximization requires productivity gains per hectare and the minimization of unused crop/forestry/aquatic residues by the optimization of current biobased value chains and the development of new ones. At the processing stage, resource efficiency implies taking advantage of all possible synergies across sectors and processing routes to minimize the use of biomass feedstock per unit of final product. This concern was already integrated in action 10 of the European Commission bioeconomy action plan (2012) under the concepts of “biorefineries” and “cascading use.” 64 This shift towards cascading use is directly linked to the issue of greenhouse gas savings, since it is predicted to “maximize the amount of carbon sequestered in biomaterials,” which is preferable to the carbon release resulting from bioenergy uses of biomass. 65 Finally, resource efficiency can be improved until the product's end-of-life circular process chains are developed, which will also lower the carbon footprint of biobased materials. 55 Following that theme, biomass and biobased products are the focus of the fifth priority area of the recently defined Circular Economy Action Plan of the European Commission. 66
In summary, the controversies that have arisen over the non-food uses of biomass are not yet settled, but they have given birth to renewed reflections on the possibility of a more efficient Europe. An orientation towards a more integrated approach of the bioeconomy is supported at institutional level, 67 at the industrial level, and by the civil society. 68 Nevertheless, the challenge ahead is considerable in terms of innovation and coordination across sectors and actors, to such an extent that the German Bioeconomy Council has not hesitated to define the required changes as “cultural changes” in terms of greater interdisciplinarity and international orientation of research activities in the research sector. 68 –71 For that reason, the establishment of an enabling policy framework escape from the diverse lock-ins of our linear model is already on the agenda. 72
Conclusion
The main contribution of the study is to estimate the amounts of primary agricultural residues produced in the EU. To this end, we propose the use of exponential functions of crop yield to calculate RPRs. RPRs for nine commodities (or group of commodities) have been compiled from the scientific literature and RPRs for a further 28 commodities (or group of commodities) that have not been reported in the literature are proposed. This methodological improvement has made it possible to estimate the amount of primary residues produced by over 130 crop commodities for the period 1961–2013. Hence, the methodology described here has the advantages of covering a very large range of crop commodities and of being applicable to the rest of the world (i.e., non-EU countries). It will be updated once the EU-JRC publishes new RPR functions, established from a more refined methodology.
The estimate of 395 million Tdm of primary agricultural residues produced in Europe in 2013 is consistent with previous studies, which lends support to this methodology. After allocating a portion of residues to the maintenance of ecosystem services and a further portion to agricultural purposes, we find that 69 million Tdm of primary agricultural residues is collectable to feed the biobased material and bioenergy sectors. This is mainly composed of cellulose (42%) and sugar and starch (10%). Their production is concentrated in five Member States with large agricultural sectors: France, Germany, Poland, Romania, and Spain. The European production of primary agricultural residues has been stable over the past 13 years. It is expected to remain at the same level for the next 15 years, providing no major disruptions in the agricultural and biobased sectors occur. Nevertheless, opportunities exist to take better advantage of the current levels of residue production. Among them, wider adoption of ad hoc harvesting machinery, optimization of logistic processes, and maturation of the new biobased value chains are the most evident. However, the maximization of the European resource efficiency presupposes that there will be drastic innovations and organizational changes that will replace our linear model of production with a circular and more efficient one.
As they were implemented with the DataM data management tool, our estimates will be automatically updated following the calendar of update of FAOSTAT, the original data source. Therefore, they will be reported in a timely fashion to the European Bioeconomy Observatory. The quantification of primary agricultural residues is part of a wider research programme that seeks to quantify the biomass flows within the EU. To that end, the next research questions will concern a more precise quantification of biomass uses. The tracking of rapidly evolving biobased value chains will be particularly challenging.
Footnotes
Acknowledgments
This paper is part of the Bioeconomy Information System and Observatory (BISO) project, a FP7 project coordinated by the Joint Research Centre (JRC) of the European Commission (