
Abstract
Biofuel produced from biomass is one of the main alternatives for reducing the use of fossil fuels. This work evaluates the ethanol production from different mixtures of banana waste (pseudostem, peels, and rejected fruit) through process simulations using the Aspen Hysys® software. The mixtures analyzed were pseudostem-rejected fruit, pseudostem-peel, and the mixture of the three wastes (in the proportion that they are discarded after harvesting the fruit). Results indicated the use of a proportion of 35% pseudostem and 65% rejected fruit and, a rate of 50% of each residue for the mixture of the peel with pseudostem. The best scenario studied was using a mixture of three banana wastes. In this case, the ethanol content in wine could be increased by about 18%. Besides demonstrating that using a mixture of residues is better than one alone, the simulations showed that this scenario enables thermal integration where the process energy demand could be reduced by up to 68.7%, with a payback of only 1.7 years. Carbon emissions were also reduced by 68.65%.
Introduction
Biofuels produced from biomass offer a means to decrease dependence on natural crude oil and to reduce emissions of greenhouse gases, which affect the environment globally. 1 Brazil and the United States comprise about 80% of the world's ethanol production through the fermentation of sugars from sugarcane and corn, respectively, known as first-generation ethanol. 2 Sugarcane has predominated in Brazil since 1970 due to government incentives, 3 but there is a need for alternative raw materials. Global energy demand increased 2.5% in 2017, higher than 1.2% in the year before and the fastest growth since 2013. 4 Issues concerning the land use for a single crop, disputes between food and fuel production, and problems associated with food prices have shifted attention to lignocellulosic residues as potential substrates for bioethanol production due to their low cost, abundance, and sustainability. 5,6
To produce ethanol from lignocellulosic biomass (second-generation ethanol), the raw material is first pretreated. Pretreatment—either biological, chemical, physical, thermal, or some combination of these—is required to break the lignin-cellulose-hemicellulose complex, altering the biomass structures and making cellulose accessible to hydrolysis. The lignocellulosic biomass must then undergo hydrolysis (chemically or biologically), i.e., the saccharification of lignocellulosic material into fermentable sugars. In the fermentation step, sugars are consumed by microorganisms for their cell growth, producing ethanol and carbon dioxide. However, this ethanol is produced in an aqueous media and must be dehydrated (ethanol purification step/distillation) before being used as a fuel. 7
Several studies have demonstrated the feasibility of using different lignocellulosic residues. The main agricultural wastes studied for second-generation ethanol production are straw of rice, wheat, or corn, and bagasse. 8 Other examples are sugar-based raw materials that include energy crops such as sugar beet, sweet sorghum, and fruits like grape, melon, and apple. 9 In Brazil, bagasse from sugar cane has been studied as a raw material to produce second-generation ethanol. However, this lignocellulosic residue is already used as a feedstock in the production of electricity in power plants (cogeneration of energy). 10 In some countries, like Belize, bagasse cogeneration represents an an opportunity to reduce energy dependence. 11 So, the introduction and dissemination of lignocellulosic ethanol may bring new usefulness to this sugarcane residue, leading to competition for this input, just as the production of sugar and ethanol compete for sugarcane sugar.
Therefore, it is essential to use other lignocellulosic residues in second-generation ethanol production. In tropical countries, wastes generated during banana harvesting (such as rejected fruit, leaves, peels, and pseudostem) are becoming an alternative for ethanol production. Banana waste is widely available after fruit harvesting. Malaysia rejected approximately 30% of total banana production, 12 and Costa Rica and Ecuador rejected as residues around 20% to 40% of the bananas produced because they did not meet export standards. 13 In Brazil, for each ton of harvested banana, approximately 4 tons of lignocellulosic waste are generated (3 tons of pseudostem, 160 kg of stems, 480 kg leaves, and 440 kg of peels) and about 100 kg of fruits are rejected. 14 These numbers represent a proportion of 84.7% of pseudostem, 12.4% of peels and 2.8% of rejected fruit when considering these three cited residues.
Ethanol production from lignocellulosic biomass on a commercial scale still faces specific technical barriers that make it economically uncompetitive when compared to the traditional biomasses such as corn or sugarcane that produce first-generation ethanol. 1 Significant expenses include the necessity of energy-consuming pretreatment processes, several steps for overall conversion, limitations of the hydrolysis process, the inability of natural microorganisms to ferment both hexose and pentose sugars, and the formation of inhibitors. 1,5 –10 Specifically, when referring to the banana residue for ethanol production, research is still recent and relatively scarce. In Brazil, the potential for banana wastes for biofuel production was preliminarily indicated by studies using chemical characterization and thermal techniques, as well as the characterization of their composition. 14 –16 Peru and Colombia also demonstrated the feasibility of the bioconversion of pseudostem, leaves, and rachis of banana obtained from agricultural communities due to the relative abundance of these wastes. 17 So, for banana waste to become an attractive raw material for ethanol production, it is necessary to establish more than operational conditions; it is essential to evaluate how to optimize the use of the lignocellulosic residue in a productive route. Operational and energetic integrations are necessary. Recent developments have focused on different technological configurations, mainly different pretreatments and hydrolysis, engineered microorganisms for fermentation, and energy as well as process steps integration. 9,18
Biomass must be used to its fullest potential to make second-generation ethanol production feasible and optimize costs. For this reason, studies concerning hybrid feedstocks have concentrated on the integration of first- and second-generation ethanol production using only one type of cellulosic residue. 10,19,20 In all cases, hybrid scenarios showed energetic and economic advantages. They also allow the use of different sugar sources, such as pentoses. Little research proposes blending different cellulosic residues. Recently, the use of the bagasse and trash from the sugarcane field was proposed, and it was demonstrated that these residues together could reduce both environmental impact and energy requirements. 21
Process simulations guide the decision-making process, conduct analysis and system evaluations, and propose solutions to improve performance. 22 Also, mass and energy balances are crucial for quantifying material flows and for assessing the overall technology. 19 The simulation of all production steps of second-generation ethanol production from an alternative residue is an essential tool for optimizing the whole process, although few have been undertaken for lignocellulosic ethanol production. Studies concerning second-generation ethanol simulations have concentrated on the purification step, once commercial simulators became suitable for these applications, and have enabled proposals for advanced distillation processes, for example. 23 –26 Little research has carried out simulations of the whole production route due to the difficultly in implementing and connecting the several steps involves. They have focused on sensitivity analysis for production cost of second-generation ethanol from bagasse, 27,28 lignocellulosic feedstock selection (none concerning banana residues), 29,30 or proposed autonomous distillery of sugar and bioethanol. 31
The objective of this work is to evaluate bioethanol production from different banana waste mixtures—pseudostem, peels, and rejected fruit—considering different proportions among them. Different scenarios were generated through process simulations, from pretreatment to fermentation, using the Aspen Hysys® software.
The main research questions to be addressed are: What is the best proportion between the two or three residues to enhance ethanol production? Is there any relationship between sugar concentration and energy requirements? Is it possible to represent the whole process with a commercial simulator? Is there a possible energy-integration route?
Studies concerning hybrid feedstocks have focused on first- and second-generation ethanol and not on different kinds of residues from the same crop. Simulation of the whole production route, taking into account the particularities of the use of banana waste, would enable the study of energy requirements. This residue was only studied in separated steps and not in the whole process.
This work proposes integrating two or three kinds of banana waste as substrate to produce ethanol. This proposal allows the use of all rejected material, thus contributing to environmental issues concerning waste disposal since banana residues are abundant worldwide but studies that evaluate their use are scarce. Using the process simulation tool, this study determined energy and sugar requirements for different mixtures of residues.
Materials and Methods
Software and Simulation Procedure
Aspen Hysys software (version 8.0) was used for the simulations. Table 1 summarizes the different scenarios proposed and their objectives. 14,16,32 –34 Figure 1 shows the steps simulated. Operations that consume energy are represented with a diamond, and those that release energy are represented with a square.
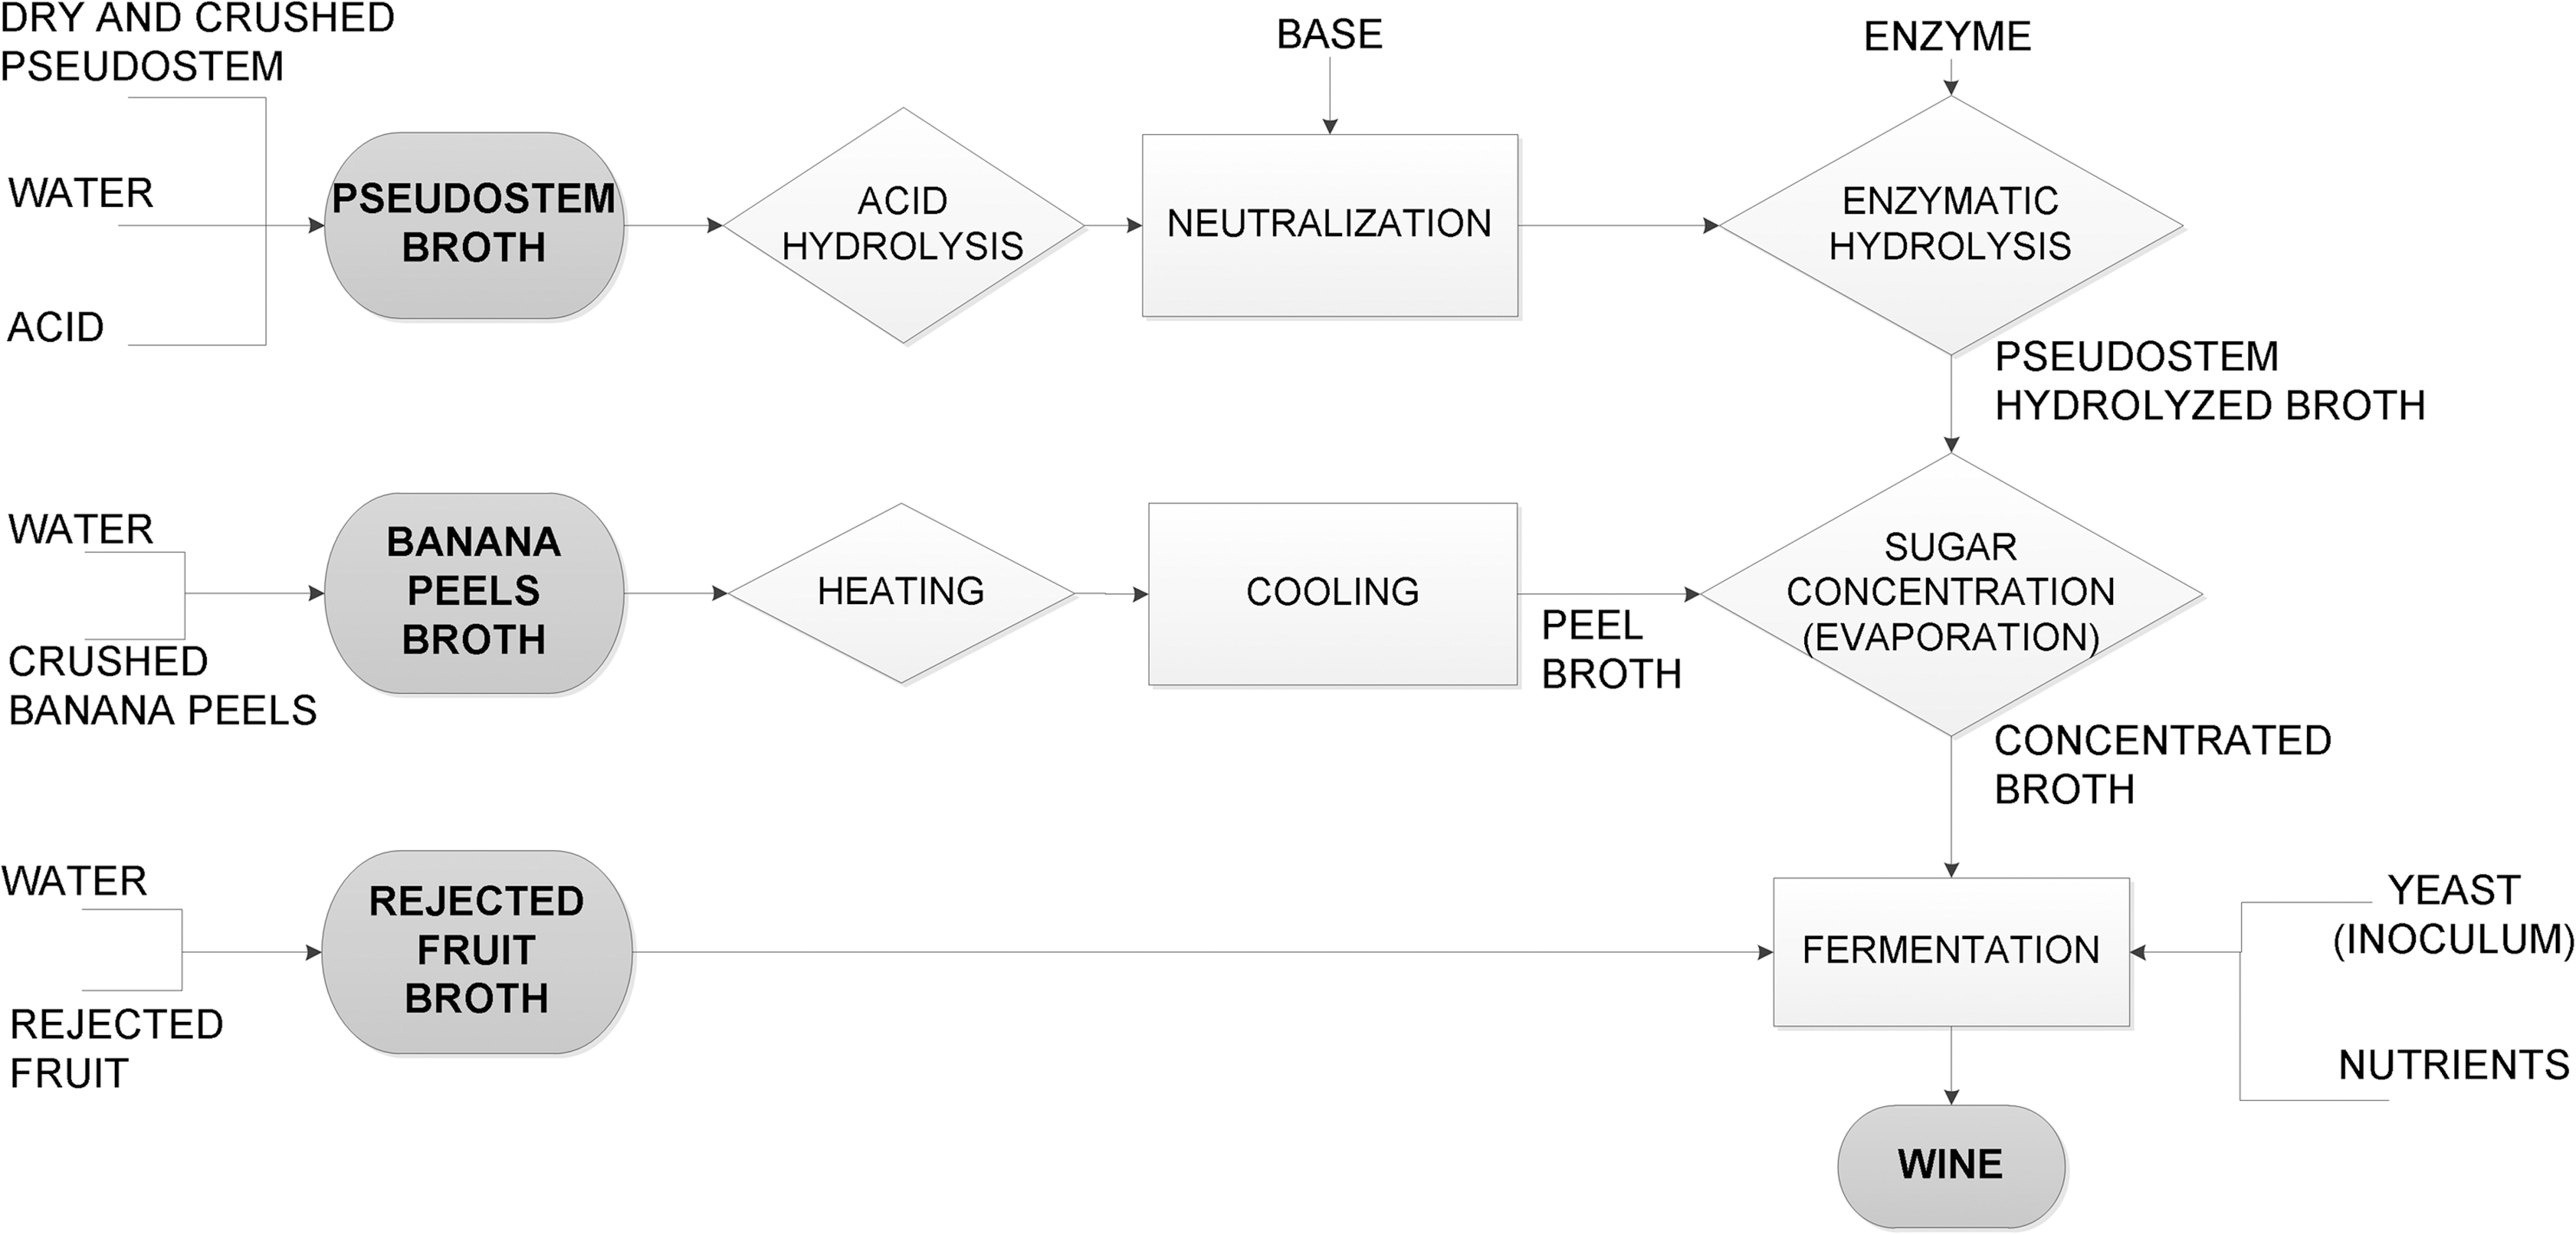
Schematic diagram of the processes simulated comprising three banana residues.
Different Scenarios Proposed and Their Objectives
Distillation was not included in this study, since after fermentation lignocellulosic ethanol production is comparable to conventional production. Since there was no modification proposed, the energy requirements of the purification are the same. Also, pretreatment of banana residues was not considered, such as the energy requirements of crushing the pseudostem and banana peels, since the software does not contain an appropriate tool to simulate mechanical operations. The energy studied refers only to thermal energy, including heat exchangers and reactors.
The mixture of banana peels and rejected fruit was not considered as a scenario because these residues were generated from harvesting in minor proportion. It is important to consider that this study proposes the integration of banana residues as a way to use its fullest potential, but aspects such as storage of peels and rejected fruit should be considered. First, it is essential to identify the substrate and energy requirements, thus evaluating aspects like the feasibility of using a mixture of residues and, later, to analyze conditions as to space storage.
Scenario 4 was performed using the simulator tool entitled Energy Analysis. The energy target values were calculated using the Utility Load Allocation Method and pinch temperature. It uses the Grand Composite Curve to allocate utilities, maximizing the use of the cheapest utilities (a utility is considered cheaper not based on cost but temperature). It assumes that the least expensive utilities are the hottest cold utilities and the coldest hot utilities. For the proposal of a heat exchanger network design, the simulator plots a Composite Curves graph with the temperature and energy transfer required from all the process streams. From this analysis, it is possible to identify (1) the minimum cold utility required and at what temperature the cold utility has to be; (2) the pinch temperature of the heat exchanger network design, which indicates the minimum temperature difference between streams; and (3) the possible region of heat recovery by using process-process heat exchangers. The pinch temperatures occur at the minimum temperature difference between the hot stream and cold stream temperature, when both hot and cold streams have the same heat flow and the temperature when the net heat flows in the process is zero.
Equation 1
represents the calculation of the total energy usage reduction.
Equation 2
shows the CO2 emission rate that is the product of the utility energy use (Q, energy/time) and the emission factor (EF, kg CO2/energy). EF was obtained from Aspen Hysys database, and it is based on the EU 2007/589/EC Carbon Emission Factors or United States EPA Rule E9-5711 CO2 Emissions Factors.
The main assumptions considered in all simulations were: The components not quantified experimentally but presented in banana waste were considered as inert residue. They were inserted in simulation as lignin since this biopolymer does not react in the process. This hypothesis was based on simulations done with sugarcane,
19
and it is required to complete 100% of the composition of each residue in the simulator. Conversion reactions were implemented. They are based in the stoichiometry, and this parameter was experimentally determined, or it was available in the literature. The decomposition of the xylose to subproducts was not taken into consideration, because the objective of this study was to evaluate only the concentration of sugars metabolized by yeast (six-carbon sugars).
The thermodynamic package NRTL was used to calculate the liquid phase activity coefficient, and the SRK equation of state was used for the vapor phase.
28
Components of the software database included were glucose, water, acetic acid, sulfuric acid, carbon dioxide, glycerol, succinic acid, isoamyl alcohol, ammonia, hydrogen, and ethanol. Other components that are not present in the simulator were created:
20
Solids—cellulose, hemicellulose, lignin, salt, yeast (CH1,8O0,9N0,145), enzyme (CH1,57N0,29O0,31S0,007) Liquid—hydroxyMethylFurfural (HMF).
The main operational conditions implemented in each process were: Acid hydrolysis: Temperature of 120°C and 2% of the acid in relation to wet mass
16
Neutralization: Temperature of 45°C
16
Enzymatic hydrolysis: Temperature of 45°C
16
and enzyme concentration of 0.114 g enzyme/g treated residue
35
Sugar concentration: ∼65 g/L
33
for pseudostem simulations (reference case and mixtures) and ∼50 g/L
34
for peel simulations (reference case) Fermentation: temperature of 30°C,
20
inoculum concentration of 1.6 g yeast/L and ammonia (nutrients) for yeast growing.
19
Table 2 summarizes the compositions of the banana residues. The data were collected in previous experimental studies 16,32 –34 conducted by the research group at the University of Joinville (Joinville, Brazil). Techniques included chemical and thermal characterization of banana culture residues, as well as characterization of their compositions. Table 3 shows the reactions implemented and its conversions. 16,19
Mass Fraction and Initial Concentration of the Residues Used in the Simulations (Based on Experimental Data)
Reactions Implemented in the Simulator and Its Conversions
Experimentally determined composition of the rejected fruit and peel included fructose, sucrose, and glucose ( Table 2 ). In the simulator, the ethanol formation reaction was implemented by converting only the glucose ( Table 3 ). Therefore, the glucose input in the simulation for these two residues was equal to the sum of all fermentable sugars.
The starch fraction in fruit was not considered once the rejected one is a mature banana. 32 The more mature the fruit, the higher the sugar content in the pulp (about 19%) and the lower the quantity of starch (which is only 1%). 36 Also, the amount of pectin present in the peel was not quantified. Banana peel has only about 16% pectin (in dry mass), and about 60% of this total pectin is composed of galacturonic acid units and the remaining sugar moiety, galactose, rhamnose, glucose, and xylose. 37 Thus, the sugar fraction from starch and pectin is small compared with that already available for the process.
In those previous experimental studies, the process was carried out in batch, and for continuous simulation, flow rates were calculated from the volume and residence time of each laboratory process. The final volume was kept to 0.1 L and the fermentation time was 12 h, aiming to normalize volume and time along the whole production route. Therefore, the input flow rates varied according to the proportion of each residue in the mixture, always keeping the flow to the final fermentation of 8.3x10⁻³ kg/h. So, to make the entire process continuous, splits and mixers were used to represent intermediate storage tanks.
Validation of the Simulation Results
Validation of the simulation results was done for each residue individually with data obtained from research group experimental studies ( Table 4 ). 16,32 –34 The criteria for validation were: sugar concentration available after treatment of each waste and ethanol concentration after fermentation, all obtained experimentally and compared with the simulated.
Comparison Between Simulated and Experimental Results
Simulations were considered validated and indicated an excellent reproduction of the experimental data once its results agree with the range obtained experimentally. It is important to highlight that the sugar concentrations used in this research are the maximum values reached in experimental practices with these residues until the elaboration of this work. Possibilities of increasing these concentrations are being studied to achieve higher concentrations of ethanol formed.
Results and Discussion
Scenario 1: Mixture of the Pseudostem and Rejected Fruit
Pseudostem hydrolyzed broth was first concentrated and then blended to rejected fruit broth before the fermentation step (
Fig. 1
). To evaluate this scenario, it is important to consider: The initial sugar concentration in the rejected fruit broth is about 48 g/L (
Table 4
), and this residue is added directly into the fermentator; Pseudostem requires hydrolysis, and a subsequent sugar concentration step is performed to obtain a higher sugar concentration; The concentration step should promote high concentrations of the pseudostem hydrolyzed broth in order to use a small portion of this stream in the mixture; The sugar concentration in the feed stream into fermentation is 65 g/L (maximum sugar concentration in experimental tests), and it could be obtained from different proportions between pseudostem hydrolyzed broth and rejected fruit.
Based on this, different proportions of mixture pseudostem-rejected fruit were proposed, considering 100% pseudostem as the reference case (it is the most discarded after harvesting the fruit, therefore, its residue is of more interest for the process).
Figure 2a shows results relating the pseudostem proportion in the mixture with the sugar concentration that is required for the pseudostem concentrated broth. Figure 3 shows this parameter related to the energy requirements. It is important to consider that in all simulations in this scenario, the concentration of the ethanol produced was established around 22 g/L, precisely because the sugar concentration into fermentation and sugar conversion to ethanol was always the same (65 g/L).
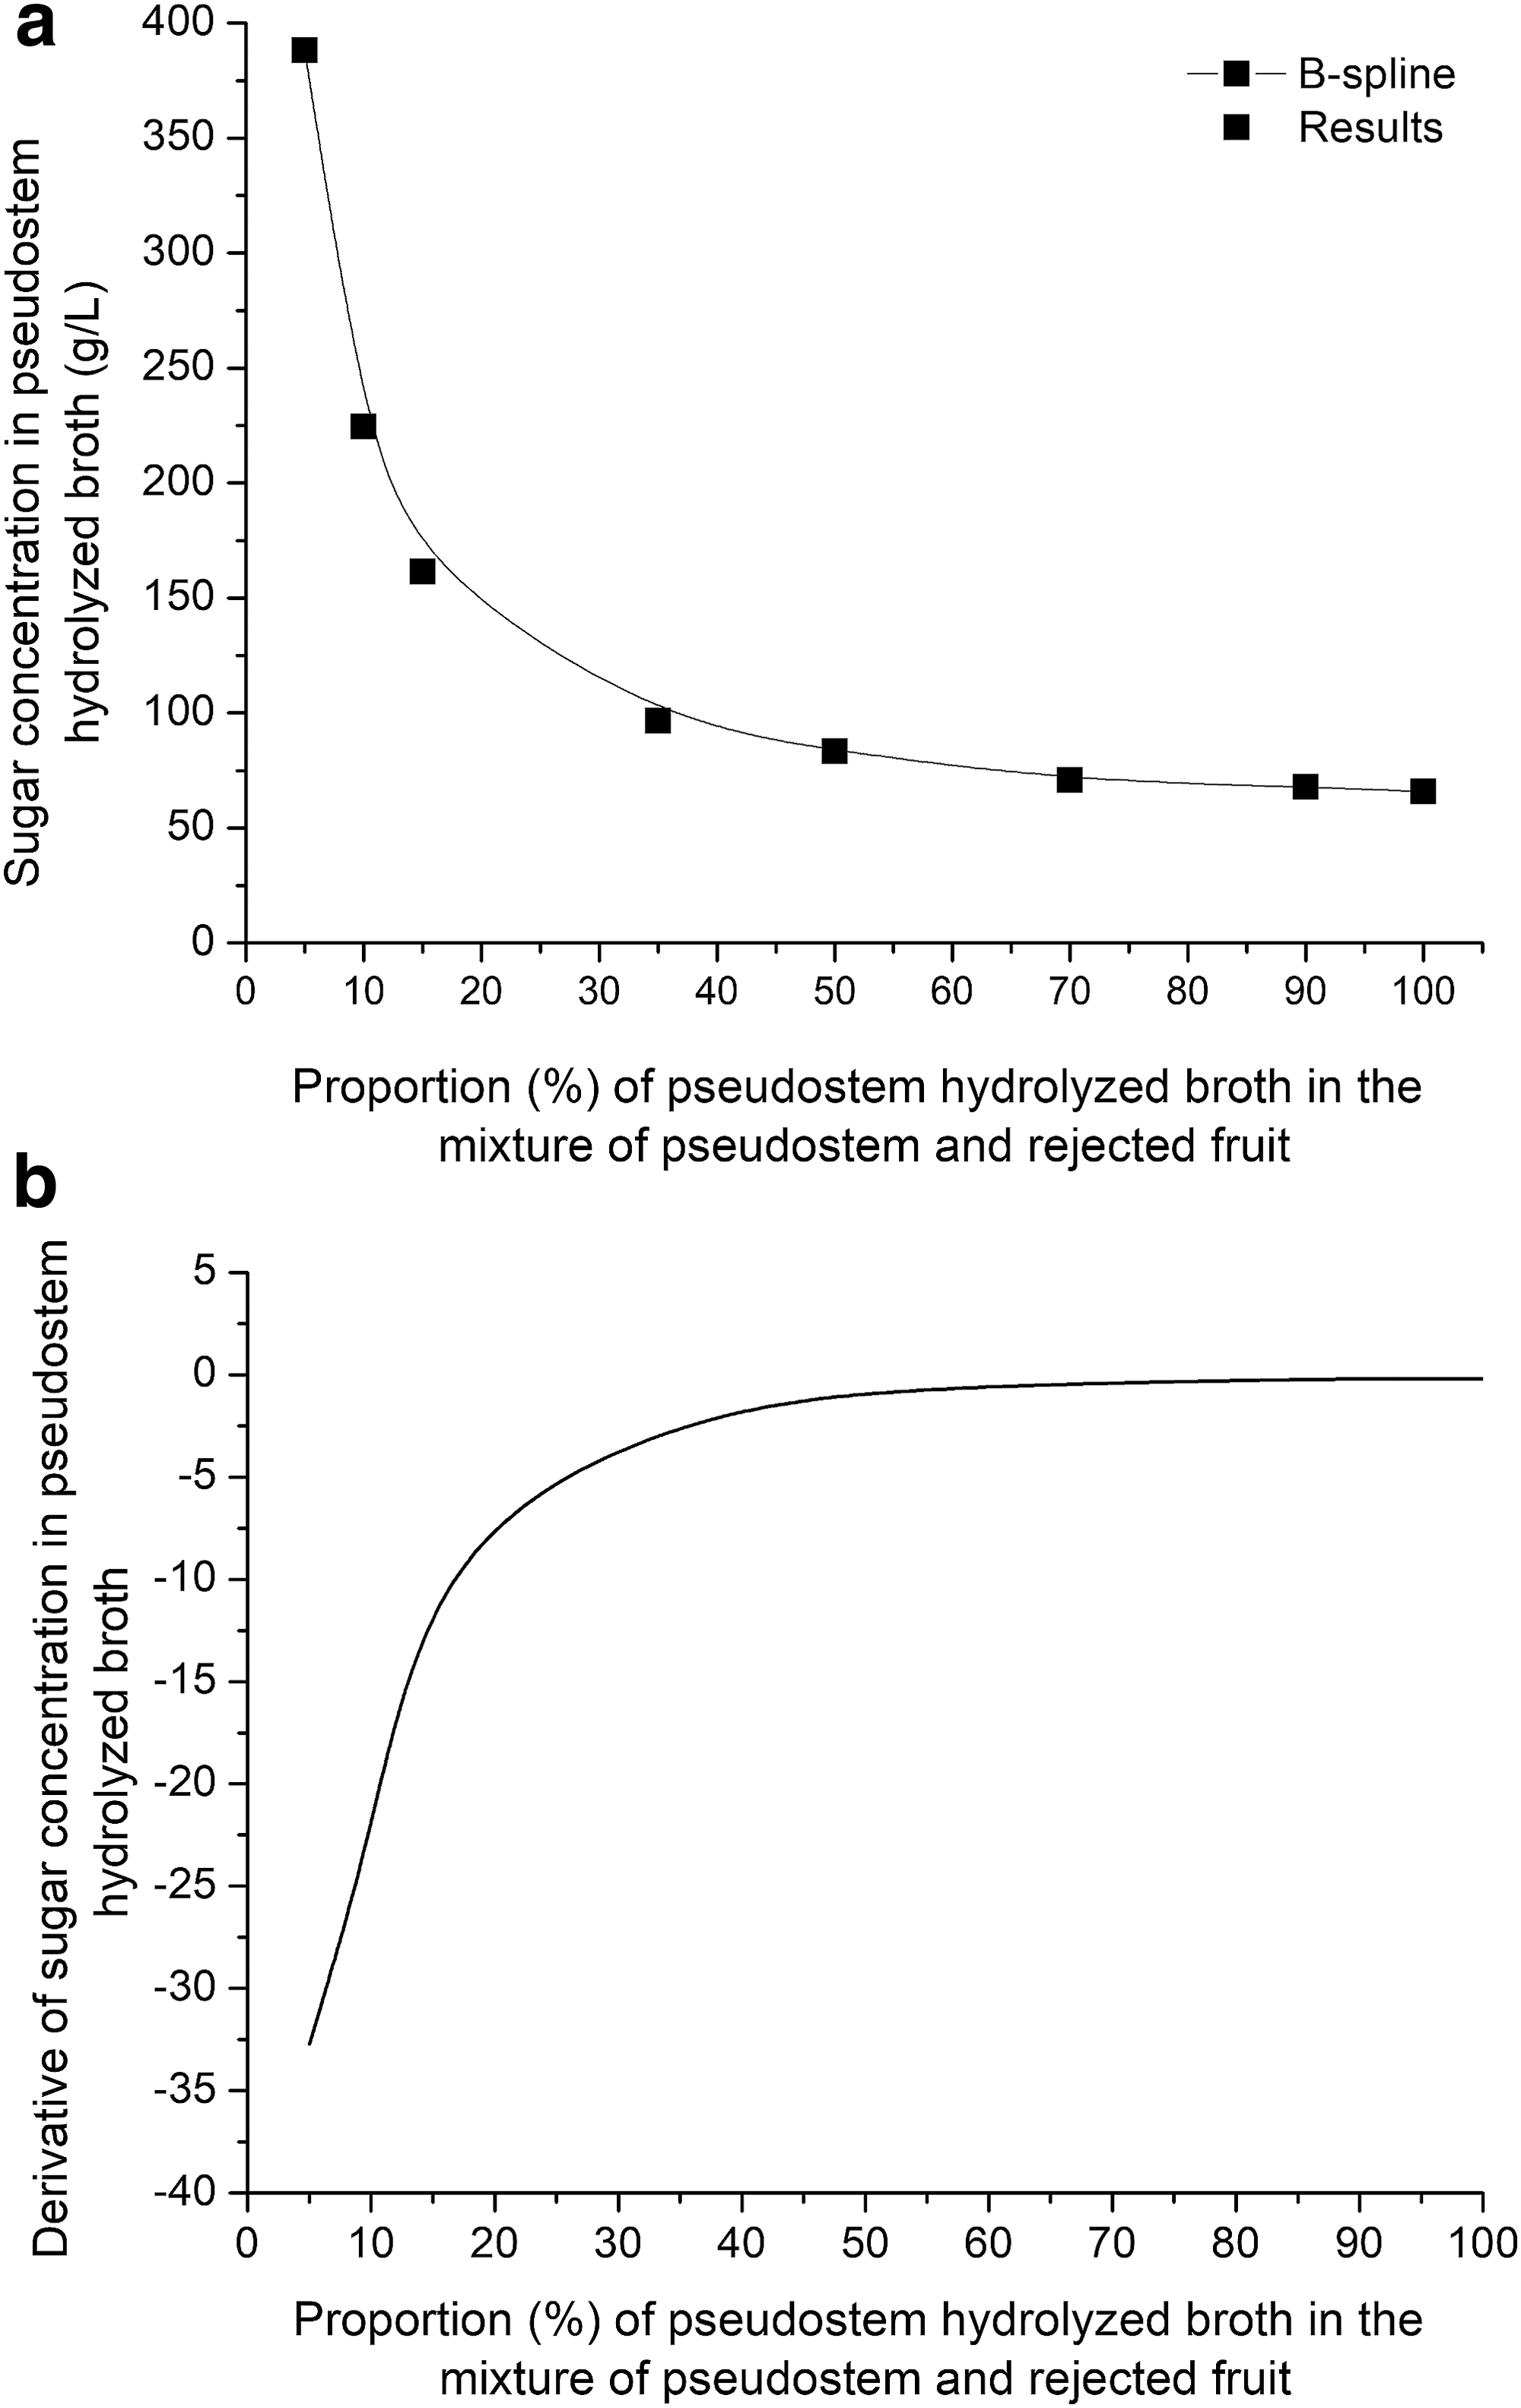
Profile of sugar concentration in pseudostem hydrolyzed broth with different proportions of pseudostem/rejected fruit
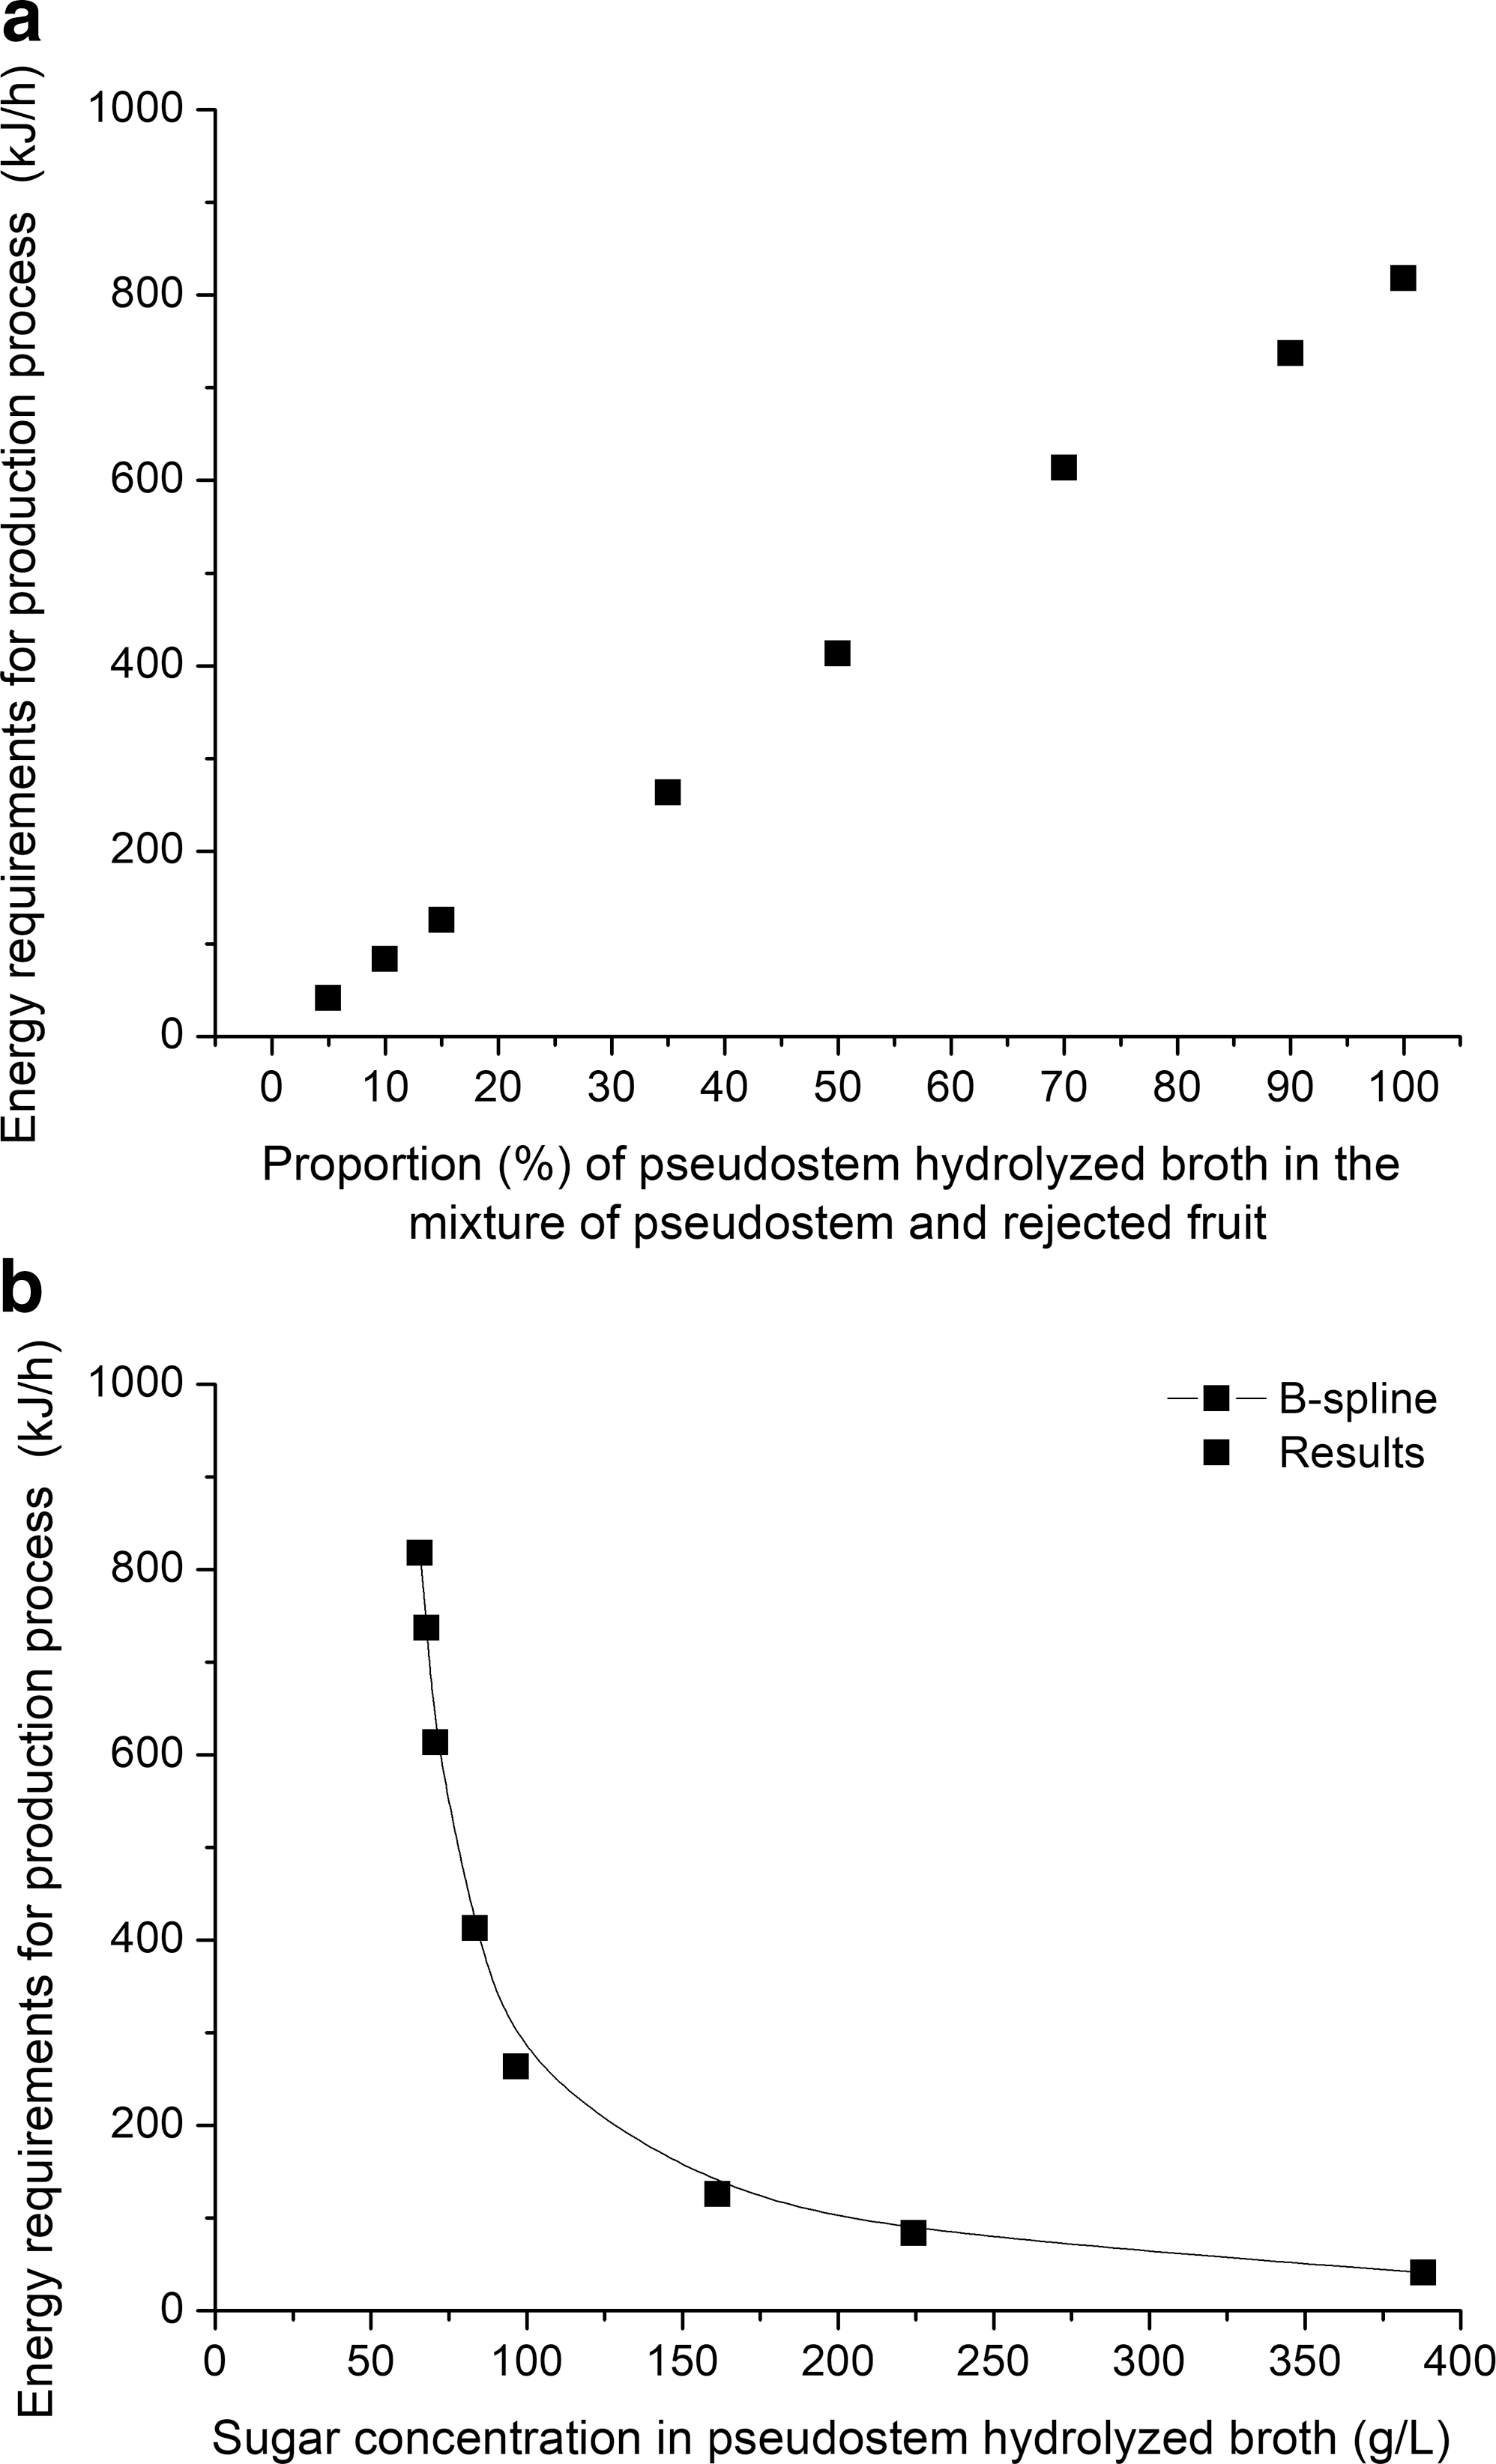
Profile of energy process demand with different proportions of pseudostem/rejected fruit
As it can be seen in Fig. 2a , to use 50% pseudostem in the mixture, it would be necessary to concentrate the pseudostem hydrolyzed broth to 83.5 g/L, a value 21.2% higher when compared to the use of 100% pseudostem (that produces sugar for fermentation of 65 g/L). The situation is critical to use only 10% pseudostem, requiring a concentration of about 224.5 g/L sugar in the pseudostem hydrolyzed broth and, representing an increase of 241% compared to 65 g/L. At this concentration, several problems concerning the mixture viscosity could be observed that are disadvantageous for the process. The pseudostem is the residue most abundant among all generated from banana harvesting. It is very advantageous result that indicates more use of this waste, and because of this, most of the research uses this waste alone.
As expected, as the proportion of pseudostem in the mixture to feed the fermentation is increased, the requirement to concentrate the hydrolyzed broth decreased. However, as can be seen in Fig. 2a , there is a point in which the pseudostem addition in the mixture is not relevant anymore. It is an important result, showing that there is wide variation in the sugar concentration requirement until the proportion around 50% of pseudostem hydrolyzed broth was inserted. From this point onwards, there is only a slight change, and the values of concentration were almost constant, i.e., proportions lower than 50% in this mixture do not contribute to the process. Calculating the derivative of these results ( Fig. 2b ), it could be observed that the increments on the values obtained decreased from where 35% of pseudostem was added in the mixture.
It is important to note that a concentration step is still necessary using the pseudostem alone, once the sugar provided from hydrolysis is lower than 65 g/L (the value established for fermentation). This is directly related to the energy consumption: to concentrate the pseudostem hydrolyzed broth reduces the total energy requirements to the process, as can be seen in Fig. 3a . For example, 90% proportion of pseudostem in the mixture is not advantageous because there was a reduction in energy consumption by only 9.87% in comparison with the use of pseudostem alone. On the other hand, at a concentration of 224.5 g/L, which represents a ratio of 10% pseudostem in the mixture, energy consumption reduction was 89.8% compared with the individual use of pseudostem.
The behavior observed in Fig. 3a is associated with the fact that pseudostem is more abundant from banana crop and could indicate that the best proportion between the pseudostem and rejected fruit is higher quantities of the pseudostem. However, it is important to remember that the rejected fruit does not require a concentration step. So, the relationship between energy requirements and sugar concentration should be analyzed.
Figure 3b shows that around the region of 100 g/L sugar in the pseudostem hydrolyzed broth, the amount of energy required by the process is reduced compared with the pseudostem alone. As demonstrated by the derivative values of sugar concentration ( Fig. 2b ), this may be considered an optimal value for the proportion of residues, presenting an integrated analysis of mass and energy for second-generation ethanol from banana residues.
It is possible to recommend a ratio of pseudostem in the mixture around 35% (65% rejected fruit). However, the disposal of rejected fruit is much lower than 65%; it is only 2.8%, compared to other banana wastes. 14 The mixture with rejected fruit and pseudostem may be interesting, since the rejected fruit does not require pretreatment processes involving energy demand. However, in this case, there is a need to obtain greater quantities of this waste than those currently available as waste biomass from the fruit, which requires storage.
Scenario 2: Mixture of Pseudostem and Peel
Scenario 2 was carried out simulating the mixing the pseudostem hydrolyzed broth and heated peel broth ( Fig. 1 ). These two streams were blended and then concentrated to 65 g/L of sugar (experimental value) to feed fermentation. Figure 4a shows the relationships of different quantities of pseudostem/peel with the sugar concentration resulted from the residue mixture (before the concentration step) and with the energy requirements.

Profiles of sugar concentration and energy process demand with different proportions of pseudostem/peel
It can be observed that the higher the proportion of the pseudostem in the mixture, the higher the energy process demand and the higher the amount of sugar in the broth before concentration. By inserting 10% of pseudostem in the mixture with the banana peel, energy demand increases by 71.7% compared to using the peel alone, and it decreases by about 77.5% compared with pseudostem alone. When the mixture is composed of 50% pseudostem, energy demand increases by 335.7% compared to the use of 100% peel, and it decreases by 42.8% compared to 100% pseudostem. However, for the use of peel alone, the amount of sugar available in the broth is 22% lower (50.8 g/L) compared with 100% pseudostem (65.8 g/L). Thus, the concentration of ethanol produced also will be altered, as demonstrated in Table 4 , where 16.9 g/L ethanol was obtained when using the banana peel alone—23.7% lower than with the use of pseudostem. That is, with the exclusive use of banana peel, the highest concentration of ethanol was not achieved. Hence, another residue had to be used. This is important because the results presented here confirm that the use of banana peel only can be advantageous concerning energy consumption, but not for production.
For the mixture of the peel with pseudostem, the results indicated a relation between sugar concentration and energy demand (subsequently produced as ethanol), which may be advantageous to the rate of 50%-50% residue mixtures. Figure 4b shows the derivative of the energy requirements in the process, and it can be observed that the minimum is achieved just around 50%-50%. However, the amount of waste discarded should be considered. Of 4 tons of all lignocellulosic waste that is generated in a banana harvest, only 11% is peel, while 75% is pseudostem. 14 Thus, for the use of clean technologies and to substitute raw material for lignocellulosic biomass from waste, it is necessary to increase the use of pseudostem once its availability from banana waste is much higher. Because of this, the mixture of the three residues was evaluated (in the same proportion as they are generated after harvest).
Scenario 3: Integration of the Three Residues
Figure 5 shows the results for required energy (kJ/h) and the concentration of ethanol formed (g/L) for the proposed mixture of the three residues (proportion in which they are discarded—84.8% pseudostem, 12.4% banana peel, and 2.8% rejected fruit). 14 These data are compared with the references cases, i.e., the use of pseudostem and peel alone. The rejected fruit was not included because it does not require pretreatment steps; therefore, it has little impact on the energy consumption process.
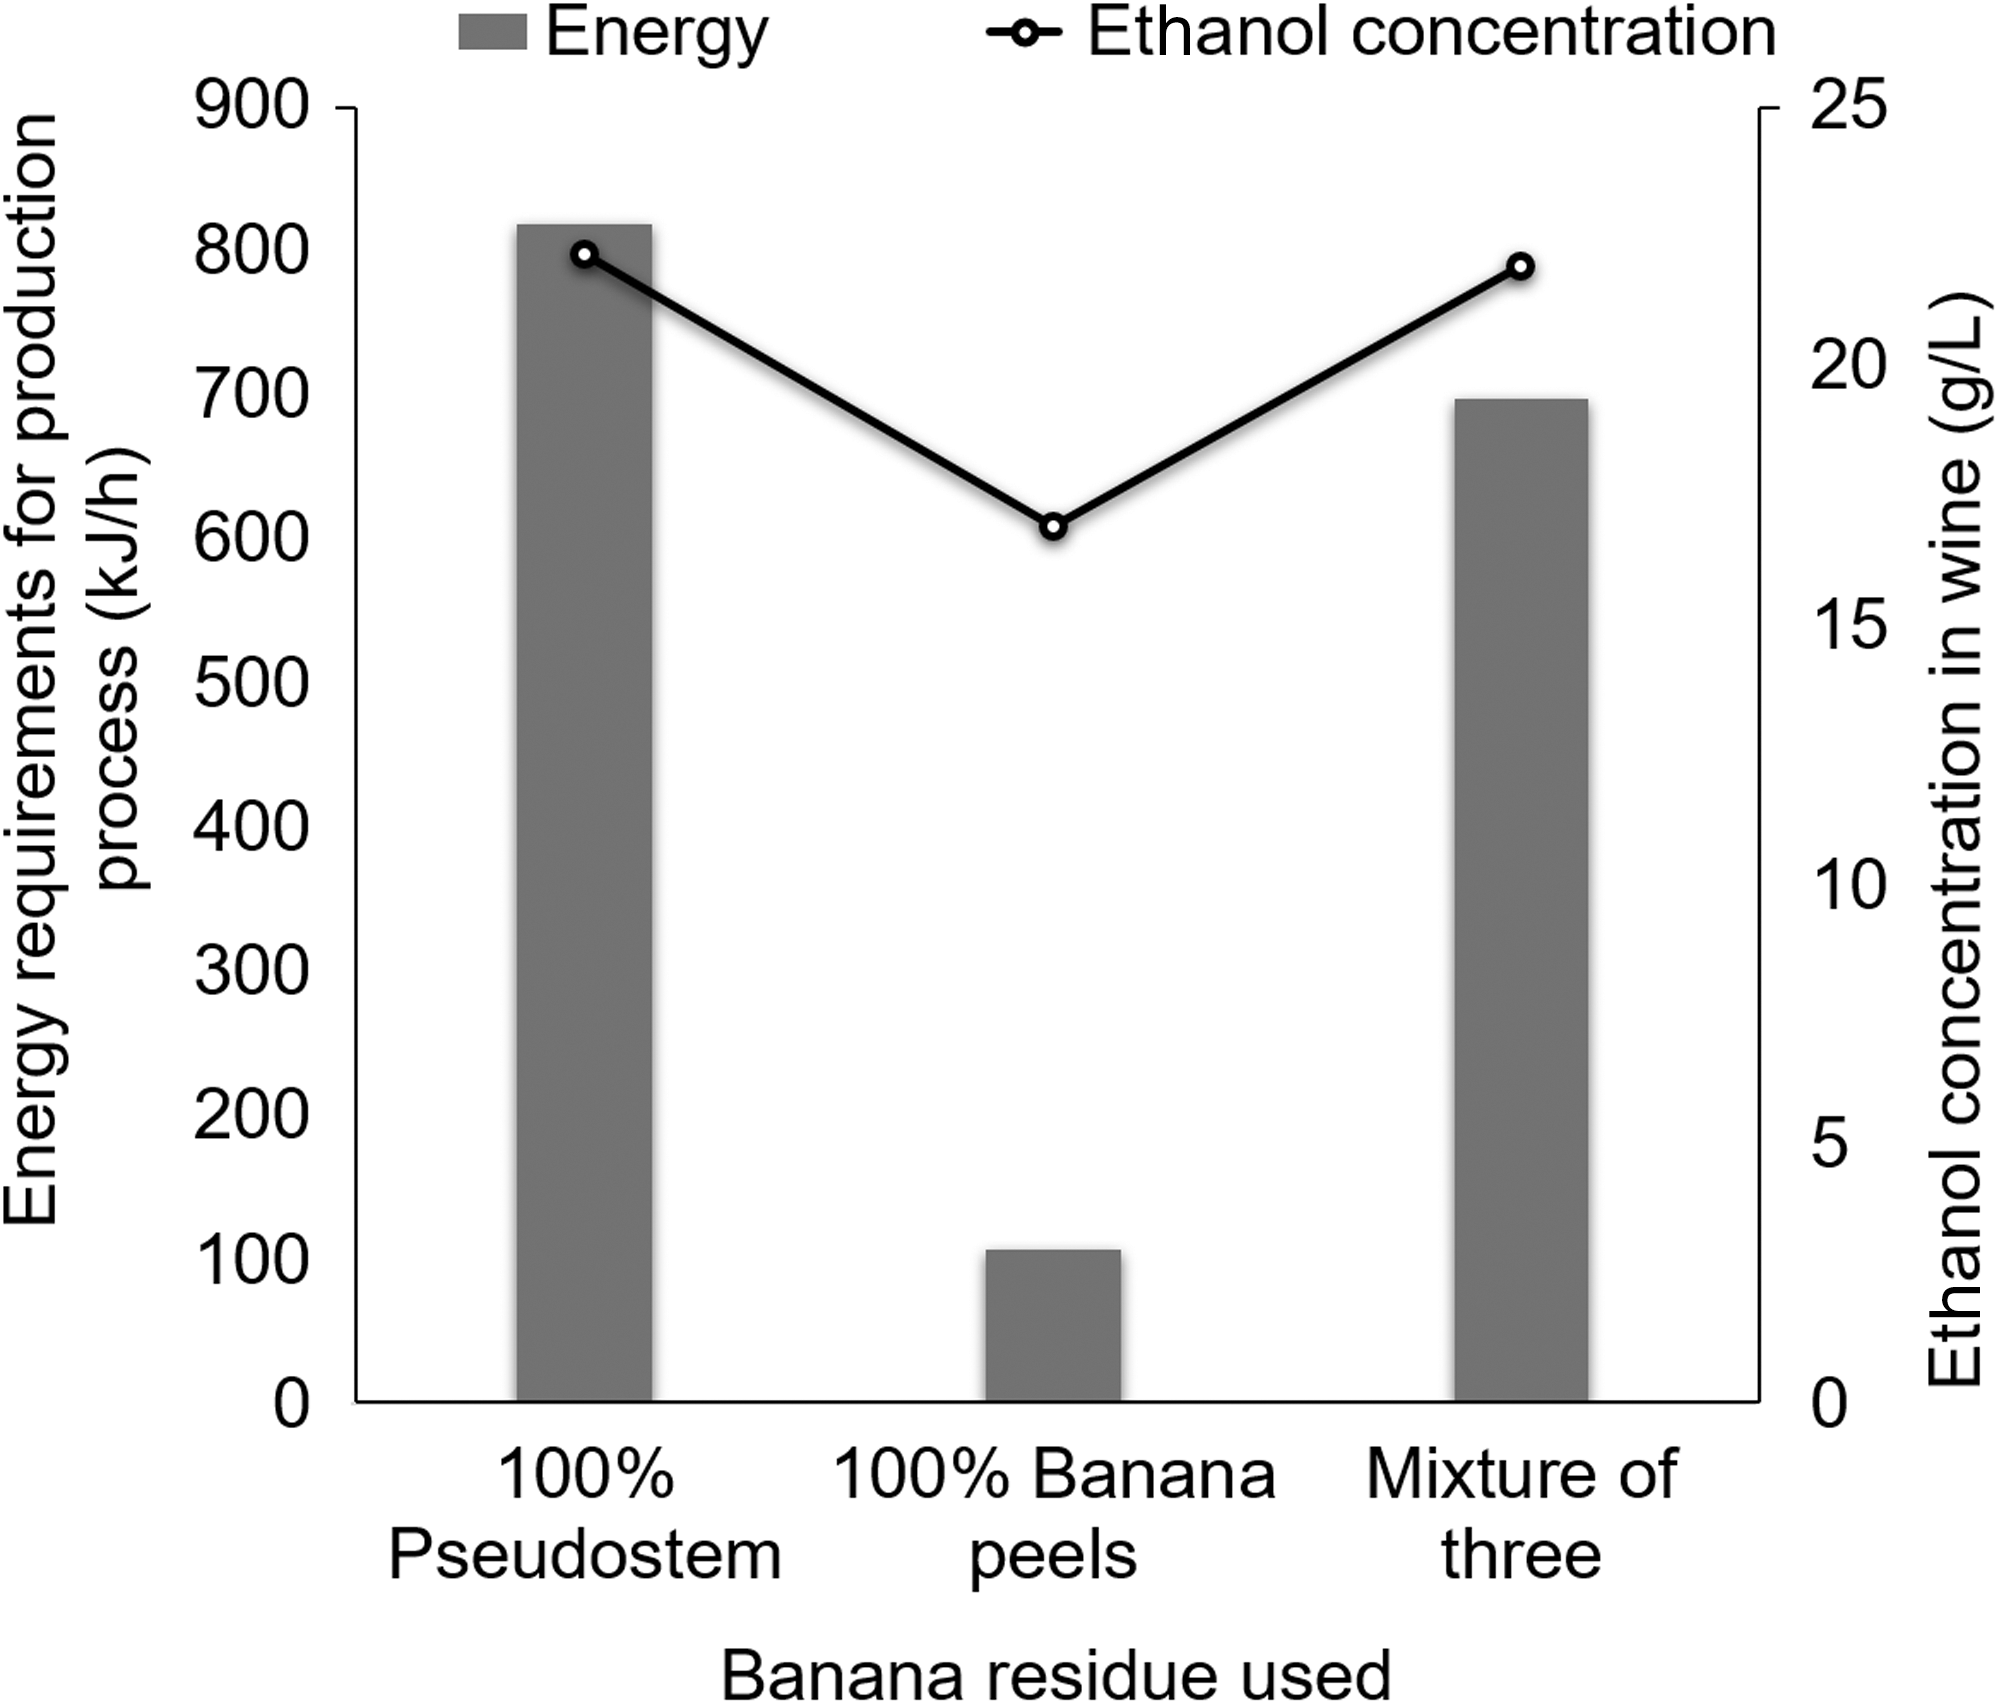
Energy requirements and ethanol concentration in wine of the proposed mixture with the three residues compared with the individual use of pseudostem or banana peel.
Comparing the ethanol concentration in wine, the mixture with three residues presented a value of 21.89 g/L—1.12% lower than the use of only pseudostem (22.14 g/L), but about 22.85% higher than the use of only peels (16,9 g/L) and 24% higher than the use of only rejected fruit (17.45 g/L, Table 4 ). Also, the concentration of ethanol produced (∼22 g/L) is similar when other biomasses are used: corn straw (20.9 g/L); 37 wheat straw (24.4 g/L); 38 rice straw (20.7 g/L); 39 and hardwood (17.7 g/L). 39 It is important to highlight that the use of a mixture of residues was not proposed in these cited studies and the use of a single kind of residue resulted in the values presented by the authors.
Another important result is that using the mixture of banana residues proposed in this study, the ethanol content in wine could be increased by about 18%. According to Dias et al., 20 biofuel production can be increased by 21% through the integration of sugarcane bagasse into the conventional process. In this work, process integration was performed without first-generation ethanol production, i.e., only integrating different production routes from banana residues and a similar increment was obtained.
The analysis of energy demand showed a decrease of 14.7% with the mixture when compared to the energy process required for 100% pseudostem. Regarding the banana peel, the energy consumption obtained for the proposed mixture was much higher, precisely because the mixture is composed of mostly pseudostem.
Considering that the pseudostem is the residue discarded in the higher amounts and the analysis integrated mass and energy, the use of three mixed wastes in crop proportion proved interesting.
Scenario 4: Thermal Integration Proposals of the Ethanol Production Process from the Mixture of the Three Residues
Targeting possible energy reductions, a simulation with flow rates increased by 1,000 times was carried out to analyze the thermal integration of the process. The software energy tool used points to the best among three options: (1) add surface areas to existing heat exchangers; (2) add new heat exchanger(s); or (3) relocate existing heat exchanger(s) to a new position(s). Results suggested adding new heat exchanger. Figure 6 shows the steps implemented in the reference case, and Fig. 7 shows the two different possibilities of energy integrations with the localization of the new heat exchanger added to these two integration proposals.
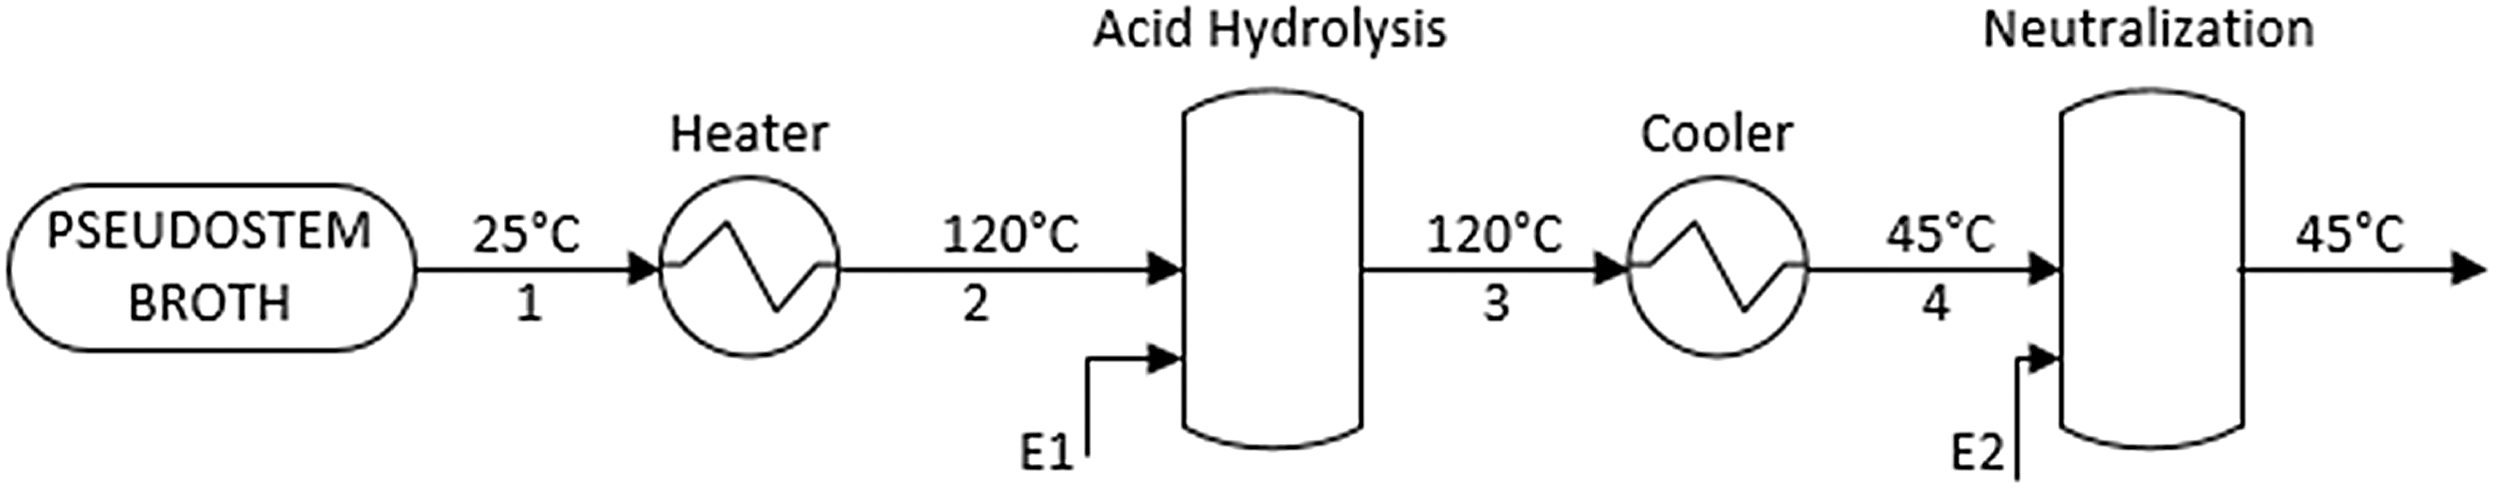
Schematic diagram of the base simulation (without integration).
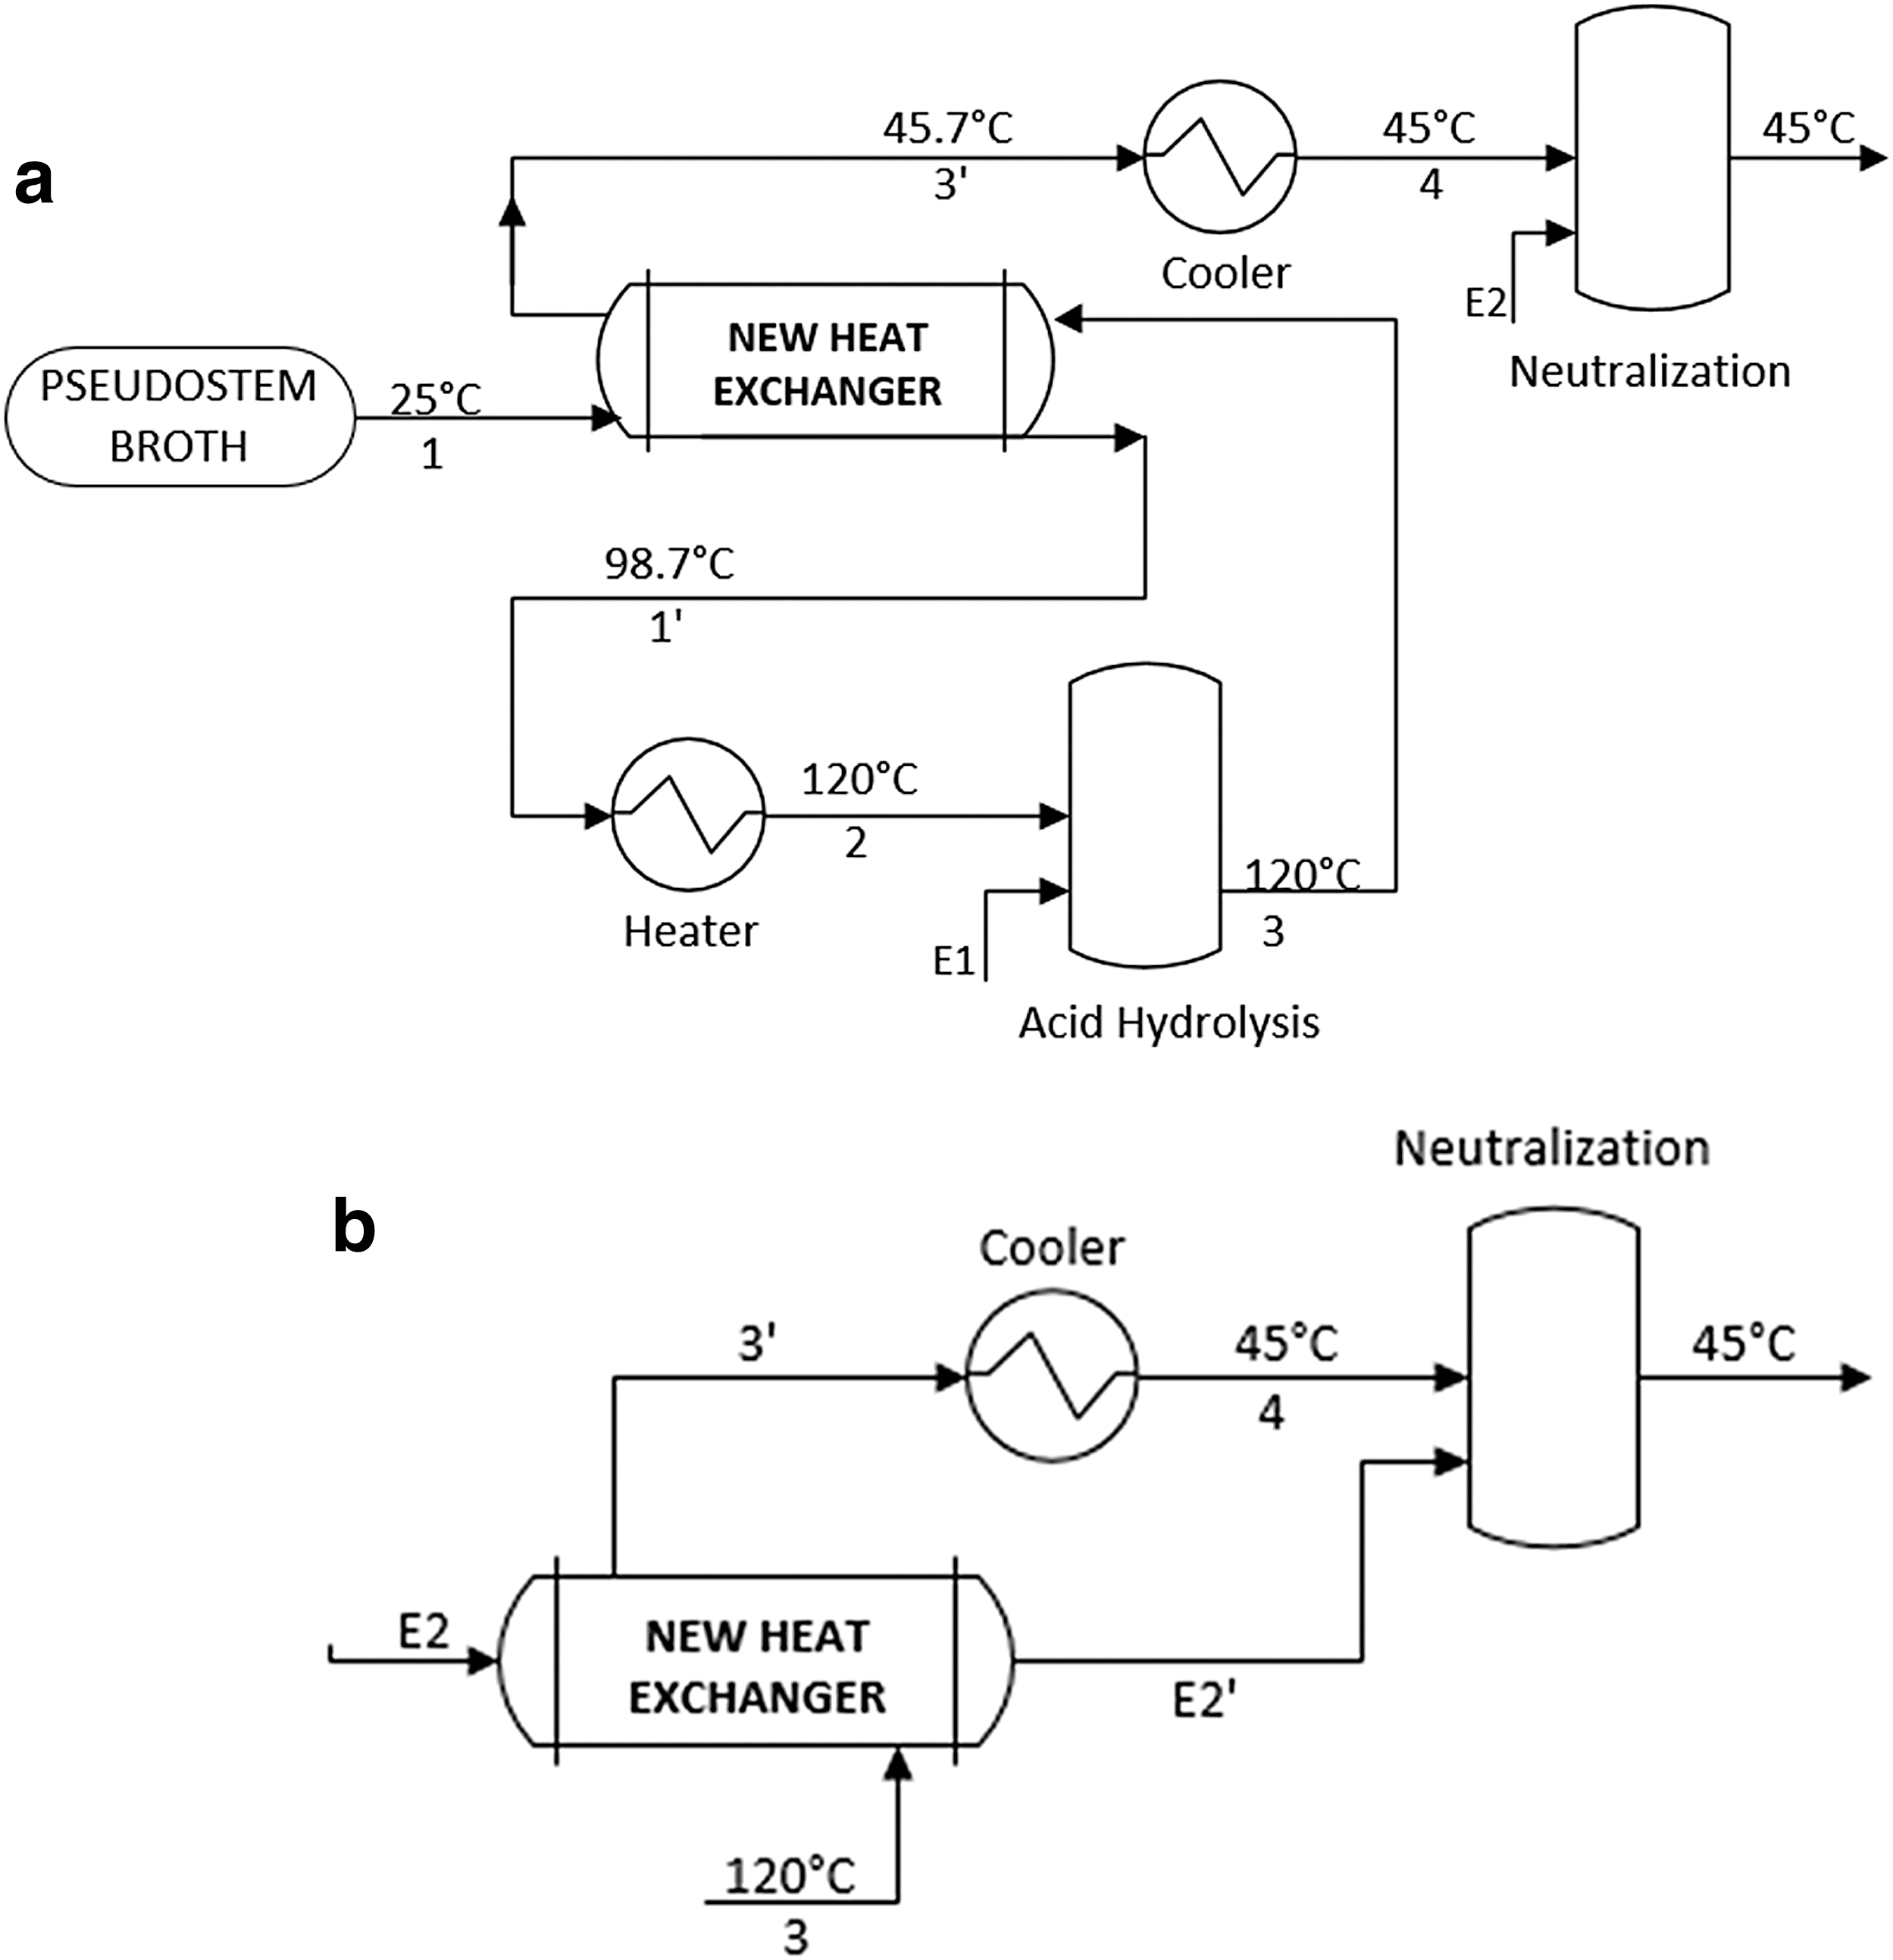
Localizations of the new heat exchanger added in integration proposals
For the first proposal ( Fig. 7a ), the new heat exchanger has the stream 1 as cold input of the base simulation, generating the output stream 1'; and stream 3 of the base simulation as a hot input, generating the output stream 3'. For proposal 2 ( Fig. 7b ), the new heat exchanger integrates streams 3 and E2 of the base simulation, generating streams 3' and E2', respectively. Stream E2 has the function of maintaining the temperature of the neutralization reactor.
Table 5 shows the main results comparing the base simulation case (simulation without integration) with the two proposals suggested.
Main Results Comparing the Base Simulation Case and the Proposals for Thermal Integration of the Process from the Mixture of the Three Residues
According to proposal 1, it is possible to reduce the process energy by 68.7% compared to the simulation case (without integration, Fig. 7 ), with energy demand of the hot utilities reduced from 6.97x10⁵ kJ/h to 3.27x10⁵ kJ/h and of cold utilities from 3.78x10⁵ kJ/h to 9.32x10³ kJ/h. According to proposal 2, energy can be reduced by 30.3% compared to the simulation without integration. The energy consumption of the hot utilities reduces from 6.97x10⁵ kJ/h to 5.34x10⁵ kJ/h and of the cold utilities from 3.78x10⁵ kJ/h to 2.15x10⁵ kJ/h.
In proposal 1, a new additional area of 2.42 m2 and four extra shells are needed to implement the new heat exchanger; however, there is short payback time, only 1.7 years. Although proposal 2 requires only one extra shell, this proposal presents a new area, bigger than proposal 1, and a payback time of 4.13 years. Moreover, proposal 2 requires slightly larger capital cost than proposal 1.
The purpose of bioenergy is usually to reduce greenhouse gas (GHG) emissions. For this reason, the carbon emissions (greenhouse gases) of the simulations with and without thermal integration were compared. In this study, the carbon emission calculated by simulator was considered only based on the energy flow for each utility of the process implemented in the simulator. In the first proposal, there is a reduction of 68.65% compared to the current simulation case, from 60.11 kg/h to 18.84 kg/h, while in the second proposal the reduction is only 30.3%, from 60.11 kg/h to 41.90 kg/h. For proposal 1 (lower carbon emission), after conversion of the value indicated in the simulation, a value of 56 gCO2/MJ was found. This result agrees with those obtained in other studies, such as with cassava (31.45 g CO2eq/MJ) 40 and sugarcane and cassava (26–39 g CO2eq/MJ) 41 and lower than gasoline (99 g CO2eq/MJ).
The first integration proposal is more attractive than the second since there is a greater reduction in energy consumption, better payback, and a major reduction in the emission of polluting gases.
Conclusions
This work demonstrated that the use of a mixture of banana residues for ethanol production is more advantageous when compared to using one alone. Most research proposes the use of a residue as an alternative in second-generation ethanol production, but does not study the whole production route, evaluating aspects such as sugar concentration and energy requirements. In addition to addressing these issues, this work showed the viability of using all potential lignocellulosic waste and indicated the best proportion to use in terms of mixtures of banana residues. A proportion of 35% pseudostem and 65% rejected fruit in the mixture is recommended. For the mixture of the peel with pseudostem, the results demonstrated a relationship between sugar concentration and energy demand, which may be advantageous to the rate of 50%-50% residue mixtures. However, in both proposals, the availability of the rejected fruit and peel is less than pseudostem. Hence, larger amounts of peel or rejected fruit should be accumulated to carry out the process, which means that much more pseudostem remained available as waste for use. Because of this, we recommend the integration of the three banana residues generated (at the same rate after harvest) as the most interesting proposal. This scenario also enabled a reduction of almost 15% in energy consumption in the ethanol production process, in a similar concentration to the use of the only pseudostem. Besides that, using a mixture of banana waste, the ethanol content in wine can be increased by about 18%.
This work also analyzed possible energy integrations to reduce the energy demand of the process and contribute to the search for the viability of the lignocellulosic ethanol. The analysis of the thermal integration proposals of the process using the mixture of the three residues (scenario 4) showed that the process energy demand could be reduced by up to 68.7% compared with the simulation case without integration, with a payback of only 1.7 years. Also, carbon emissions can be reduced by 68.65%, thus contributing to the reduction of pollution generated by industrial processes.
Finally, in addition to the presented results, more experimental studies, as well as the use of simulation, can be developed to consider questions such as the feasibility of biomass transport, obtaining higher concentrations of sugar in the concentrated broth, and analysis of life cycle costs, among others. It is also important to carry out analysis of the system efficiency, like the relation between the energy returned on the energy invested (ERoEI).
Footnotes
Acknowledgments
This study was financed in part by the Coordenação de Aperfeiçoamento de Pessoal de Nível Superior - Brasil (CAPES) Finance Code 001.
Author Disclosure Statement
No competing financial interests exist.