
Abstract
Nanotechnology presents one of the most promising solutions to developing and improving devices for detection and identification of semiochemicals. The present work reports the development of a novel nanostructured sensor with high sensitivity and limit of detection. Polyaniline (PANI) was used as a recognition layer for the trace level detection of methyl-2,6,10 trimethyltridecanoate sex pheromone. The sensitive layer was characterized by atomic force microscopy during each layer deposition and uniform films with nanoscale thickness (87 nm) and a granular morphology were observed. The nanostructured cantilever demonstrated good performance and ability to detect the semiochemical of brown stink bug, with wide linearity range and high detection limits of 1.44 fg/mL. Therefore, this work suggests a design for a highly sensitive cantilever-based nanosensor for the detection of the sex pheromone of the brown stink bug.
Introduction
The brown stink bug, Euschistus heros, is among the most damaging pests to soybean crops, interfering directly in the quality and yield of the grains during formation and causing lower productivity, oil content, and seed vigor. 1 Stink bugs play an important role in several pathways in the environment through communication and release of pheromones. The bugs depend on the sense of smell to perform its behavioral functions, such as a definition of oviposition places, breeding, prey location and defense. 2–3 The chemical used in the communication is called semiochemical, and the pheromone is included in the intraspecific communication. Sex pheromones, chemical signals produced by one insect sex for attracting the opposite sex, are emitted at very low concentrations. 4–5 The E. heros females are attracted mainly by methyl 2,6,10-trimethyltridecanoate, a volatile substance in the order of nanograms or picograms that is thermally unstable and difficult to extract and detect. 6
New sensors could achieve practical applications related to olfactory systems of insects. Nanosensor devices are essential for practical applications, and for that, many olfactory systems of insects have already been studied, including flies, mosquitoes, butterflies and beetles. 7 To date, there have been no studies related to sensors to monitor E. heros pheromone. Among the sensors, a cantilever can be used to detect volatile compounds released by insects with extreme sensitivity and higher detection limit. A cantilever change the vibrational frequency or deflection due to the adsorption of molecules on the surface, making it an excellent transducer and suitable for use as a chemical sensor. 8–9 Nanosensors have advantages, such as simple operation, low cost, fast response times and minimum sample pretreatment. 10–11 However, the performance limit can be influenced by the thermal conditions in the field and limited noise.
The use of Atomic Force Microscopy (AFM) cantilevers for detection of physicochemical phenomena depends on the sensitive layer. Conductive polymers, such as polyaniline (PANI), are suitable materials because of their ability to detect volatile molecules, ease of polymerization, low cost, and stability under environmental conditions experienced in the agricultural field. 12–13 Detection of volatile molecules by the PANI film can occur by chemical bonding, adsorption, hydrogen bonding and van der Waals force. 12 In addition, PANI can undergo numerous physical and electronic phenomena upon exposure to an analyte, causing changes in the polymer matrix and in the material resistance, which are converted into detectable electrical and/or mechanical signals. 14 The properties can be changed depending on what the polymer layer absorbs, influencing the sensor selectivity to specific analytes. 12
Until this date, no cantilever-based nanosensor has been developed for detection of methyl-2,6,10 trimethyltridecanoate sex pheromone of brown stink bug E. heros. Therefore, this study makes a major contribution to research on sensitive recognition of volatile semiochemicals that can be applied to agricultural management.
Material and Methods
Interfacial Synthesis of the Polyaniline
The polyaniline (PANI) was obtained by the interfacial technique, the chemical oxidative polymerization of aniline in the presence of ammonium persulfate. The oxidant (ammonium persulfate, 98%, Sigma-Aldrich, St. Louis, MO) was dissolved in 1 mol/L of hydrochloric acid (HCl, 99%, Merck, Kenilworth, NJ). The aniline (99.5%, Sigma Aldrich) was dissolved in dichloromethane (99.5%, Synth, Diadema, Brazil) in a ratio 1:2 (v/v). Next, this solution was placed slowly into a round bottom flask (protected from light) containing the aqueous solution. The reaction was maintained at room temperature (25°C) for 2 h. After the chemical reaction was completed, the reaction product was filtered (filter paper, 25 μm, Millipore, Burlington, MA) and washed three times with methanol and Milli-Q water. The filtrate was dried in a desiccator under vacuum for 20 h, obtaining the PANI powder in the oxidate emeraldine state. The powder (10 mg) was diluted in N,N dimethylacetamide (1 mL, 99%, Merck) and maintained in ultrasound bath equipment (Unique model USC-1800) for 1 h. Following this, HCl solution was added in the dilution until it reached pH 3.0. The final dilution was homogenized with a magnetic stirrer overnight. 15
Cantilever Functionalization with PANI
The cantilever used in this work was made of silicon (Budget Sensors®, Switzerland), with Young's modulus of E = 1.3x10¹¹ N/m2, in the <100> plane of its crystal structure, 13 ± 4kHz, 2 N/m spring constant, 450 μm length, 50 μm width, and 2 μm thickness, coated with 30 nm of aluminum (reflective layer). Before the functionalization, the cantilever surface was washed with isopropyl alcohol for 2 min, then dried at room temperature (25°C) for 30 min.
The deposition of the sensitive layer of PANI was performed by the self-assembly technique (LbL), according to the methodology of Raposo et al., 16 with adaptations. The modifications were in the number of bilayers and residence time, and both parameters were based on adsorption kinetics studies performed by Manzoli et al. 17 and Silva et al. 18 The deposition was alternated with polymers of opposite charges of the polyanion (polystyrene sulfonate–PSS solution) and polycation (PANI solution), on both sides of the cantilever (upper and lower surface). The PSS solution (Sigma Aldrich) was prepared using 5 mg PSS diluted in HCl solution (1 mol/L) at pH 3, concentration of 0.5 mg/mL.
The PANI/PSS bilayers were obtained by immersing the cantilever surface on the polyanion solution (1 mL) for 3 min, followed by washing with HCl pH 3.0 for 1 min and drying for 15 min at 25°C. Next, the cantilever surface was immersed on a polycation solution (1 mL) under the same conditions. This process was repeated until the formation of seven bilayers. For each bilayer, a new solution of polyanion or polycation was used.
Characterization Techniques
The chemical composition and molecular orientation of the deposited film on the cantilever surface were investigated by polarization modulation-infrared reflection absorption spectroscopy (PM-IRRAS) using a spectrophotometer (model PMI 550, KSV Instruments, Helsinki, Finland), with 8 cm−1 spectral resolution and 8° incidence angle. To evaluate the films in relation to doped state and growth, the characteristic absorption bands were obtained using a UV-Vis spectrophotometer (model 8453E, Agilent, Santa Clara, CA). The PANI powder structure was investigated using a diffractometer (Mini flex II, Rigaku, Tokyo, Japan), operated at conventional geometry 2θ, with analysis angle ranging from 1.35 to 90°. The wettability of the PANI film represented by the contact angle were obtained in a KSV instrument by the deposition of a drop of ultrapure water (surface tension of 72.7 mJ/m2) over the cantilever surface.
PANI films after deposition of the 1st, 3rd, 5th and 7th bilayers were evaluated in relation to the morphology, roughness and thickness by atomic force microscopy (AFM, Nanosurf, Liestal, Switzerland). A pyramidal silicon nitride tip attached to a cantilever with a spring constant of 42 N/m was used to obtain the images in tapping mode at a scan rate of 1 Hz. The topographical images were processed, and the thickness was calculated with Gwydion 2.1 data analysis software (Version 2.18).
Measurement of Mass Deposition
The mass deposition of the film in each bilayer (1st, 2nd, 3rd, 4th, 5th, 6th, and 7th) was evaluated measuring the resonance frequency using AFM (Nanosurf). The mass deposited in each bilayer was calculated according to the
Equation 1
. To perform the measurements, the cantilever was coupled in a canticlipe and attached to the piezoelectric scanner, which was aligned with the laser and the signal strength measured. At each deposited bilayer, the resonance frequency measurement was always performed in triplicate in dynamic mode.
where, K is the spring constant, f1 is the final frequency and of the cantilever, f0 is the initial frequency of the cantilever, and n is a constant that depends on the cantilever used (0.24 for rectangular cantilever). 19
The changes in cantilever stiffness (defined by Kloaded) were evaluated after the deposition of each bilayer. Kloaded was calculated according to
Equation 2:
where, fn is the frequency after each functionalization step, f0n is the initial frequency before functionalization, ma is the mass added on the cantilever after each functionalization step, mc is the initial cantilever mass and K0 is the spring constant.
Response of the PANI Cantilever Sensor to the Pheromone
The main component used to perform the tests was the methyl 2,6,10-trimethyltridecanoate compound donated by Embrapa Genetic Resources and Biotechnology (Brasília-DF, Brazil). The compound present in the sex pheromone has a density of 0.9 ± 0.1 g/cm3 and a molecular mass of 270 g/mol. The responses of PANI cantilever sensor at different concentrations (0.005, 0.01, 0.05, 0.1, 0.2, and 0.3 μg/mL) of pheromone were investigated. The dilutions of the pheromone were performed with n-hexane solvent (99.5%, Sigma Aldrich). This solvent was employed because it does not attract the bugs, and would not interfere with future use in the field. 20
The cantilever sensor was placed in a canticlipe and embedded in the head of the piezoelectric scanner. The gas chamber (6.38 cm3) was then placed in the scanner head and sealed with a rubber ring. The laser signal was adjusted, and the cantilever sensor resonance frequency was evaluated in the presence of different concentrations of the pheromone and in its absence (blank). Also, a cantilever without functionalization (uncoated) was evaluated. In all experiments, the temperature was controlled and monitored through a controller module (Nanosurf), and relative humidity inside the chamber was monitored with a commercial sensor (Sensirium Kit EK-H5, resolution SHT2x). From these data, a calibration curve as well as sensitivity and detection limit data were obtained.
Results and Discussion
Characterization of PANI
The absorption bands characteristic of PANI was evaluated using the XRD technique (Fig. 1). The peaks at 9, 15, 21 and 25°, whose positions at 2θ were observed, is typical of PANI in the doped state. The presence of these peaks is related to the crystallinity of the sample, as well as the peak at 19°. 8,22 The X-ray diffractogram also showed a peak at 6.5° that can be characteristic of the presence of PANI nanofibers in their structure 8 and also the formation of highly crystalline material. 22 The peaks at 21° and 25° represent the perpendicular and parallel periodicity of the chains. 23 In the present study, PANI was doped with HCl acid, which presented slightly displaced peaks (21.35° and 25.85°). These small variations in peak position may occur by dopant type, different degrees of doping, sample preparation and size of the polymer particle.
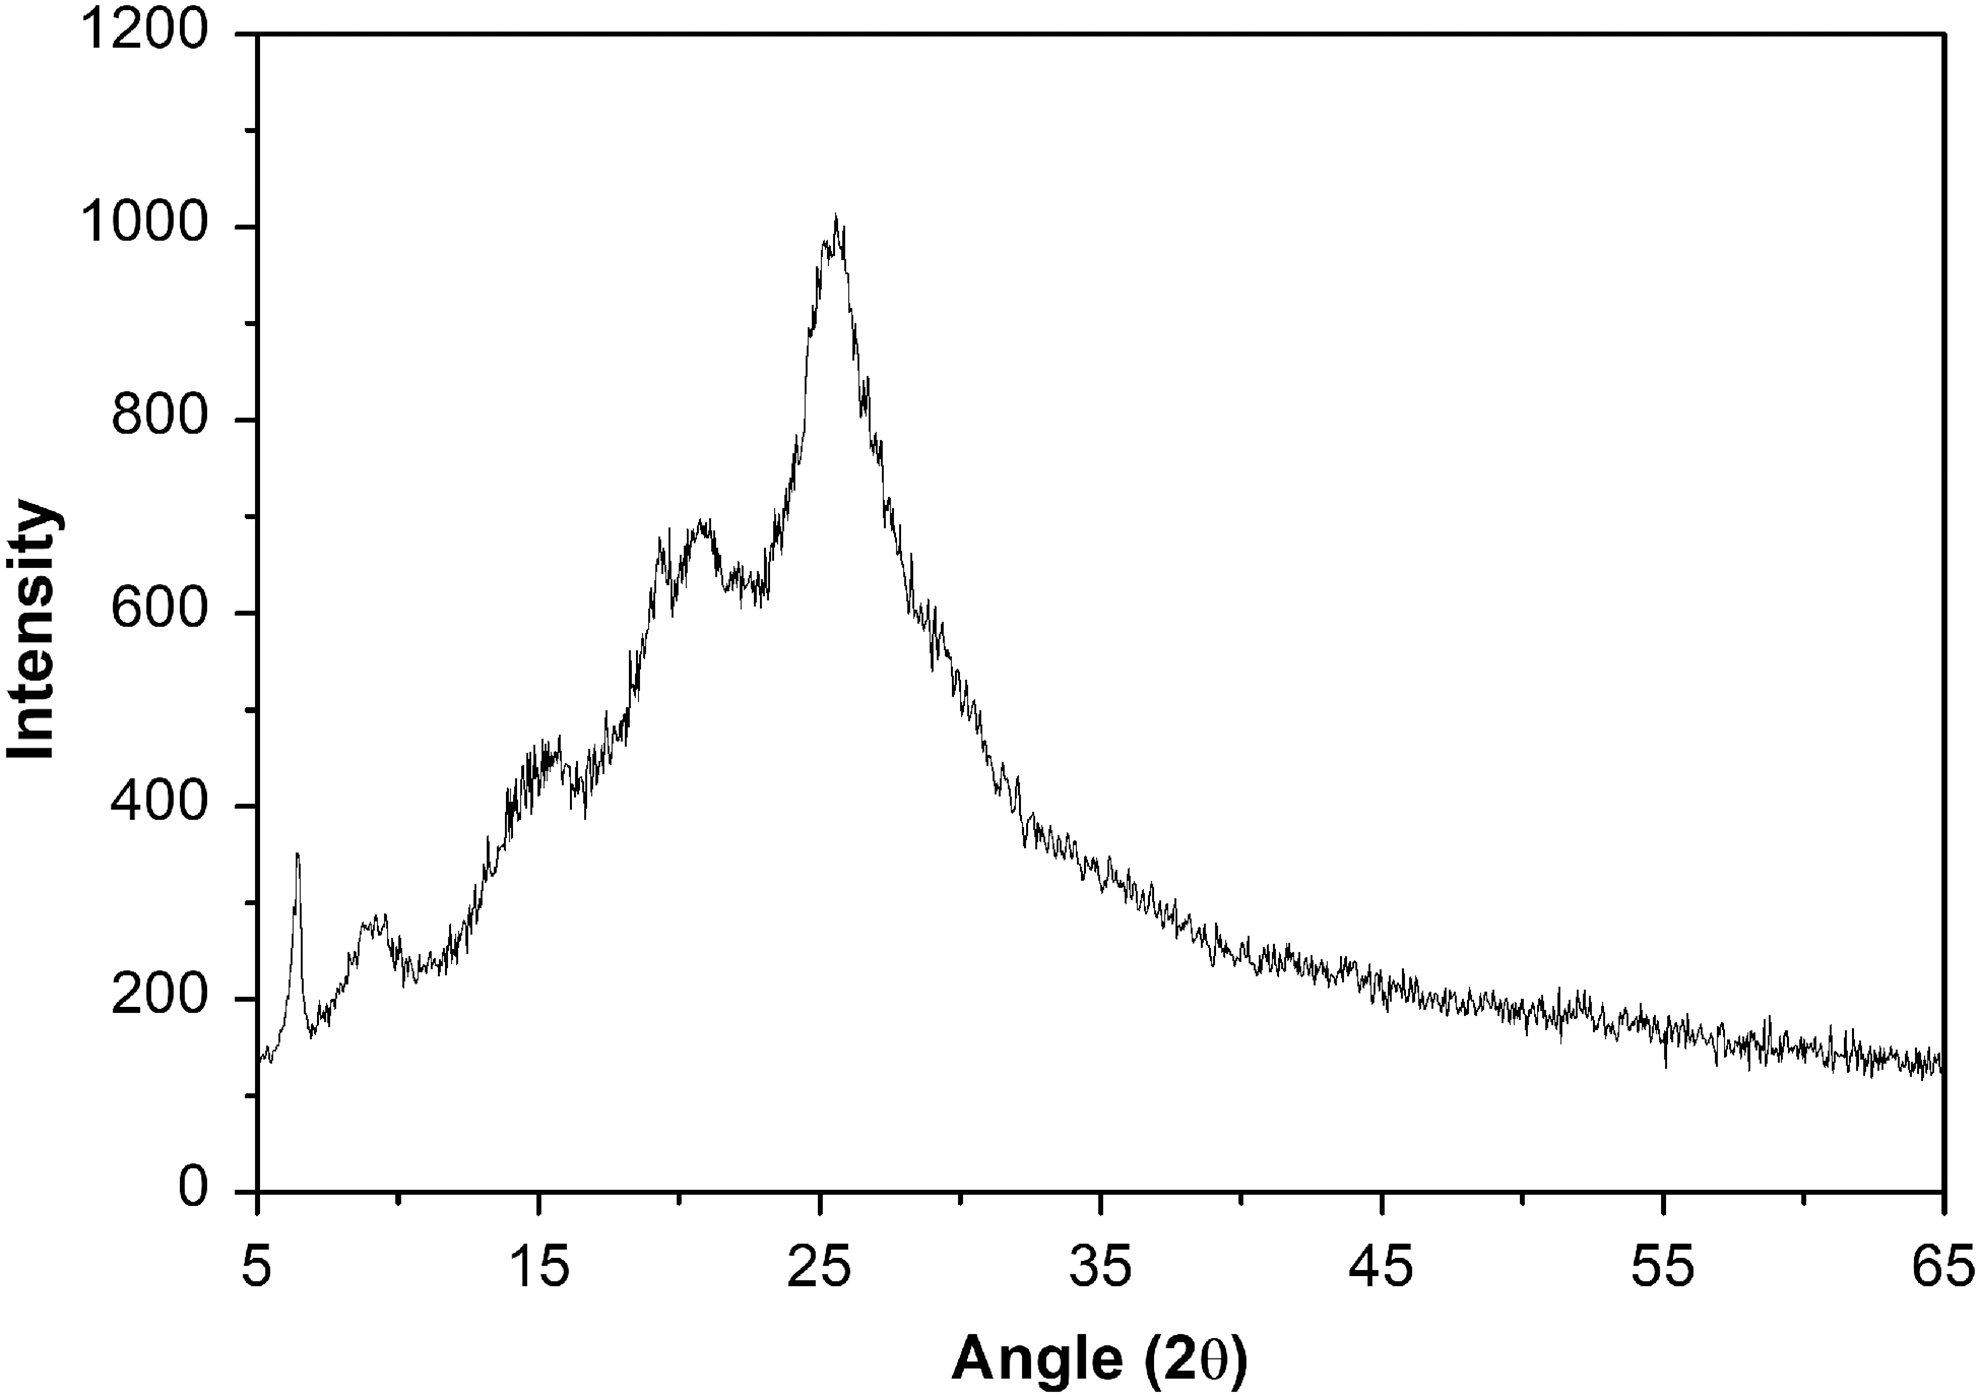
X-ray diffraction of PANI doped HCl obtained by interfacial synthesis.
The deposition, growth, and uniformity of PANI were monitored by UV-Vis spectroscopy, in each bilayer (1st–7th). The absorption spectrum of the PANI/PSS films up to the 7th bilayer is shown in Fig. 2a, with an emphasis on the absorption peak at 241 nm (Fig. 2b). This peak is characteristic of the aromatic rings of the PANI and PSS. 24 A linear absorbance was observed with the number of deposited bilayers (R 2 = 0.99), indicating that each bilayer contributed a similar amount of material during film deposition.
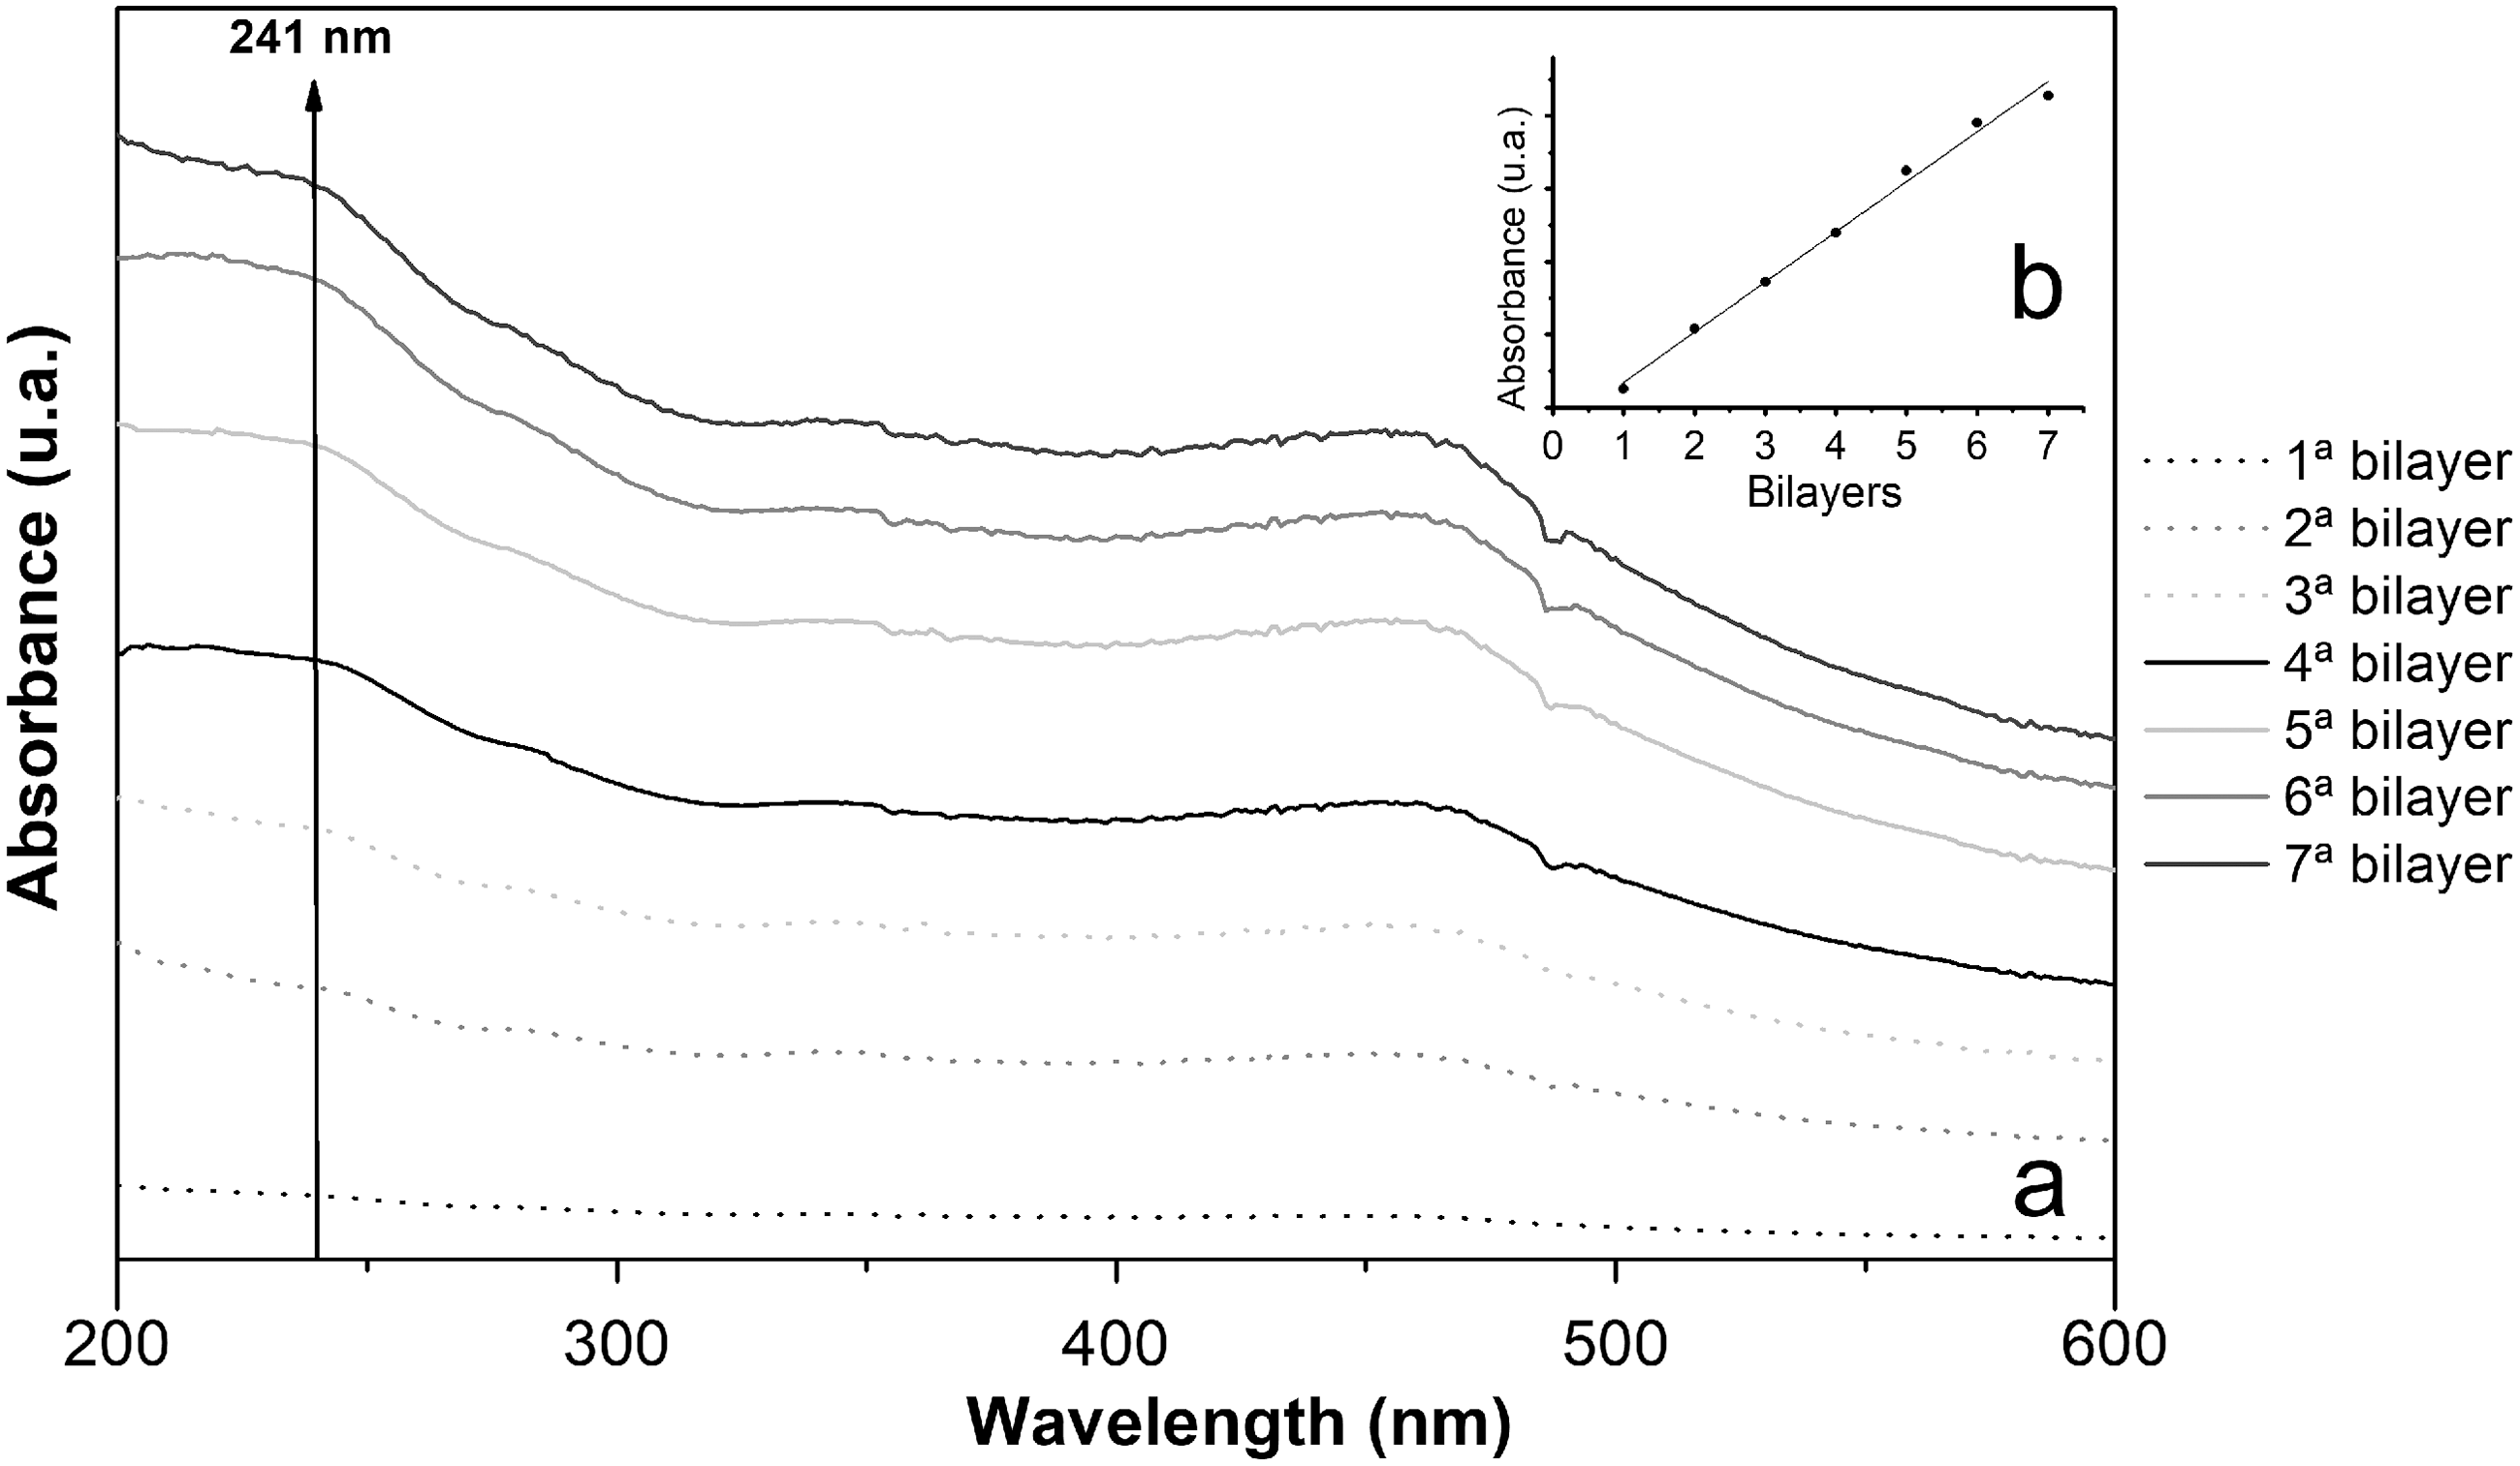
UV-Vis absorption spectrum of PANI film
The absorption spectra showed a small band at 340 nm, which is associated with the transition of the electron from the binding orbital (π) related to the benzoic and quinoid rings of the PANI chain. 25 Also, the band at 470 nm is due to the transition of the anti-ligand electron (π *) to the polaron band. 26 The more intensive absorption of PANI with each bilayer deposited indicates the formation of a more compact and regular microstructure. 27
Figure 3 shows the PM-IRRAS spectra of the PANI/PSS films after deposition of the 7th bilayer, with absorption bands at 1,145 cm−1, 2,307 cm−1, and 3,699 cm−1. The absorption band at 1,145 cm−1 is related to the CH bonds of the aromatic ring and indicates the conducting protonated process. The characteristic band of the emeraldine salt at 3,699 cm−1 can be attributed to the NH stretching mode, where for PANI in the doped state is associated with high electrical conductivity. 28 The absorption band at 2,307 cm−1 can be attributed to the presence of the PSS and is related to the C-N axial deformation band of the semi-quinoid ring, demonstrating the interaction of the quinonic groups with the sulphonic groups of PSS. 29 The presence of bands at 1,145 cm−1, 2307 cm−1, and 3699 cm−1 indicate that the functionalization on the cantilever surface by the LbL technique with PANI/PSS was effective.
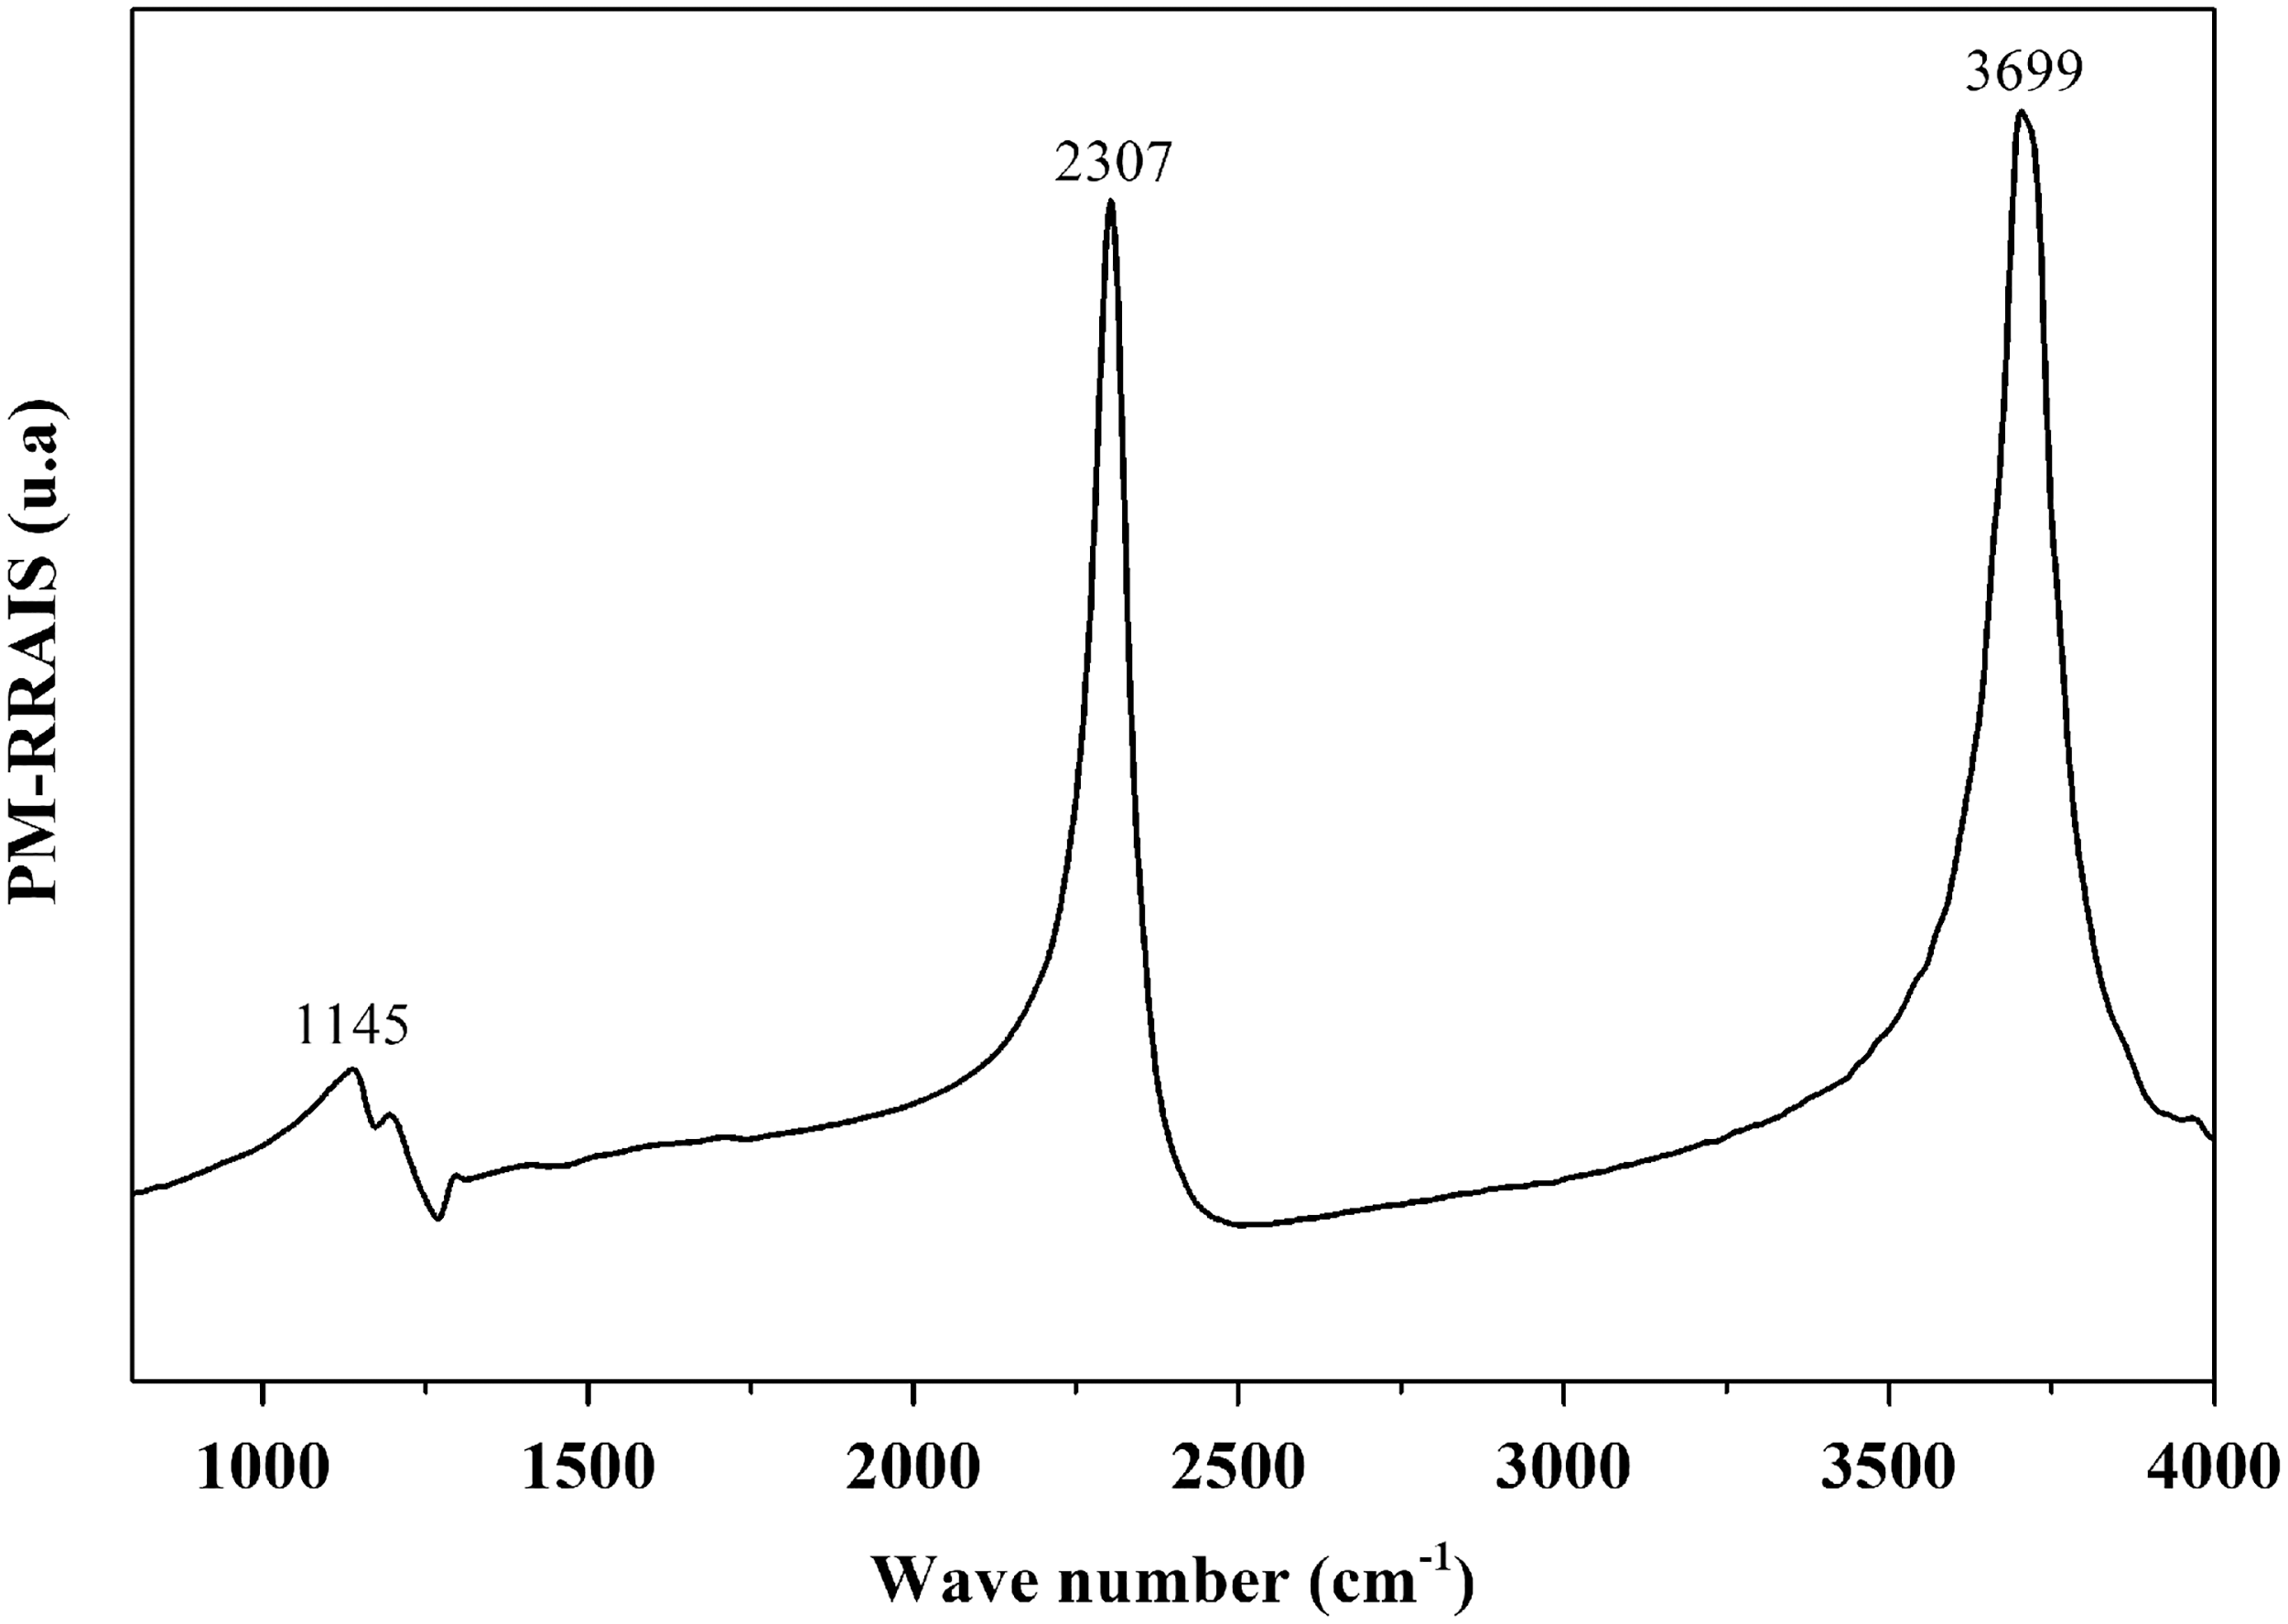
PM-IRRAS spectra of the PANI film deposited on the cantilever surface.
Figure 4 presents the 3D AFM topographic images of the surfaces after the deposition of the 1st, 3rd, 5th and 7th PANI/PSS bilayer by LbL technique. In the first bilayer, an irregularly-shaped nanoparticulate is perceived with distribution in all surfaces. It can be observed that, with increasing the bilayers, more nanoparticulates are deposited due to the nucleation with nanostructures typical of PANI that tend to form clusters (sites with lighter color intensity), and linear chains indicate the deposition of PANI in each bilayer. The morphology of the films strongly influences the performance of the sensors, since changes in the area/volume of the polymer surface can alter the sensitivity and the response time of the sensors.
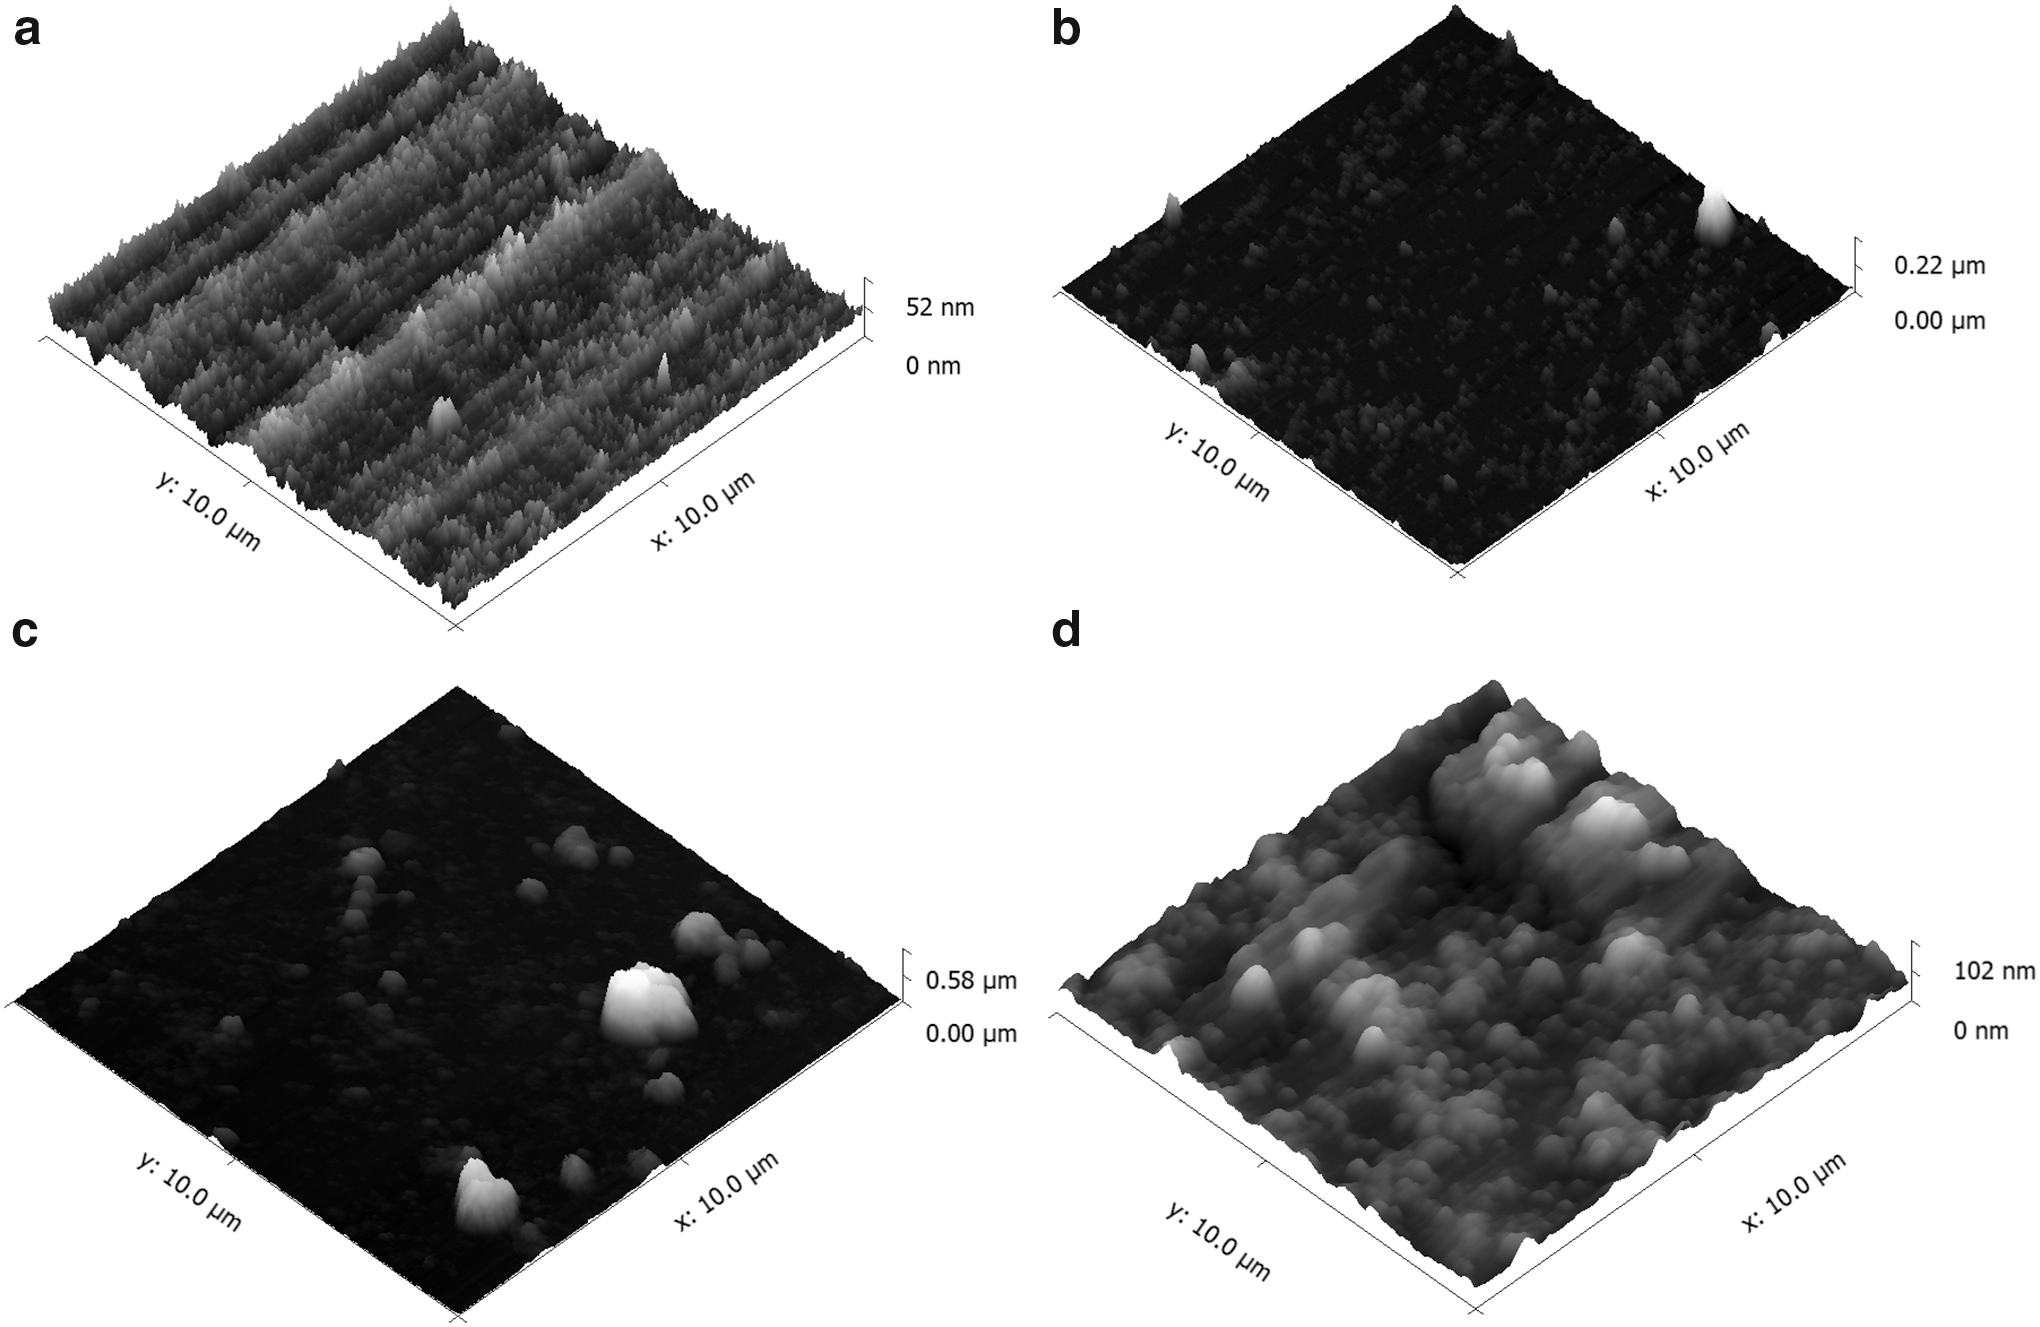
AFM 3D images of PANI film obtained after the deposition of
The thickness of the deposited film was obtained by the topographic image in the interface between the PANI film and silicon surface, carried out after the deposition of the seventh bilayer. The sensing layer presented a thickness of 87 nm; a nanoscale film with molecular architecture is crucial to achieving high sensitivity to an analyte due to large surface area.
The hydrophobicity of the film was examined by the water contact angle (°) on the uncoated and coated cantilever surfaces. The contact angle value was 80.01° for the uncoated cantilever surface, while the cantilever with PANI/PSS film presented a contact angle of 121.19° (Fig. 5). The change in the wettability with the film deposition indicates that the surface was modified, and the thin film has a hydrophobic characteristic.
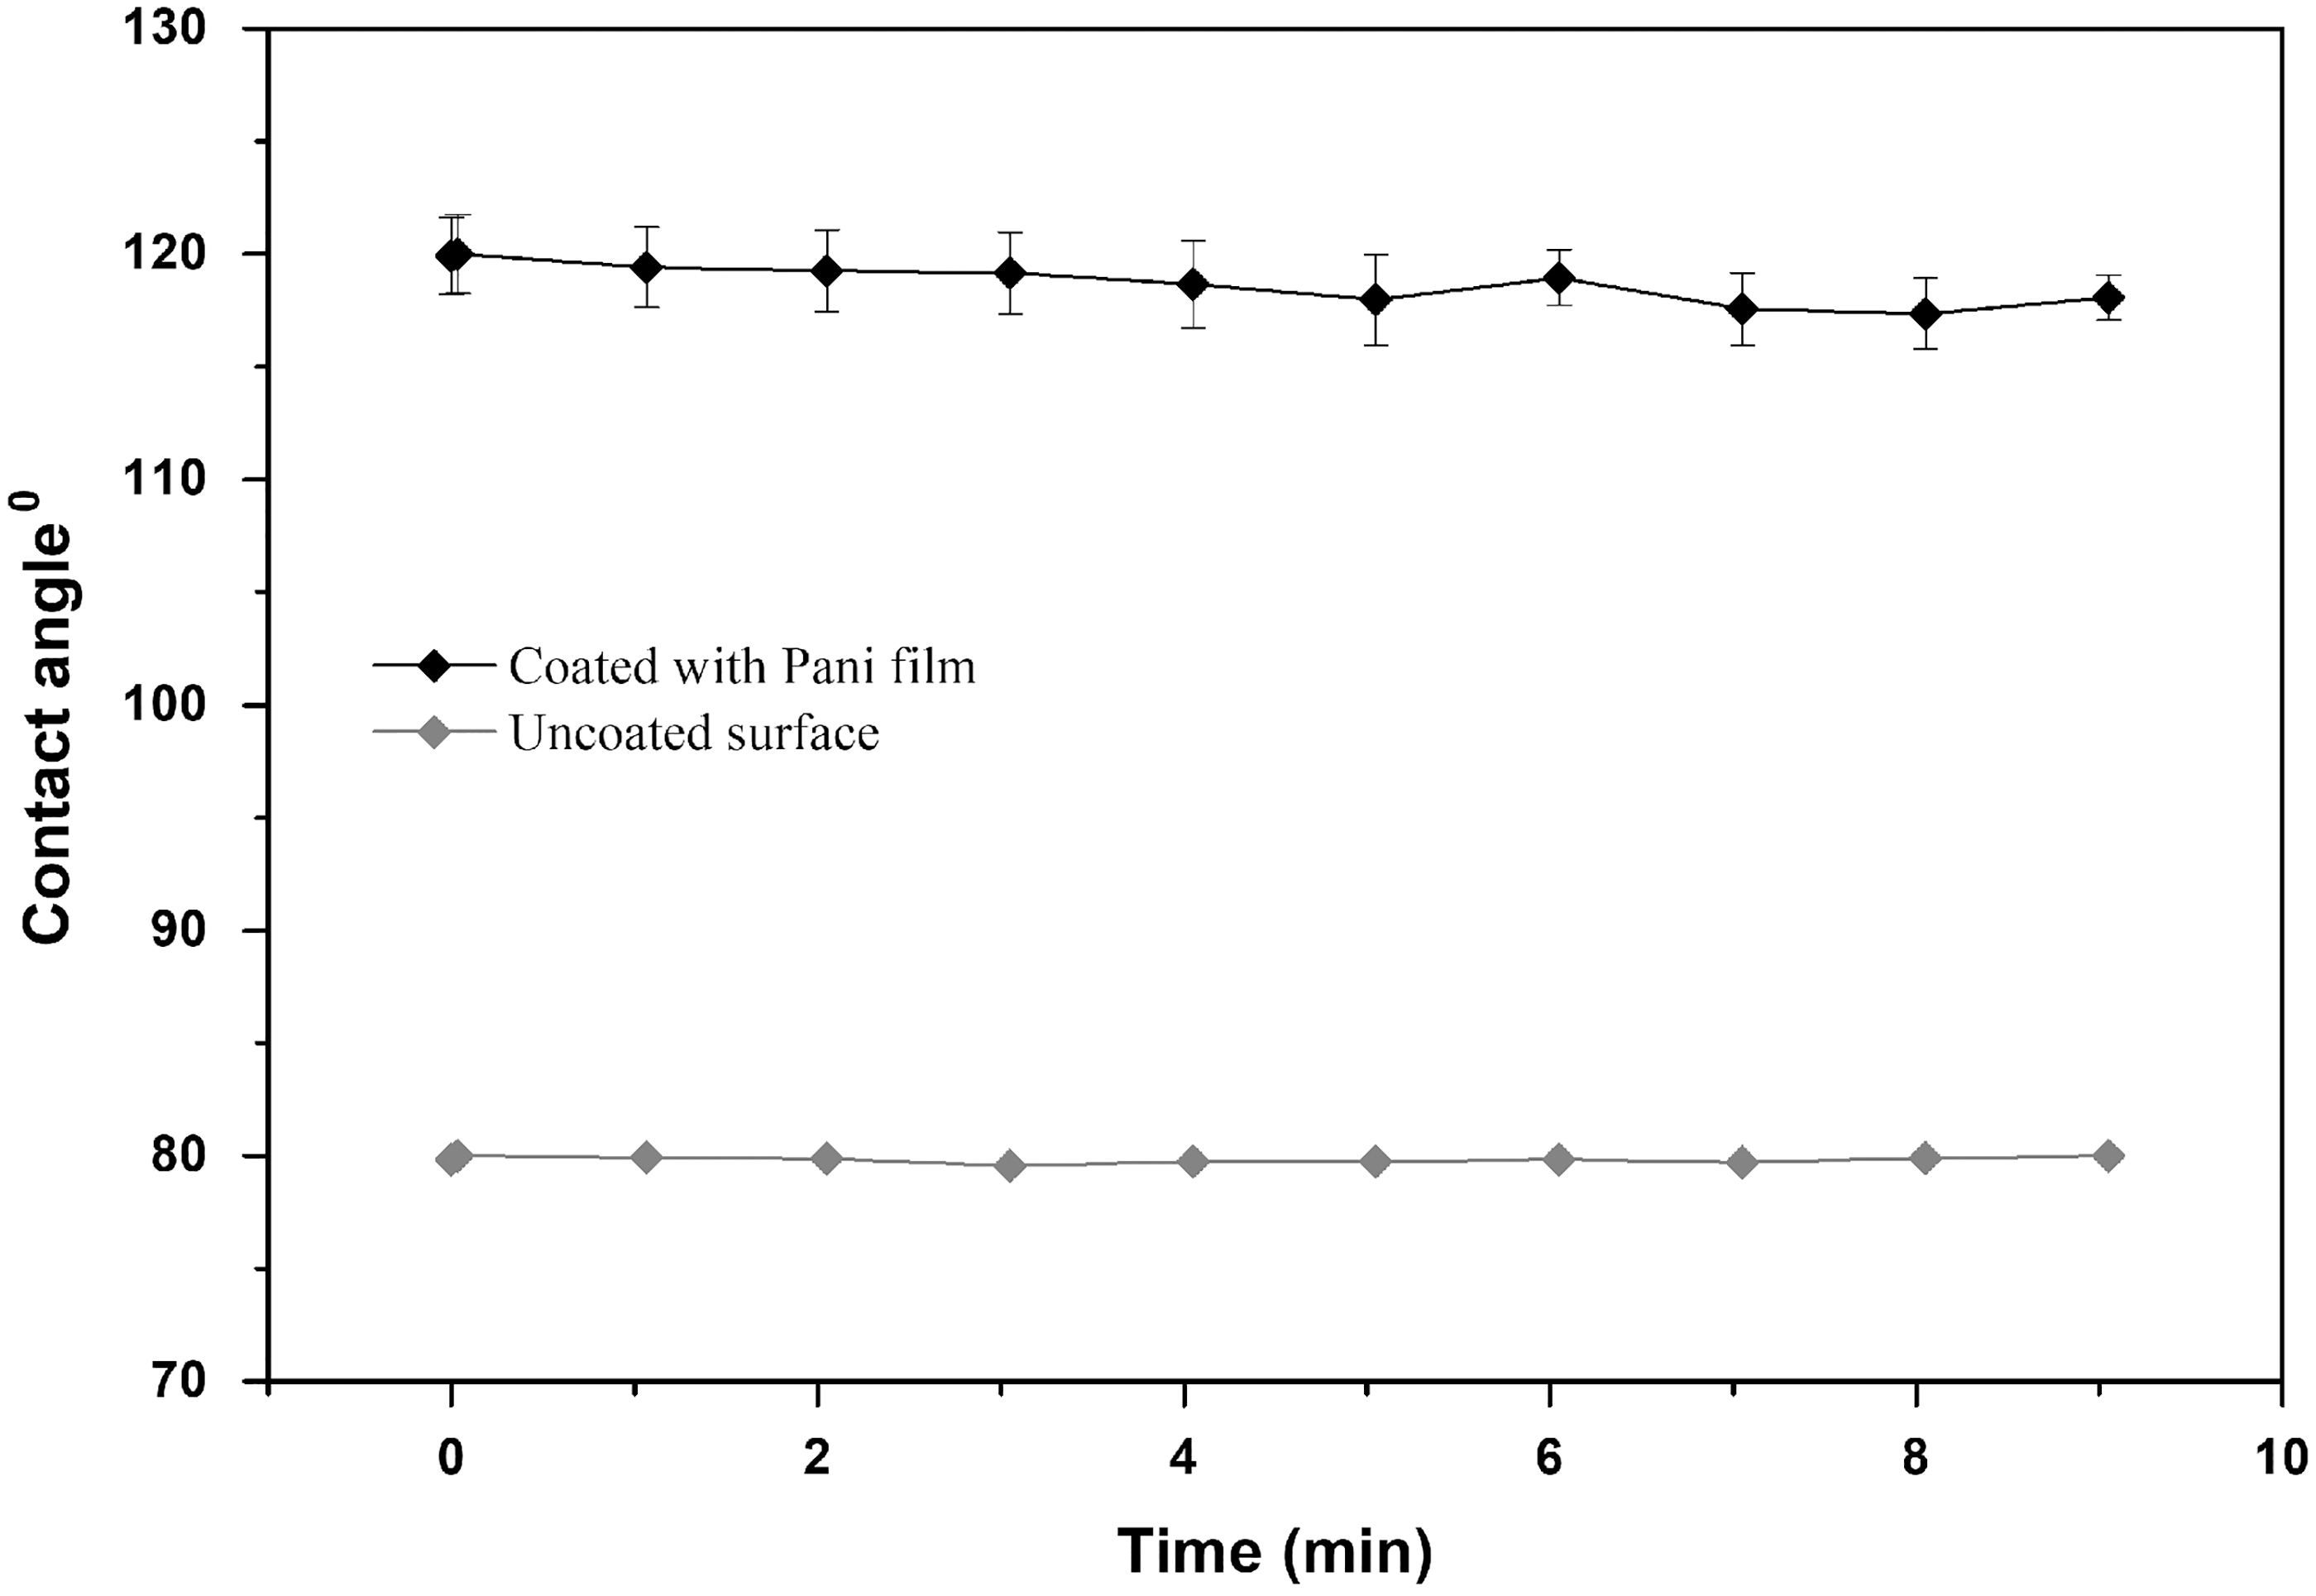
Static water contact angle on the silicon cantilever (uncoated surface) and with PANI film (coated surface).
Generally, PANI in its doped state is hydrophilic, as observed by Steffens et al. 8 in PANI film doped with HCl, deposited on silicon cantilever by the spin-coating technique and with a contact angle of 53°. In the present study, the LbL technique was deployed to deposit alternately the film (physical adsorption of an oppositely charged layer of the polyanion-PSS and polycation-PANI) that resulted in hydrophobic layers. According to Fujimoto et al. 30 , the deposition of PANI film with anionic copolymers depends on each deposited bilayer, which decreases the charge density of PANI and reduces its solubility. In this way, functionalization with self- assembled layers, as with LbL, each layer added affects the film's hydrophobicity, causing reorganization and interpenetration of the components. 31 Also, the surface roughness and low surface energy contribute to form a hydrophobic film and help to develop devices with modulated wettability. 32 In this way, the PANI film deposited on the cantilever surface can be very useful in humid conditions due to enhanced barrier ability and the ability to maintain it doped state for a longer time. 33
Mass deposition on the cantilever surface during functionalization was monitored in each bilayer by resonance frequency measurement (Fig. 6). The sensor showed a gradual decrease of the resonance frequency after each deposited bilayer, and this can be directly related to the mass (m) and the spring constant (K) (Table 1), thus suggesting deposition of the PANI film. The initial frequency of cantilever fits within 13 kHz (± 4). A reduction of approximately 5% in the initial frequency after the addition of the seventh bilayer can be observed, and this reduction occurred linearly (R 2 = 0.99). It is important to highlight that the uniformity of the deposition between the layers, which is fundamental for the quality of the sensor since the deposition of the film interferes in the quality factor and thus in the sensitivity and the limit of detection. 34
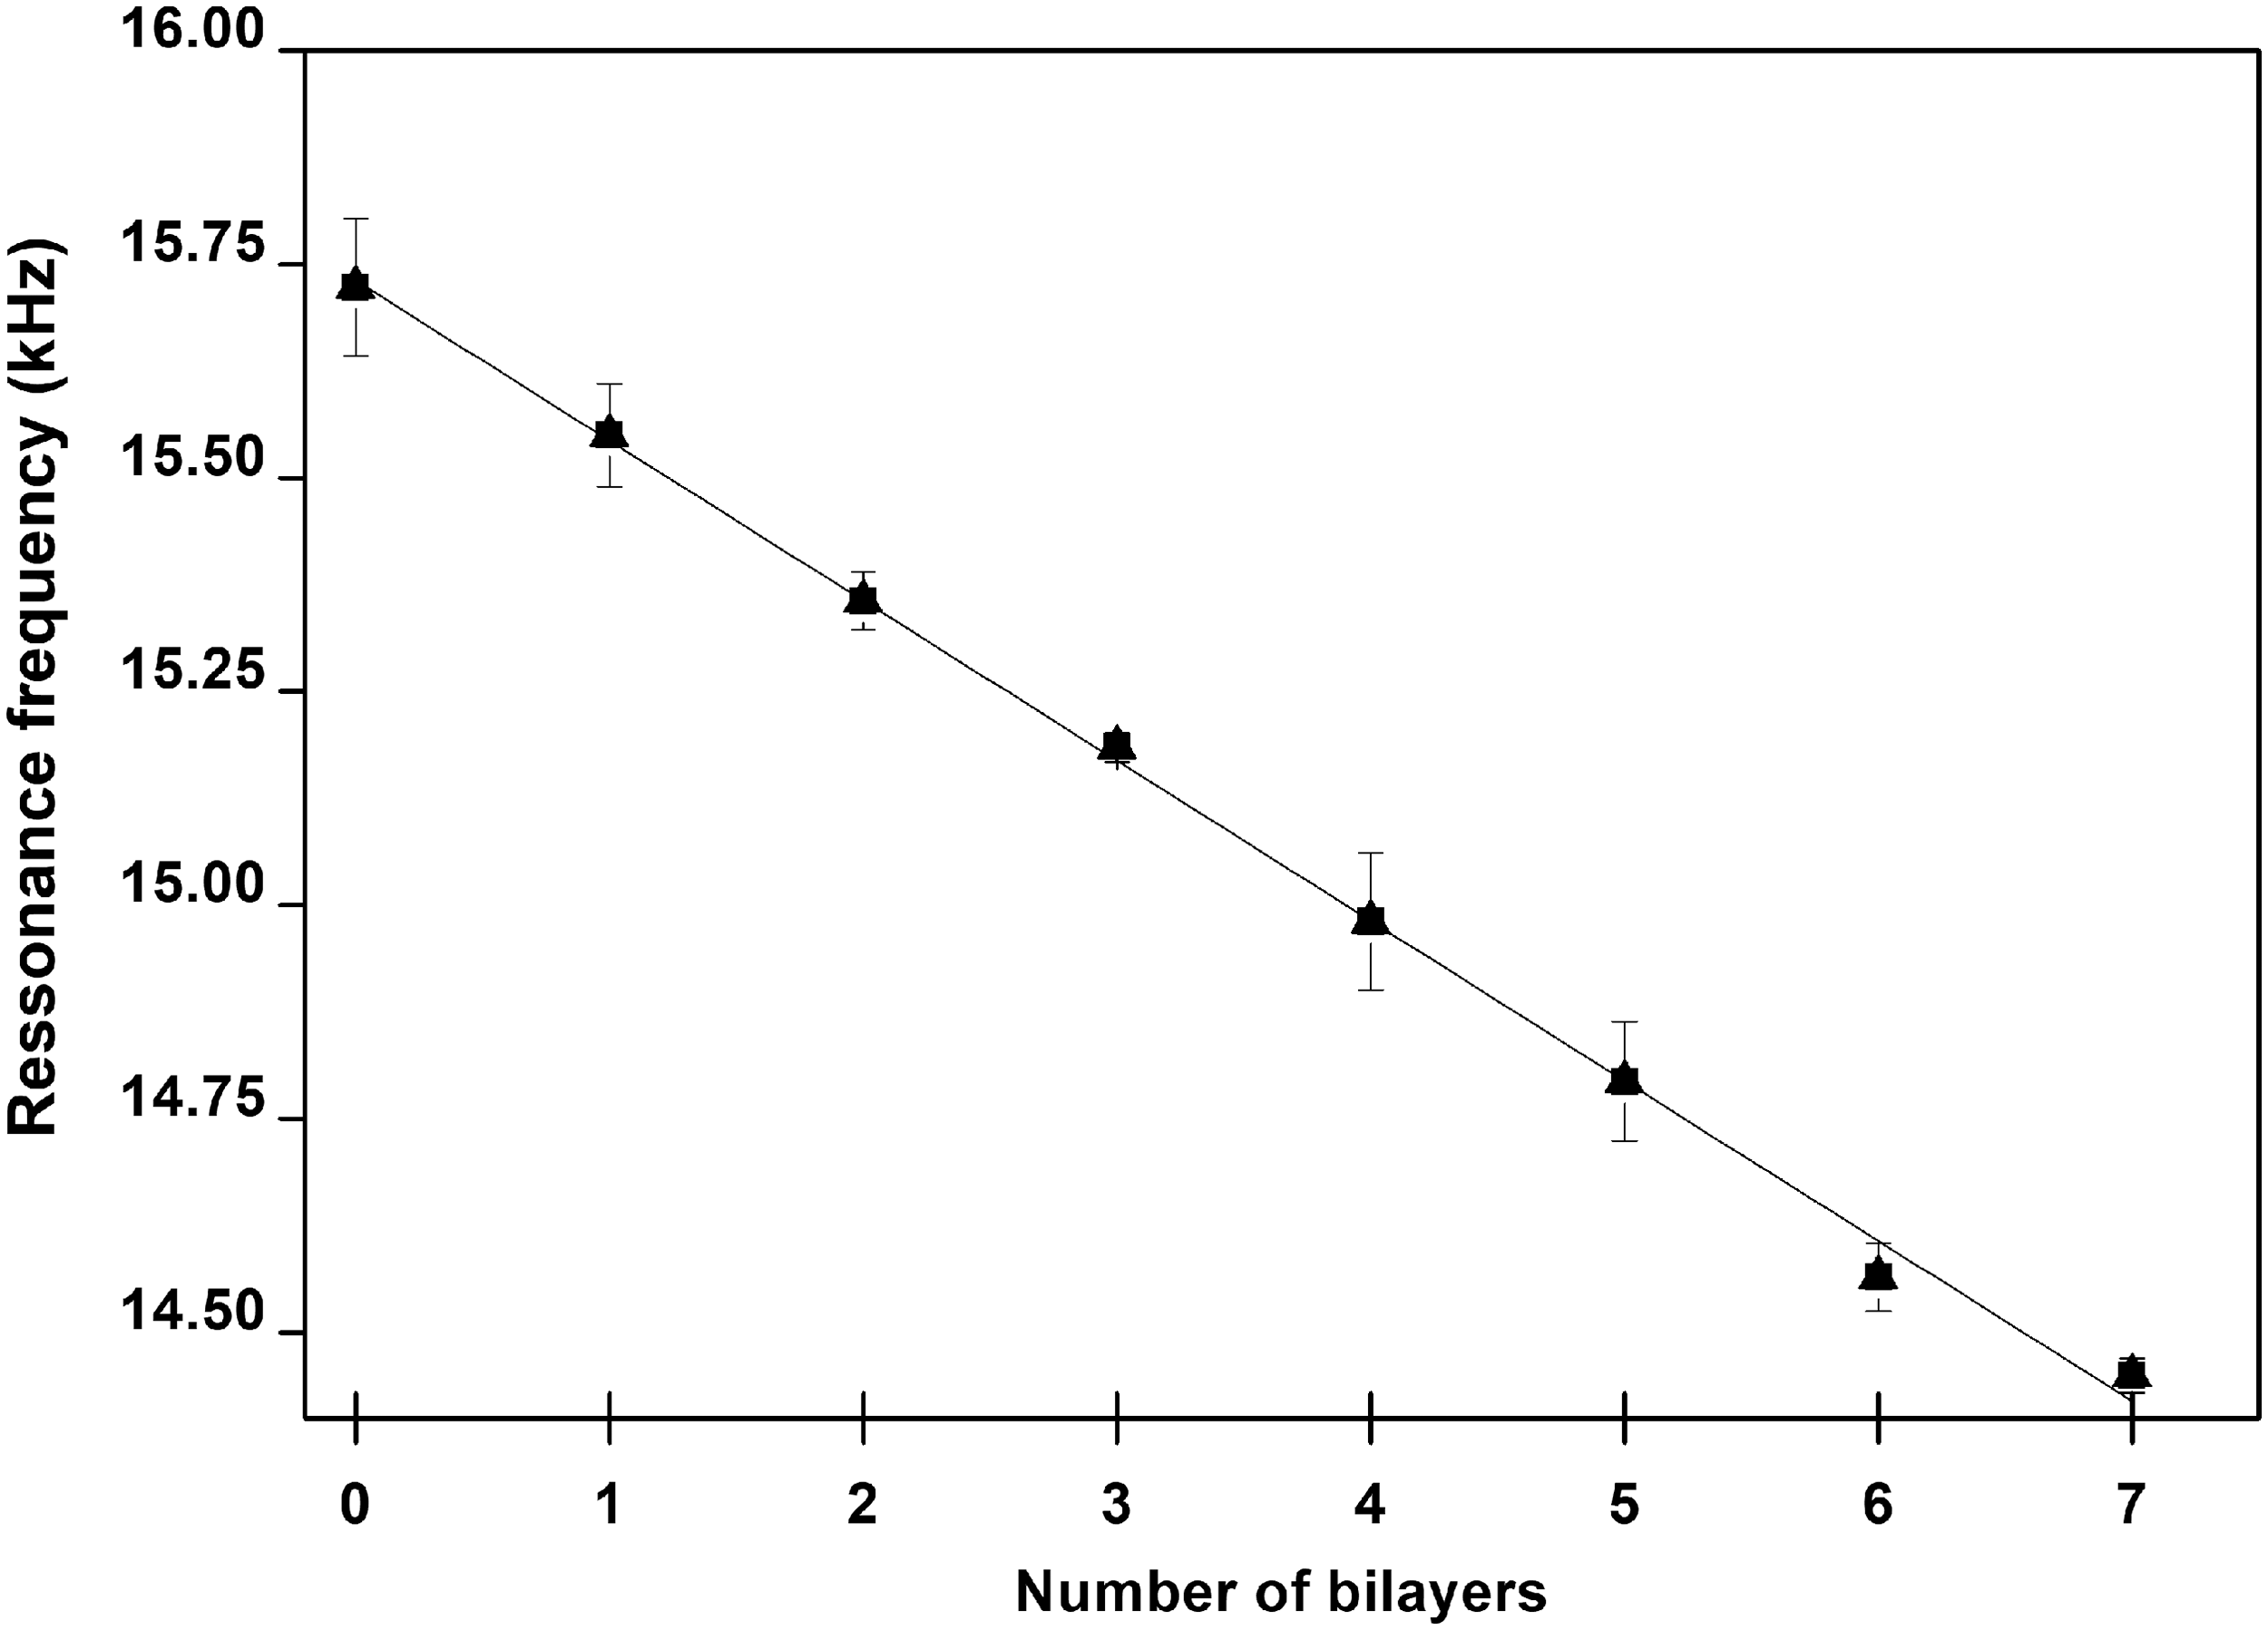
Resonance frequency of the cantilever sensor for each PANI bilayer deposited on the surface.
Spring Constant Values (K) and Mass Variation During the Functionalization of the Cantilever Surface with PANI Film
Table 1 shows the mass added to each bilayer, and it is possible to observe an increase in each stage of the functionalization, which proves the deposition of the material on the cantilever surface and indicates that there was no change in stiffness (related to spring constant). The sensor layer increases the thickness of the cantilever and can act as a damper by altering the efficiency of the excitation, requiring more energy to maintain the vibration thus altering the resonance frequency. 35 The final mass of the coated cantilever was 93.56 ng, indicating an increase in initial cantilever mass near 18%.
Response of the PANI Cantilever Sensor
The response of the PANI cantilever sensor was obtained with a preliminary test using concentrations of methyl 2,6,10-trimethyltridecanoate, ranging from 0.005 to 0.1 mg/mL. The PANI cantilever sensor was able to detect all concentrations evaluated in a linear way (Fig. 7). The high concentrations of methyl 2,6,10-trimethyltridecanoate resulted in high resonance frequency response.
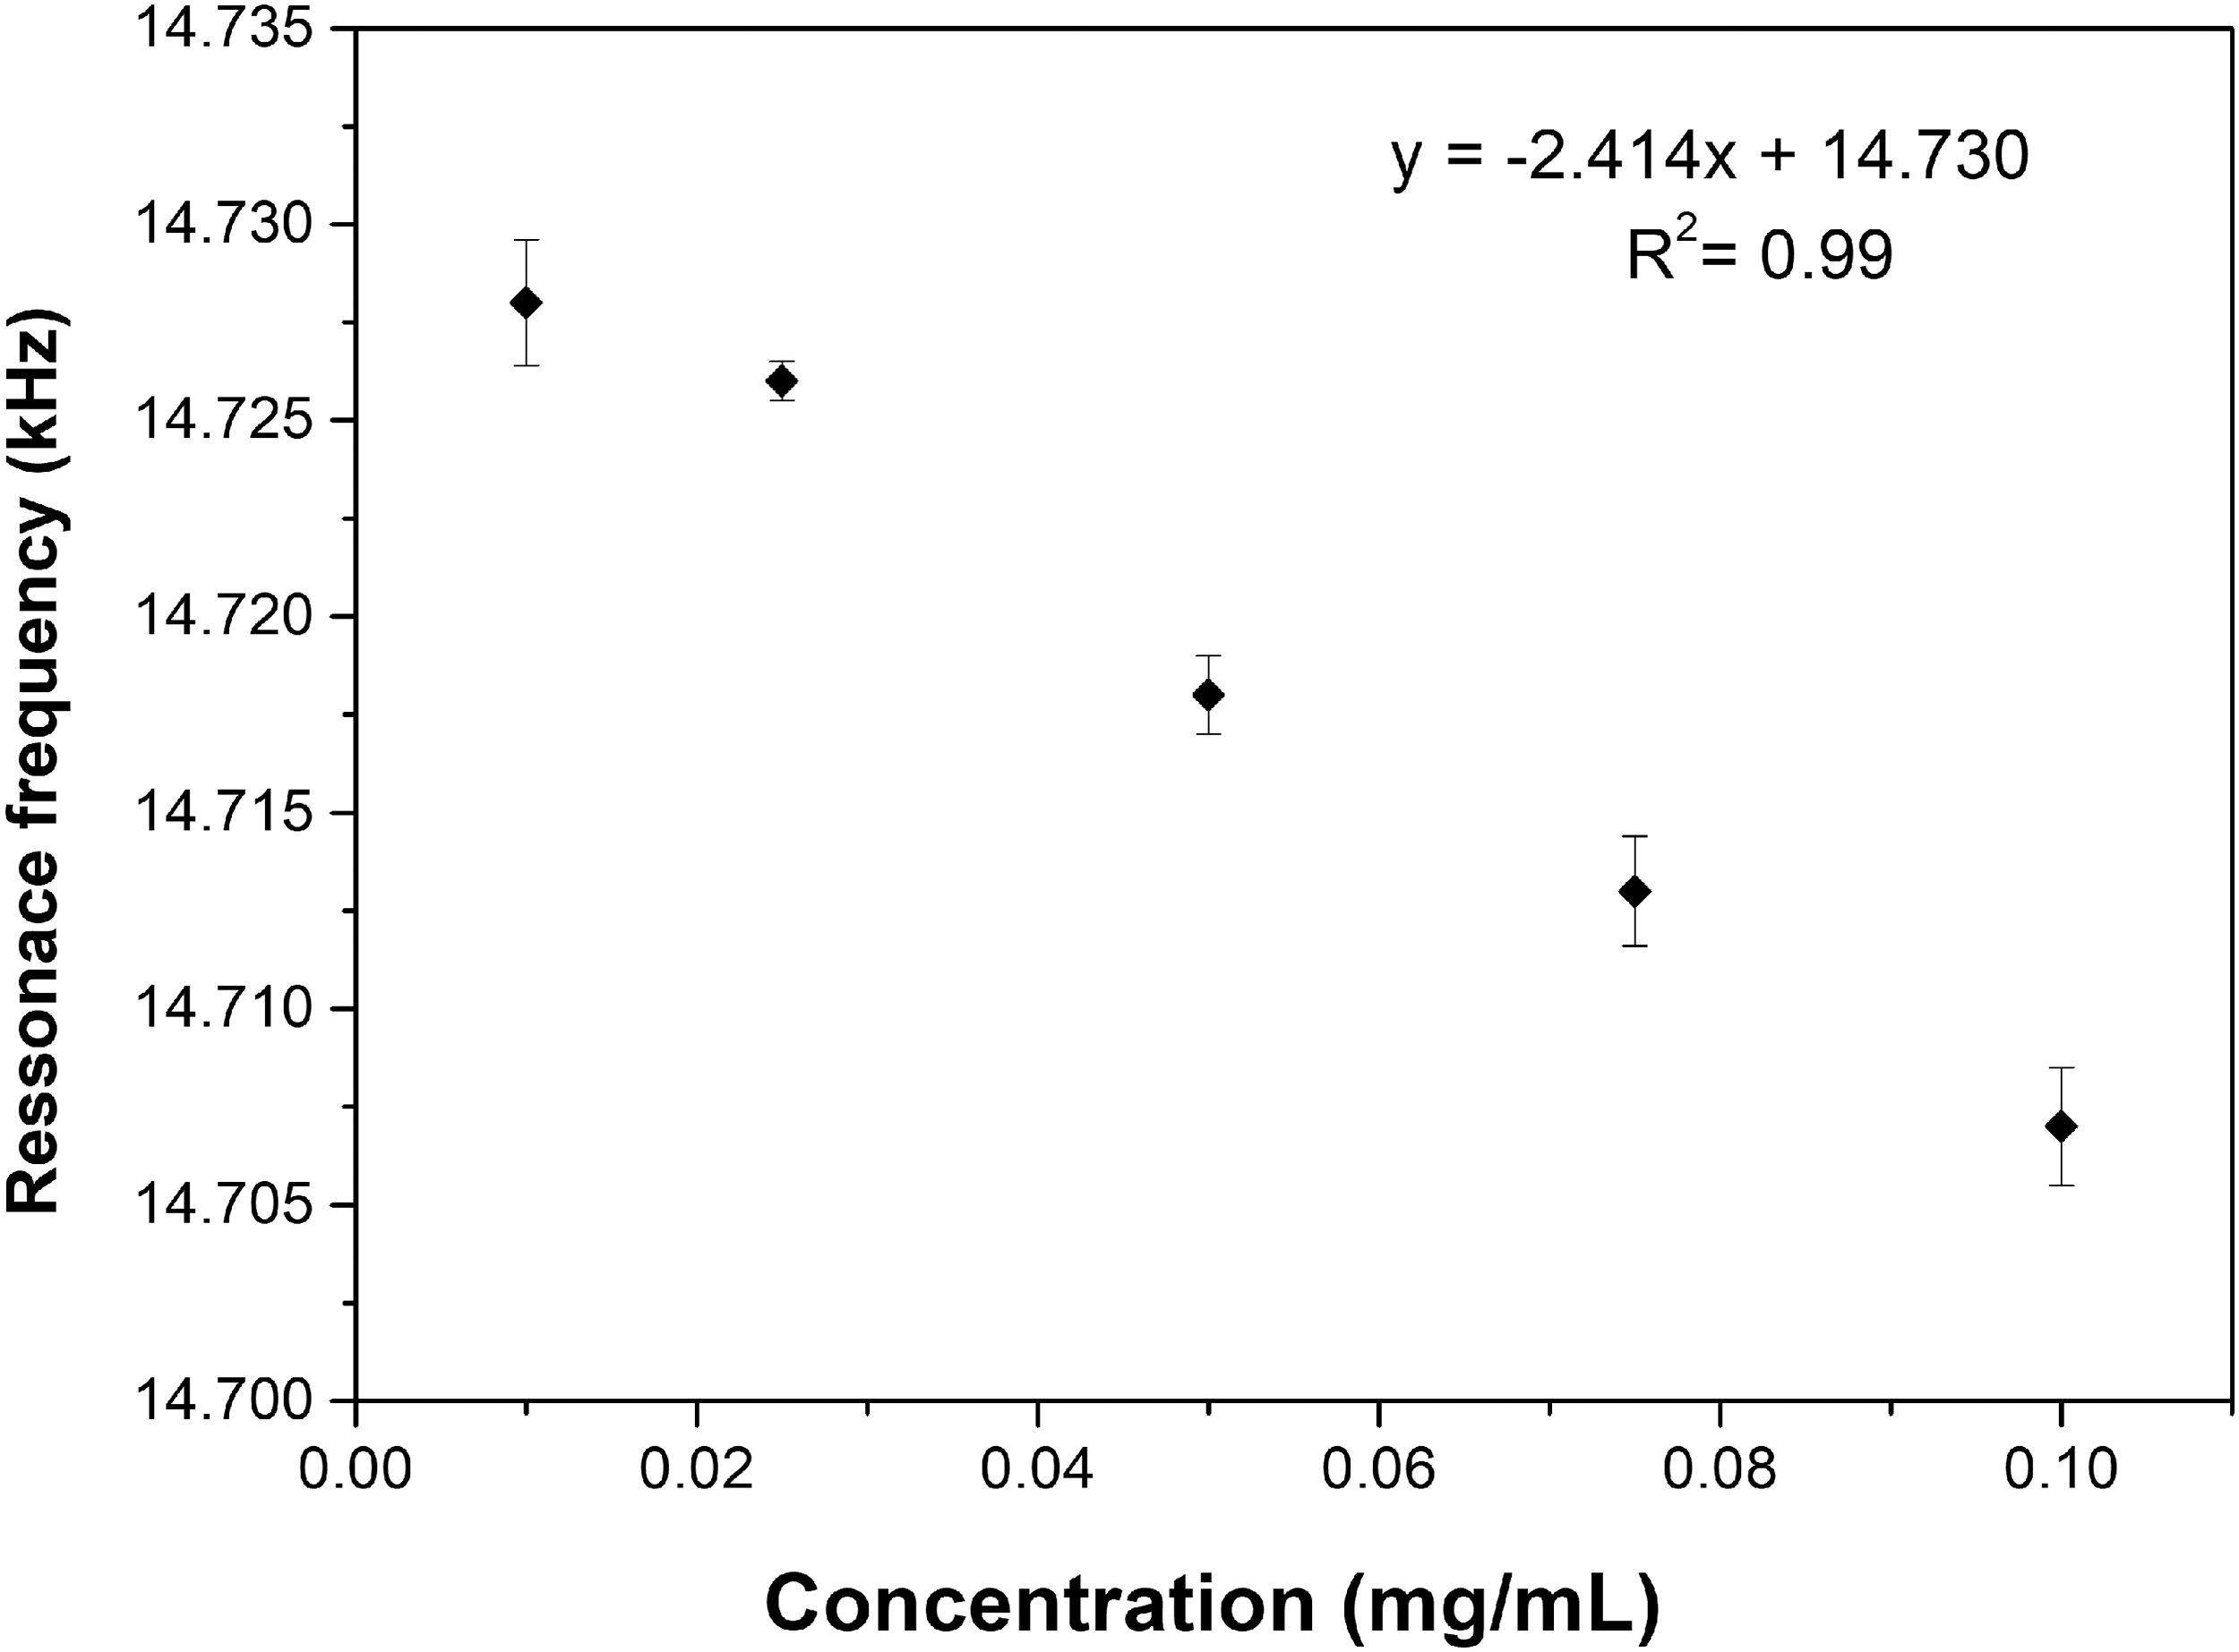
Response of PANI cantilever nanostructured sensor to different concentrations pheromonal compound (0.005 to 0.1 mg/mL).
As the sensors presented response for all concentrations (0.005 to 0.1 mg/mL) of the pheromone compound, a new range of concentrations (0.005 to 0.3 μg/mL) was investigated. The responses (Fig. 8) were obtained from the cantilever sensors without and with functionalization (PANI film), in triplicate. The conditions for these experiments were 25°C ± 0.3 and relative humidity of 67% ± 0.8. The response was also evaluated in the presence of n-hexane (99%, Merck) to evaluate the interference of the solvent in the measurements. It was found that the functionalized sensor did not change the resonance frequency with the presence of n-hexane solvent, showing the same behavior as the measurements in the synthetic air (99%, White Martins, Rio de Janeiro, Brazil), indicating that the solvent did not interfere in the sensor response (Fig. 8). The functionalized cantilever sensor with PANI thin film (Fig. 8) presented a decrease in the resonance frequency with an increase of pheromone concentration, linearly up to 0.005 μg/L (R 2 = 0.99). On the other hand, the uncoated sensor (without PANI film) did not show variation in the resonance frequency in exposure to the different concentrations, indicating that the PANI film deposited on the cantilever is responsible for the sensitivity.
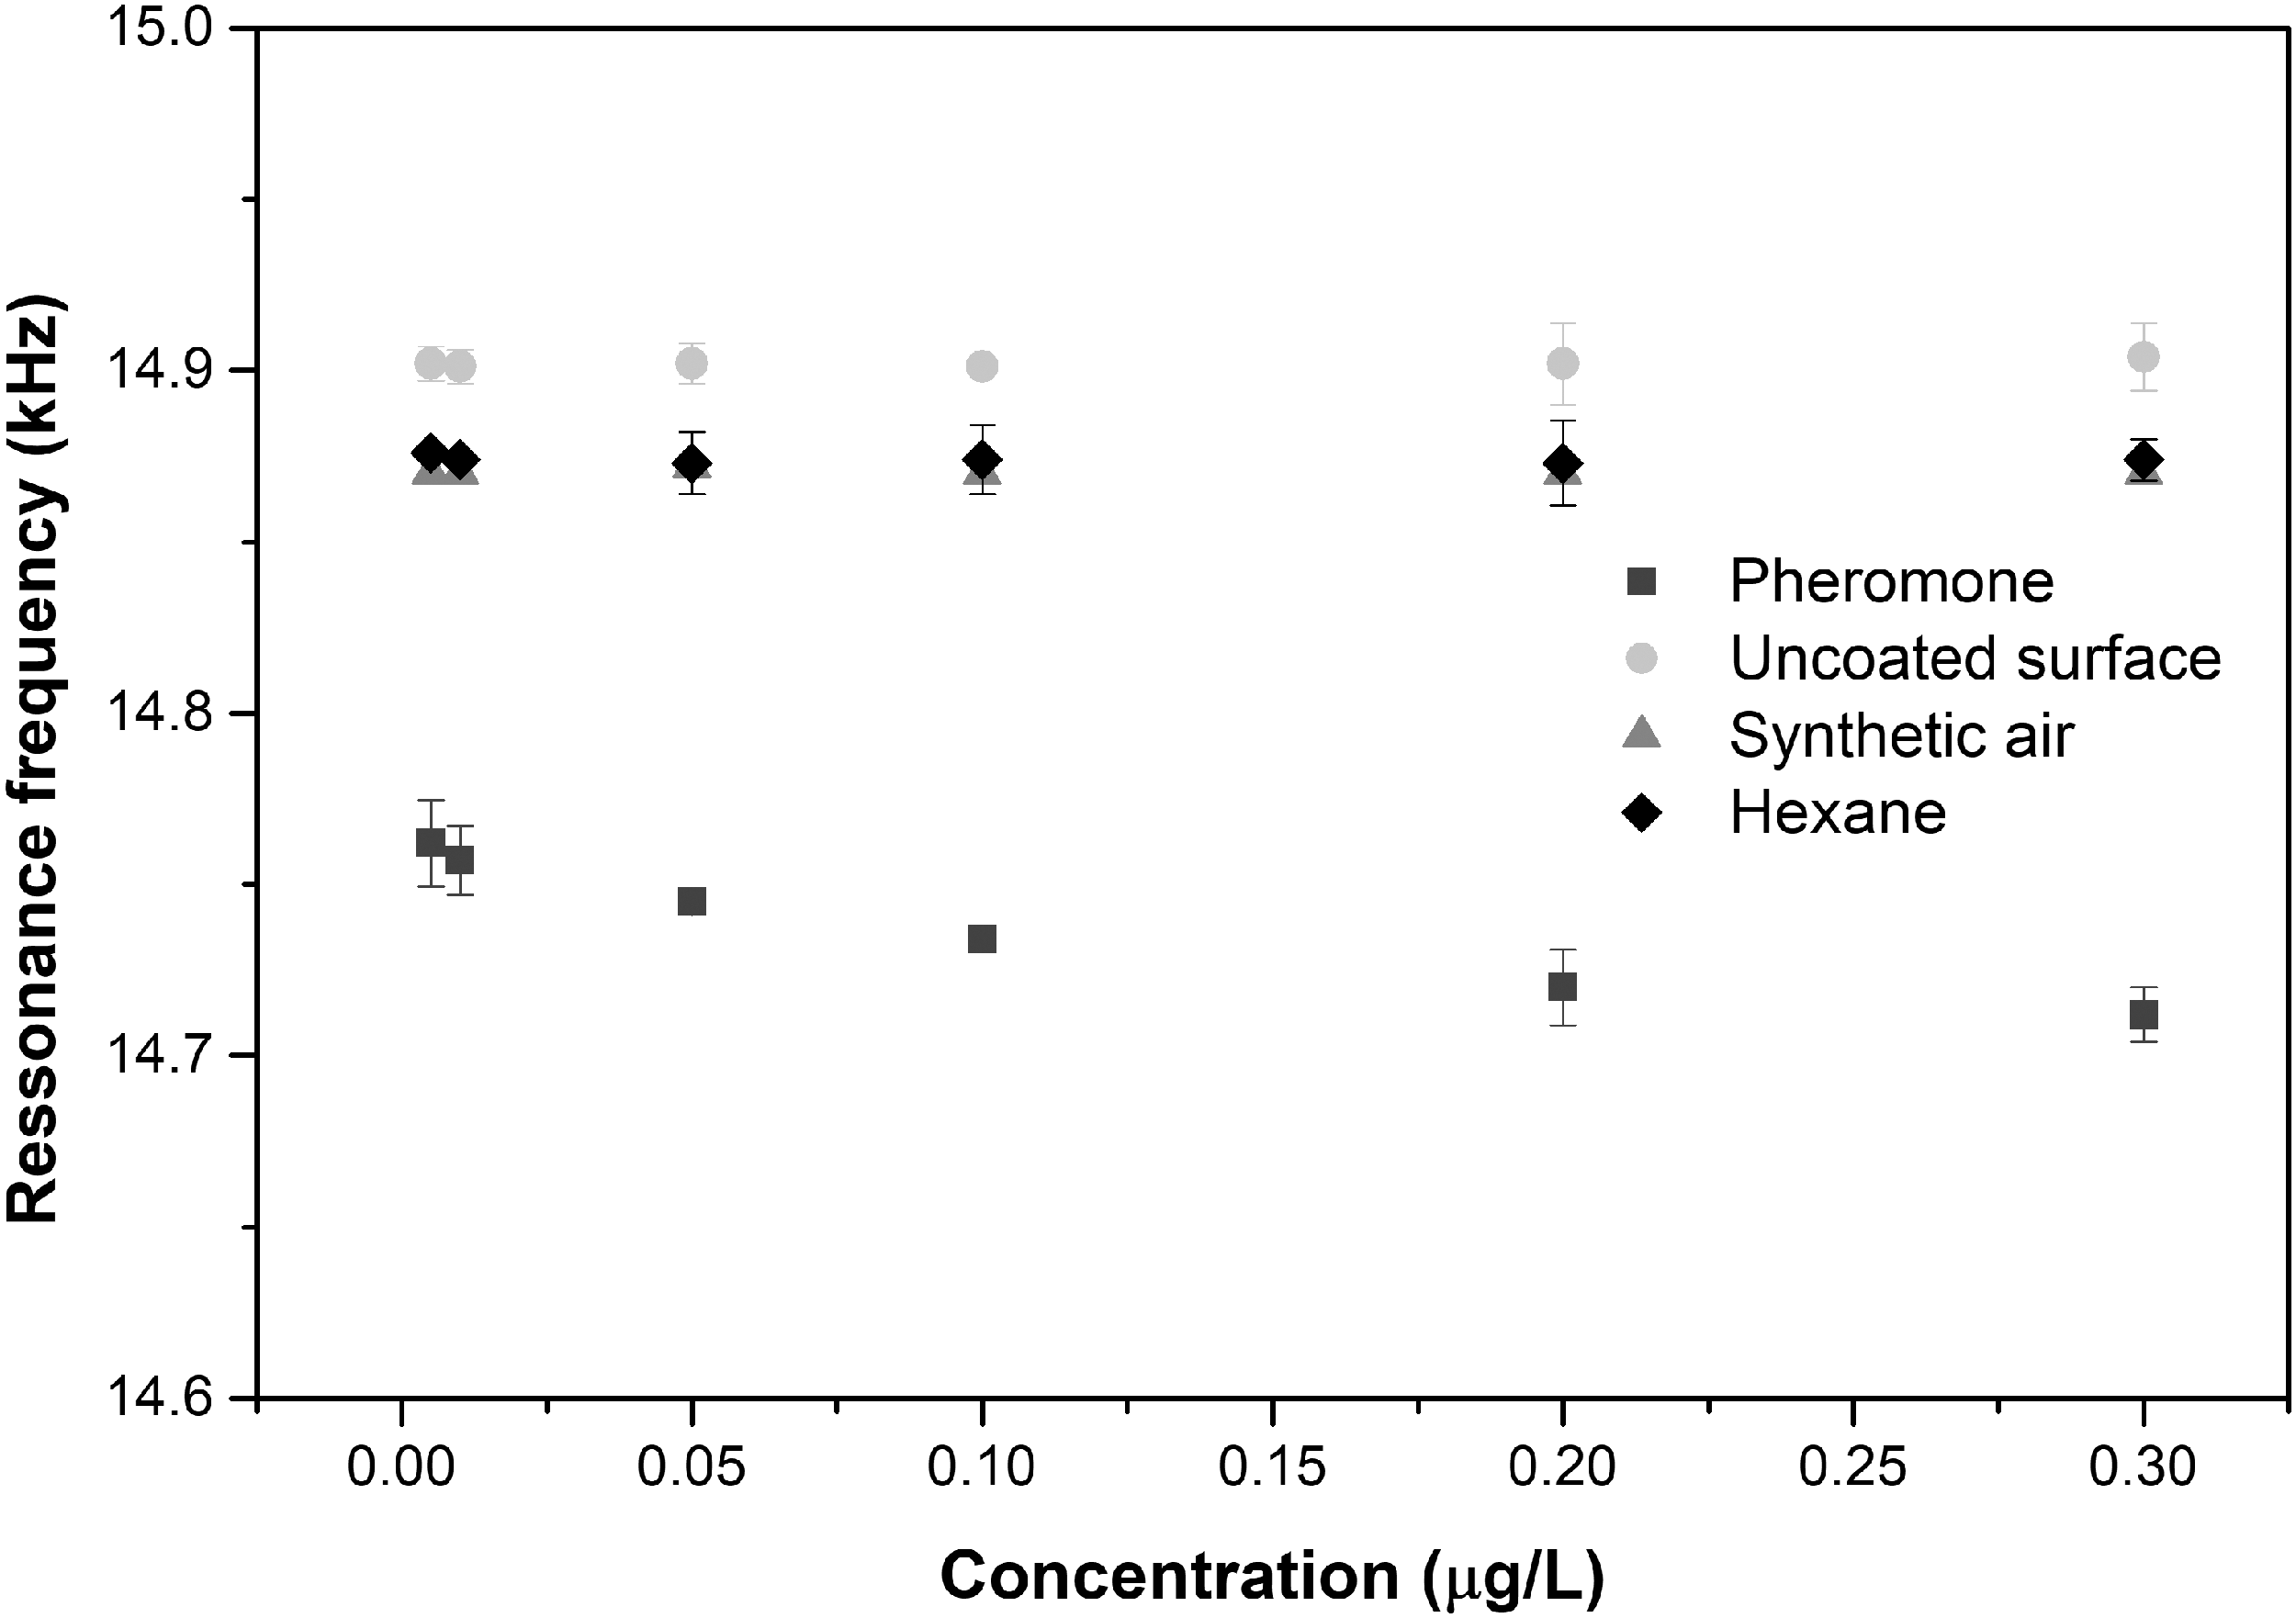
Response of uncoated cantilever sensor and coated with PANI to pheromone compound, hexane and synthetic air.
The limit of detection, sensitivity, and correlation coefficient (R 2 ) were obtained through the calibration curve of the pheromone concentrations versus the resonance frequency. The limit of detection is defined as the lowest concentration of the analyte that can be distinguished with a certain level of confidence (99.6%). The sensitivity and detection limit were 5.28 fg/Hz and 1.44 fg/mL, respectively. Nanomechanical sensors that evaluate resonance frequency allow an extraordinary mass sensitivity, provided they have an adequate sensing layer. 36 Cantilever sensors can detect traces of substances in ppb, ppt, and even ppq through the interaction between the sensitive sensor layer and the analyte. 37 The value of detection limit obtained by the PANI cantilever sensor can detect satisfactorily the amount released by brown stink bug E. heros. Therefore, the demonstrated method exhibited good analytical performance for brown stink bug pheromone detection and could be used in real samples.
The alteration in resonance frequency signal of the PANI cantilever sensor is high for low concentrations of the pheromone (mass), due the adsorbed mass in the sensitive layer (PANI deposited on both sides of the cantilever surface). This change can be related to the sensing event of binding-induced mass-change. Also, a uniform film deposited over the entire cantilever surface, observed by the morphological images, contributes to the high performance of the sensor. The pheromone compound (methyl 2, 6, 10-trimethyltridecanoate) presents three chiral centers, which generates eight possible stereoisomers that attract brown stink bug females. This molecule is volatile, and in contact with the PANI film is adsorbed, showing a change in the frequency resonance of the cantilever. The mechanism for this adsorbed volatile can be related to the structural PANI expansion, decreasing the conductivity and changing the mass of cantilever sensor.
The high sensitivity of the PANI cantilever sensor resulted from the high surface area of the sensitive layer and film thickness in the nanometric scale, which contribute to improve the interaction between the pheromone molecules with the PANI film. The PANI nanostructure visualized in the AFM images and the increased mass with the bilayer deposition contribute to the high sensor performance, allowing the presence of more binding sites, which resulted in a thin film with mechanical flexibility and exceptional affinity. Cantilever sensors are the most flexible mechanical sensor systems with reduced dimensions, thus can become fast, cheap and more sensitive. 38
Several studies report the mechanical principle based on mass adsorption in cantilevers with high sensitivity. Sone et al. 39 developed a piezoelectric cantilever sensor with wheatstone circuits to evaluate water adsorption and achieved a sensitivity of 2 pg/Hz in the detection of water vapor. Hosaka et al. 40 applied a piezoelectric mass sensor to evaluate humidity in the air and estimated sensitivity of 200 fg/Hz. Gruber et al. 41 applied an array of cantilever sensors in the diagnosis of diseases such as cancer and HIV to detect interactions between proteins and carbohydrates and obtained picomolar (91 pM) sensitivity of the protein (cyanovirin-N). Steffens et al. 8 applied a microcantilever sensor for the detection of 2-heptanone—bee pheromone—exhibiting a sensitivity of 0.67 nm/ppm. Moitra et al. 42 developed a miniaturized MEMS device that has been covalently functionalized for optical detection by Doppler vibrometry for Helicoverpa armigera sex pheromones and was able to detect concentrations on the order of femtograms. In this context, the PANI cantilever sensor demonstrates the potential to detect femtogram levels of pheromone, and this detection will provide an accurate tool for making decisions about an infestation from brown stink bug in agriculture.
Conclusion
Absorption bands and morphology images verified that each bilayer deposited changed the cantilever surface and the functionalization through the LbL technique with PANI film occurred efficiently. It was also observed that mass deposition reduced the resonance frequency of each deposited bilayer. The responses of PANI cantilever sensors presented a very high limit of detection (1.44 fg/mL) and sensitivity (5.28 fg/Hz) to the methyl-2,6,10 trimethyltridecanoate compound. Thus, this device provides a promising approach for chemical sensing capable of recognizing the sex pheromone of brown stink bug E. heros.
Footnotes
Acknowledgments
The authors would like to thank Cnpq, Capes, Fapergs, and Finep for their financial support.
Author Disclosure Statement
No competing financial interests exist.