
Abstract
Gradual increase in energy demand, global warming and fleet industrialization have served as the lashing forces for the development of efficient, safe, clean, renewable and sustainable energy source having the potential of replacing fossil fuels. Current research has been focused towards the exploitation of lignocellulosic biomass (LCB) for biofuel production. Pretreatment plays an important role in efficient enzymatic saccharification of LCB. In present study, effectiveness of chemical pretreatment with alkaline hydrogen peroxide (H2O2, pH 11.5) and sodium hydroxide (NaOH) was investigated for increasing enzymatic hydrolysis of paddy (rice) straw. Face-centered Central Composite Design (FCCD) was used to optimize the pretreatment conditions with respect to solid loading (%, w/v), time (min), temperature (oC) and concentration (% v/v) of NaOH and H2O2 (pH 11.5). The optimized values of all the parameters were obtained as solid loading 16.76 %; time 15 min; temperature 120.97oC; and H2O2 concentration 2 %, and obtained the reducing sugar concentration of 35.29 g L−1 (352.9 g reducing sugar kg−1 dry biomass) after saccharification at 50°C using cellulases Cellic Ctec2 at 10 % solid loading of pretreated biomass and enzyme loading of 60 mg protein g−1 pretreated biomass on dry basis. Similarly, in case of NaOH pretreatment, the optimized values were obtained as solid loading 20.00%; time 42.51 min; temperature 84.79oC; and NaOH concentration 0.5 % with reducing sugar concentration of 36.93 g L−1 (369.3 g reducing sugar kg−1 dry biomass). Pretreatment with NaOH was found to be better than alkaline H2O2 in terms of concentration, temperature, solid loading and reducing sugars obtained. This is the first study for comparative statistical standardization of alkaline pretreatment variables along with their interactive study.
Introduction
The dire boost in global energy consumption alongwith depletion of fossil fuels and augmentation of greenhouse gas emissions (GHEs) has motivated the advancement of renewable sources of energy. 1 Among the renewable sources of energy, liquid biofuels, particularly bioethanol, have served as the prime focus to sort out the issues of energy demand and supply. Currently, the lignocellulosic bioethanol production is mainly focused on the utilization of agricultural feedstocks, predominated by paddy straw owing to its highest production (1,140 million tons per year in the world) and abundant availability. 2,3
However, the major constraints in the exploitation of paddy straw include low density, high mineral content, anchorage of multiple diseases and deliberate degradation. In view of this, the farmers are burning straw after harvesting of paddy, thereby, deliberately assisting in the increase of air pollution and global warming.
Recent research on bioethanol is focused on the development of the bioprocess for efficient conversion of cellulosic and hemicellulosic fractions of paddy straw into bioethanol. Lignin is associated with cellulosic and hemicellulosic components of paddy straw via covalent bonds, forming lignin-carbohydrate complexes (LCCs) containing ferulic bridges attached via ether and ester bonds. Lignin removal is an essential step for increasing the accessible sites for enzymes and aid in effective enzymatic saccharification. 4
Amongst the key steps (pretreatment, saccharification, fermentation and product recovery) for bioethanol production, pretreatment plays an indispensible role to trounce over the highly recalcitrant structure of lignocellulosic biomass (LCB) and its efficient conversion to bioethanol. 5
However, the lofty operational and capital cost of pretreatment process poses a significant challenge in the process economics. 6 Keeping in view the pros and cons of several pretreatment processes, the choice of a pretreatment depends on the requirement of the equipment, chemicals, power and overall retention time. 7
Various researchers have investigated several pretreatment strategies viz., physical, chemical, physic-chemical and biological for increasing the accessibility of the enzyme to extract fermentable sugars without inhibitor formation. 8,9 Cellulose and hemicelluloses can be released from paddy straw by the removal of lignin via acidic or alkaline pretreatment. 10,11 An acidic pretreatment result in the formation of fermentation inhibitor compounds i.e. furfurals and hydroxymethyl furfurals (HMF). 12 –14 However, alkaline pretreatment disrupts the ester bonds among hemicelluloses, cellulose and lignin, thereby, increasing the porosity and enzymatic hydrolysis of biomass with lesser degradation of sugars and derivatives of furans. 15,16
One of the major limitations in the use of alkalies for pretreatments lies in the cost of chemicals and formation of the insoluble complexes which are non-biodegradable and cause the environmental pollution. 17 Hence, advancement of efficient pretreatment technologies alongwith standardization of different parameters is indispensible for minimal loading of the chemicals and maximal loading of biomass, thereby, boosting the enzymatic hydrolysis and making the process economically viable. 18
Several researchers have reported the optimization of different parameters of pretreatment for the efficient conversion of paddy straw to bioethanol, 19 biogas, 16 biohydrogen, 20 biobutanol, 21 and biopolymer. 22
However, to the best of our knowledge, comparative statistical standardization of alkaline pretreatment variables along with their interactive study has not been reported earlier. The present study was carried out with the objective of development of a bioprocess for maximal enzymatic saccharification of hydrogen peroxide (H2O2) and sodium hydroxide (NaOH) pretreated paddy straw. In addition to this, this comparison would aid in the better understanding of the interaction of alkaline hydrogen peroxide and sodium hydroxide with other pretreatment parameters viz. solid loading, pretreatment time and temperature (oC).
Materials and Methods
Procurement of Paddy Straw
Paddy straw (Oryza sativa L.) was procured from the local village viz. Ibban, Wadala Kalan in Kapurthala, Punjab, India. After collection, the straw was sun-dried and chopped to a size of 2–4 cm fraction, prior to pretreatment.
Optimization of Pretreatment Conditions
FCCD matrix
FCCD was employed to study the combined effect of solid loading (%); pretreatment time (min); temperature (oC) and concentration (%) on the reducing sugars obtained after enzymatic saccharification. Reducing sugars obtained is an indirect indicator for pretreatment which reflects the degree of structure disruption in paddy straw. Optimization of alkaline pretreatment conditions was carried out by two chemicals, i.e., alkaline hydrogen peroxide (H2O2, pH 11.5) and sodium hydroxide (NaOH) w.r.t. biomass loading (5–20%), pretreatment time (15–60 min) and pretreatment temperature (50–121°C). The concentration of H2O2 and NaOH varied from 0 to 2 and 0 to 1%, respectively. All the parameters were studied w.r.t. three levels i.e., low (-1), middle (0) and high (+1), with α value of 1. The real and coded values are presented in Table 1. To ensure the accuracy of the model, the software exhibited 30 experimental runs with 6 runs at the center points. Reproducibility of the model developed was further ensured from the values of the responses which were the means of the duplicates.
Coded Values for Each Variable of FCCD for Pretreatment Conditions
Analysis of variance (ANOVA) and lack of fit tests were used to evaluate the statistical significance after the regression analysis. Significant parameters were obtained from p < 0.05. The response of the dependent variable was estimated by using a polynomial equation (Equation 1), where variance of all the parameters was divided into linear, squared, quadratic and interactive terms.
where, Y is reducing sugar predicted response (g L−1), x 1, x 2, x 3 and x 4 are the coded levels of independent variables, b0 is the offset term, b1, b2, b3 and b4 are the linear effects, b11, b22, b33 and b44are the squared effects and b12, b13, b14, b23, b24 and b34 are the interaction effects.
The quality of the model was estimated by predicted R2 (R2 predict), adjusted R2 (R2 adj) and coefficient of determination (R 2 ). Contour and 3-D plots were used to illustrate the relationship between the parameters and response values. Moreover, the prototype between the variables was used to evaluate the interaction between the parameters. Further, the optimal solutions were obtained by numerical optimization using Design Expert software.
Model Validity
Under optimized conditions, duplicate sets of confirmatory experiments were run so as to evaluate the validity of the model generated.
Post-Pretreatment Conditioning
The pretreated paddy straw was conditioned to neutral pH by washing with distilled water. The water quantity in washing the pretreated biomass was 20 mL g−1 biomass. After each washing, the solids were separated from the liquids by filtering with the muslin cloth and stored at 4°C for subsequent enzymatic saccharification.
Enzymatic Saccharification
The enzymatic hydrolysis was performed by using Cellic Ctec 2 (Novozymes, Beijing, China) enzyme with an initial activity of 185 FPU mL−1. The saccharification was performed with a biomass loading of 10% and enzyme loading of 60 mg enzyme protein g−1 dry biomass at 50°C in sodium citrate buffer of pH 5.5 for 24 h. The unhydrolyzed biomass samples from all the runs were separated by centrifugation at 10,000 rpm for 15 min and supernatant was stored at 4°C prior to analyses. 23
Analytical Procedures
Moisture content of raw and pretreated paddy straw was analyzed by following the procedures of Sluiter et al. 24 The samples were dried in vacuum oven at 80°C till constant weight. Reducing sugars in the saccharified paddy straw hydrolysate were determined by dinitrosalicylic acid (DNS) method. 25 Protein was determined by Folin-Lowry method. 26
Results and Discussion
Optimization of Pretreatment Conditions
Variability in the composition of LCB necessitates the development of precise pretreatment conditions for obtaining maximum amount of fermentable sugars after saccharification. Since there are both pros and cons of chemical pretreatment, so, their effect must be evaluated for efficient enzymatic saccharification. Prior to enzymatic saccharification, the pretreated biomass is subjected for conditioning by washing with water, after pretreatment so as to cease the pretreatment reaction, thereby adjusting pH and removing the inhibitory compounds that hinder the enzymatic saccharification process. 27
In the present study, the pretreatment conditions of paddy straw were optimized using H2O2 (pH 11.5) and NaOH w.r.t. solid loading (%), time (min), temperature (oC) and concentration (%), using RSM with Design-Expert software. FCCD matrix with the experimental and predicted values of reducing sugar concentration using H2O2 and NaOH are shown in Tables 2 and 3, respectively. The significance of the model developed by the software is evaluated from p-values (<0.05). 28 Low probability values (p < 0.05) obtained from the ANOVA tables ( Tables 4, 5 ) exhibit higher F-values of 48.57 (H2O2 pretreatment) and 571.58 (NaOH pretreatment). The p-values obtained from the ANOVA table allow the estimation of error % along with interactive study among the variables involved in the study (Arora et al., 2015). 29 On the other hand, F-value illustrates the consistency of the fitted model with the response(s). 30
FCCD Using RSM for Pretreatment with Alkaline Hydrogen Peroxide
FCCD Using RSM for Pretreatment with Sodium Hydroxide
ANOVA for the Experimental Results of the FCCD with Hydrogen Peroxide Pretreatment
df, Degrees of freedom; F-Fisher's variance ratio; P-probability value; P < 0.05- significant at 5% level
ANOVA for the Experimental Results of the FCCD with Sodium Hydroxide Pretreatment
df, Degrees of freedom; F, Fisher's variance ratio; P, probability value; P < 0.05, significant at 5% level
For H2O2 and NaOH pretreatments, the linear effect of solid loading, temperature and chemical concentrations were found to be significant (p-value <0.05) ( Tables 4, 5 ). Moreover, the interaction of concentration of H2O2 with solid loading and temperature were found to be significant. Similar interactions were noticed in case of NaOH pretreatment. On increasing the pH of H2O2 to 11.5–11.6, it dissociates into hydrogen and hydroperoxyl anion (HOO-). The hydroperoxyl anion, thus, reacts with the remaining of peroxide to form highly-reactive hydroxyl radicals, which further attack the lignin structure. 19 pH is an important criterion for effectiveness of H2O2 in lignin oxidation as the oxidizing agent attacks only on the aliphatic components of macromolecule. 31
On the other hand, NaOH pretreatment causes swelling of the lignocellulosic biomass owing to solvation and saponification, thereby, increasing the internal surface area and disrupting the lignin structure. 16 It works on the peeling mechanism which is active at the reducing ends of carbohydrates. The hydroxyl ions mainly attack the ether linkages present in the lignin structure. 32 The enzymatic saccharification in both NaOH and H2O2 pretreatments is boosted by the release of lignin, elimination of nonproductive adsorption sites and redistribution of hemicelluloses and reduction in the crystallinity of cellulose. 33
The non-significant ‘lack of fit’ with F value of 0.70 and 1.37 for H2O2 and NaOH pretreatments, respectively, further confirmed the significance of the model developed. On the basis of the quadratic models developed for H2O2 pretreated paddy straw, the model equation for reducing sugar concentration is shown in Equation 2. Similarly, the model equation for reducing sugar concentration for NaOH pretreated paddy straw is shown in Equation 3.
where, Y is the notation for reducing sugar concentration (g L−1); A, B, C and D are the notations for solid loading, time, temperature and concentration, respectively.
The synergistic and antagonistic effects are indicated by positive and negative signs. 34 All the individual estimated parameters have the synergistic effect on the response in NaOH pretreatment whereas temperature and concentration have antagonistic effect on H2O2 pretreatment as depicted from the signage in the equations.
The values of coefficient of determination R2 were used to analyze the quality of the models developed, which is based on the variability in the response values due to disparity in the experimental parameters and their subsequent interactions. An R-squared value near to 1 indicates precise response prediction for a particular model. 35 Nevertheless, a model with >0.75 of R-squared value is acceptable. 36
In case of H2O2 pretreated paddy straw, high R-squared values of 0.978 were obtained, which explained 97.8% of the variation in the response, as well as high value of the adjusted determination coefficient (0.958). Similarly, the model using NaOH pretreated paddy straw showed higher values of coefficient of determination (0.998) and adjusted R2 (0.996). Correlation values close to 0.9 between the experimental and predicted values have been reported previously. 29 However, the models developed by RSM cannot be compared owing to the inconsistencies in the operational conditions. 37
The actual and predicted values were very close to each other for both the models developed with very low values of coefficient of variation, i.e., 7.27% for H2O2 pretreatment and 1.63 % for NaOH pretreatment, which again indicated high precision and reproducibility of the models. 38 Furthermore, signal to noise ratio of more than 4 is an indicative of the accuracy of the model. 30 Adequate precision for both H2O2 and NaOH pretreatments were found to be 31.125 and 76.429, respectively, which specified that both the models could be used for prediction of the responses. The actual and predicted values for H2O2 and NaOH pretreatments, respectively, are plotted in the diagnostic plots, wherein all the points lie along the diagonal line, again indicating good fit of both the models (Fig. 1). Contour and 3-D plots for H2O2 and NaOH pretreatments are shown in Figs. 2 and 3, respectively. These plots indicate the interactions between any two variables whilst keeping the others at the central values. Furthermore, the shape of the plots highlights the relationship between the parameters where elliptical plot represents stronger interactions and circular plots represent the weaker interactions. 29 The smallest ellipse in the center points towards the maximum response of reducing sugar concentration.
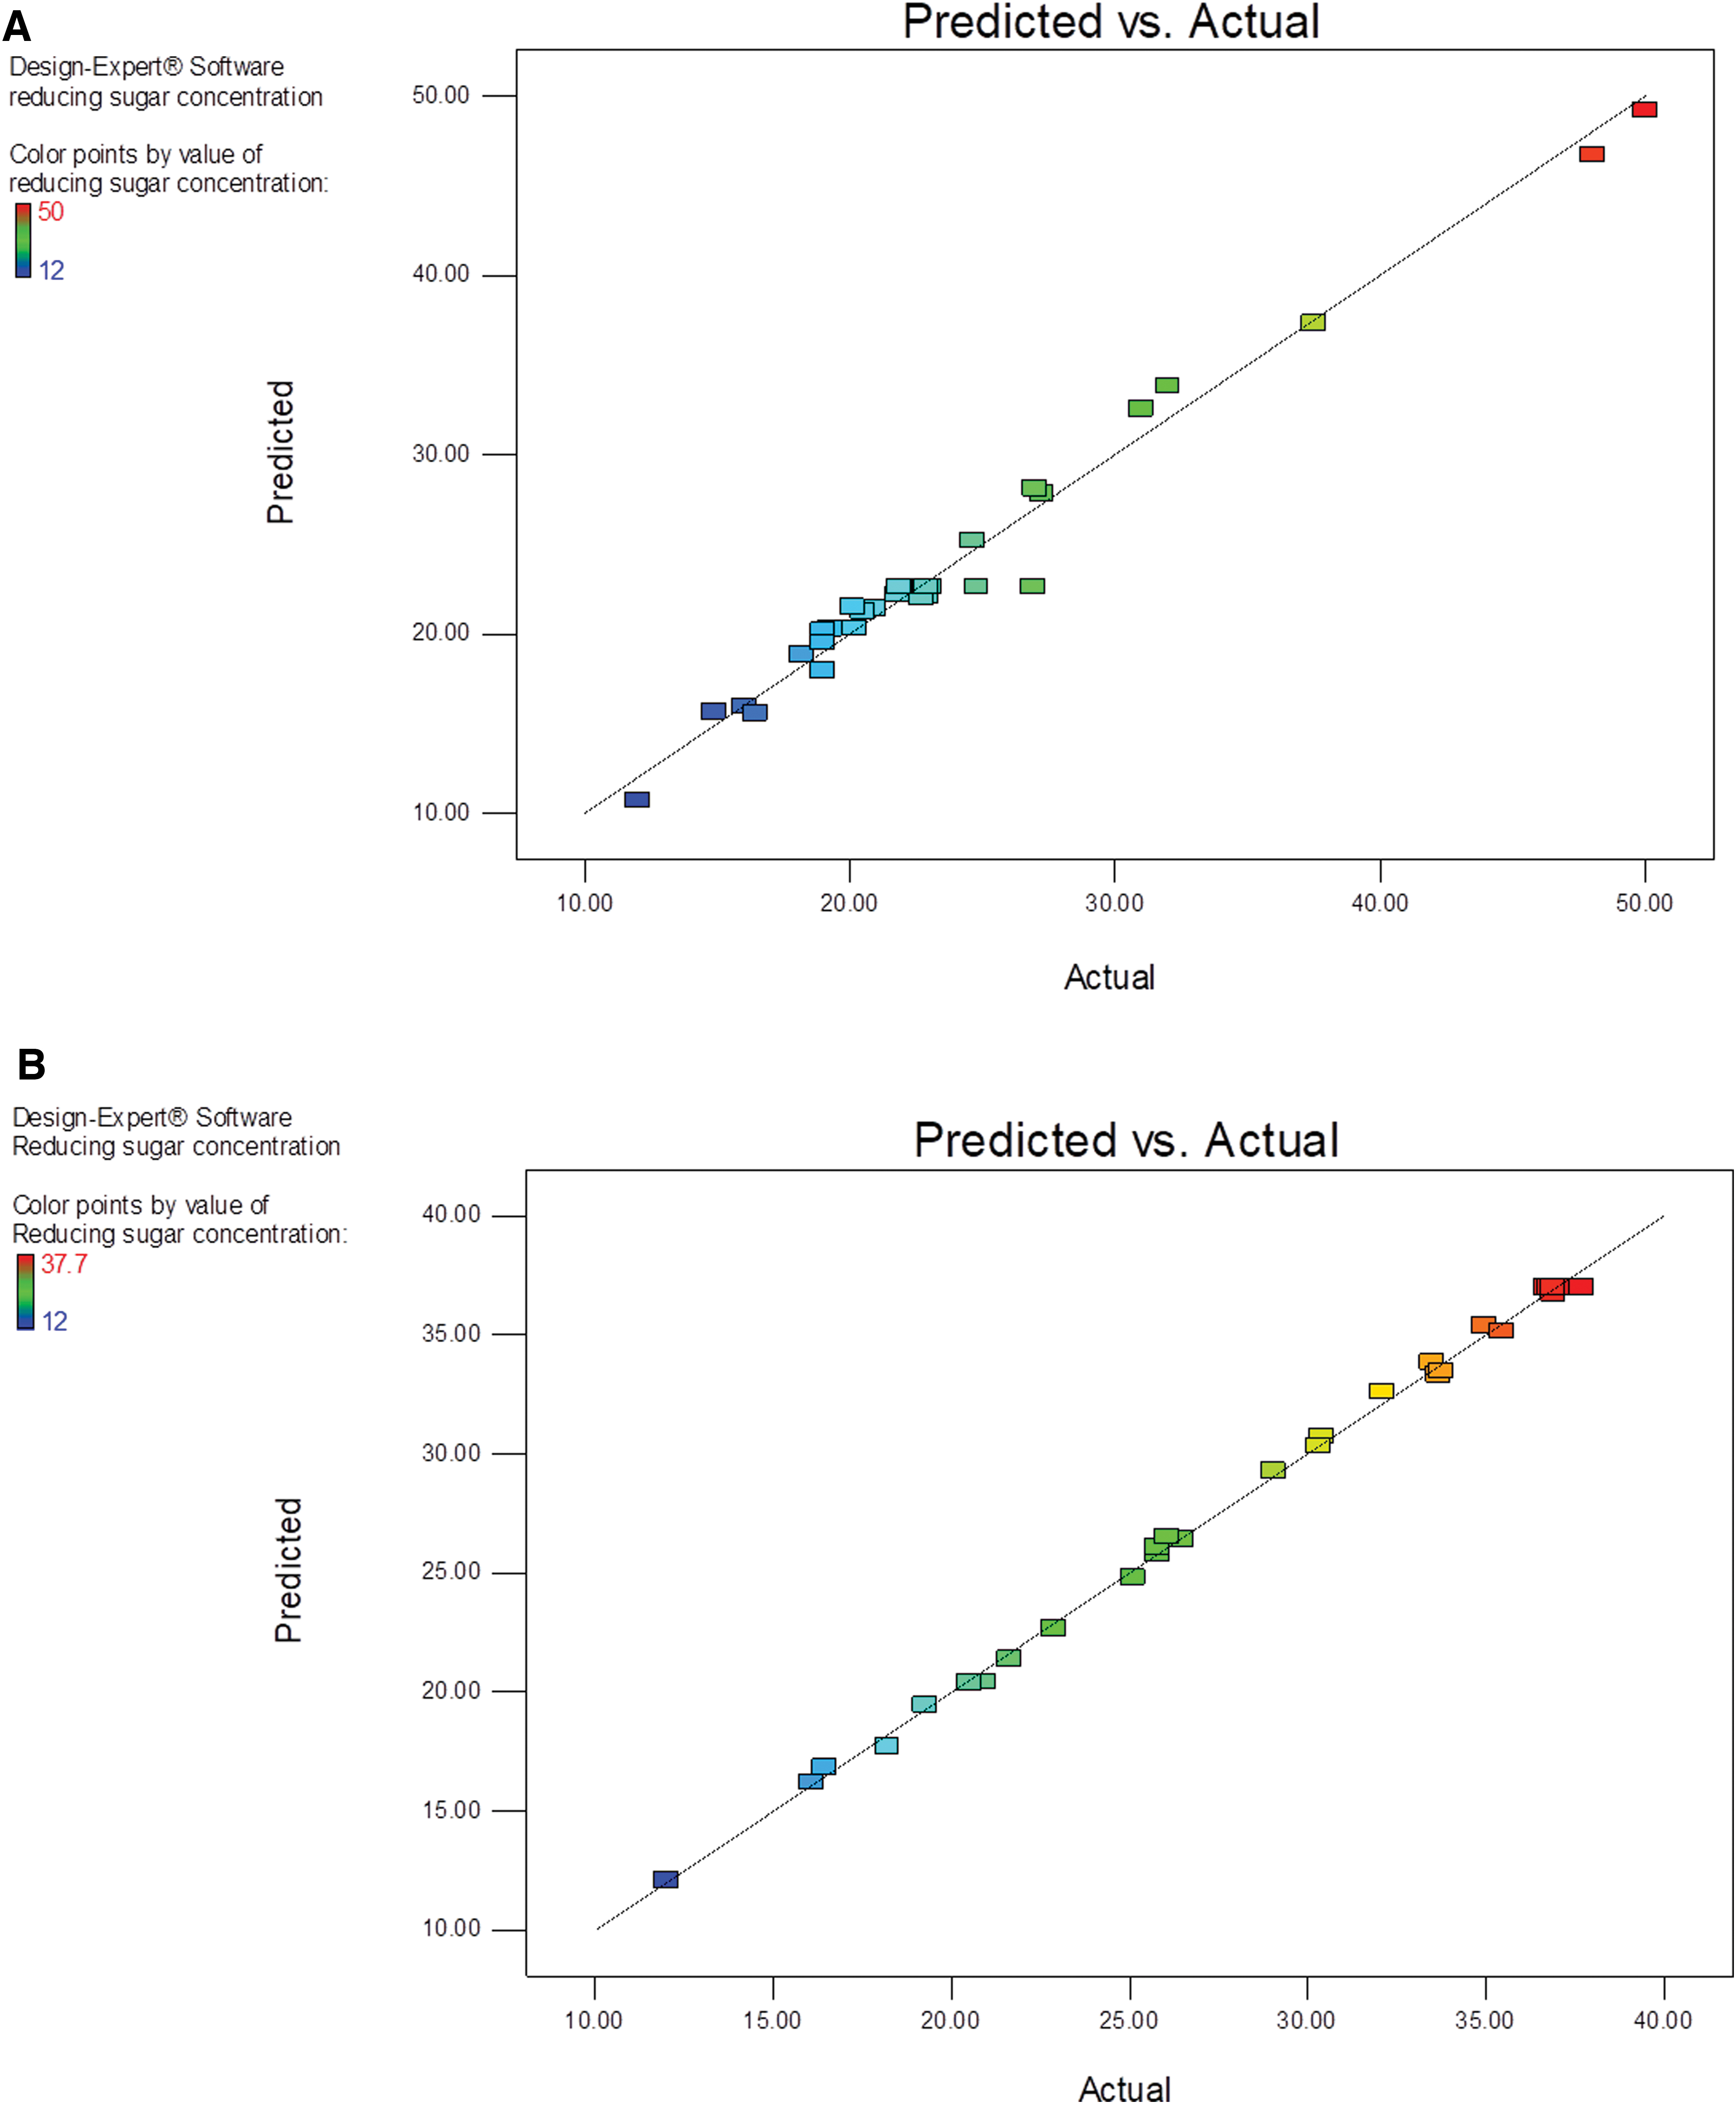
Diagnostic plot of the distribution of observed and predicted values of
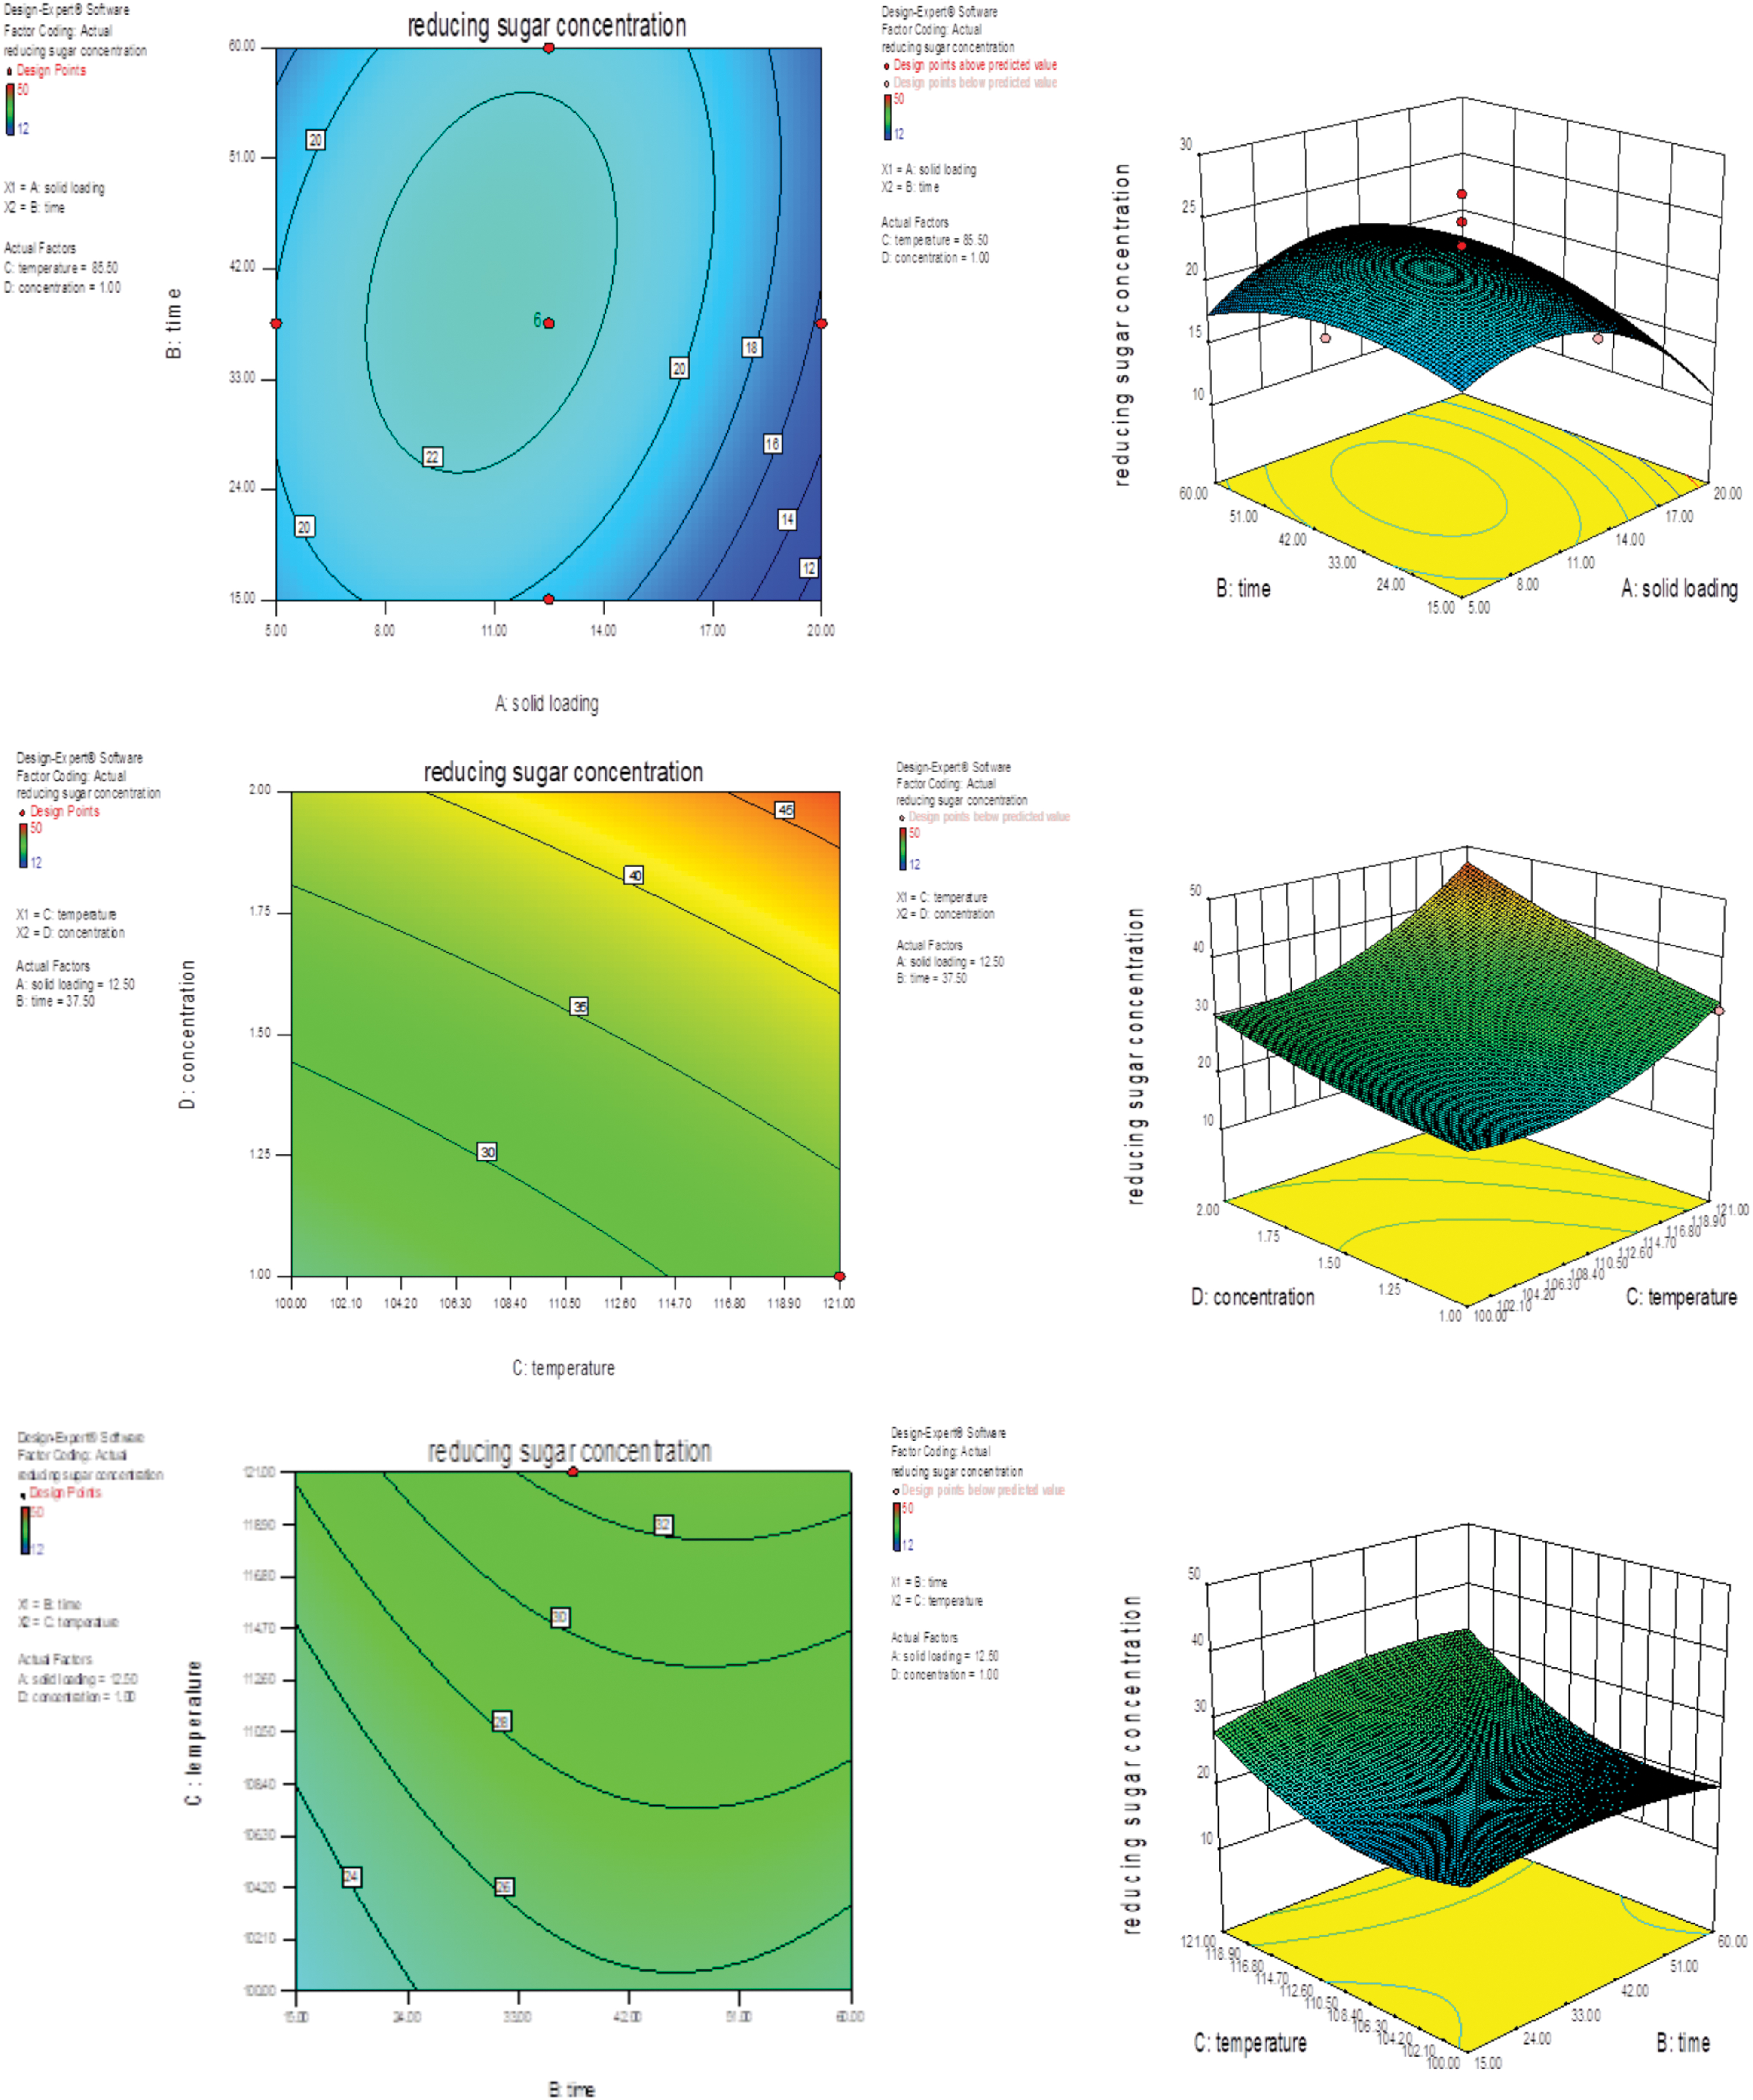
Contour and corresponding 3-D plots for hydrogen peroxide pretreatment. Color images are available online.
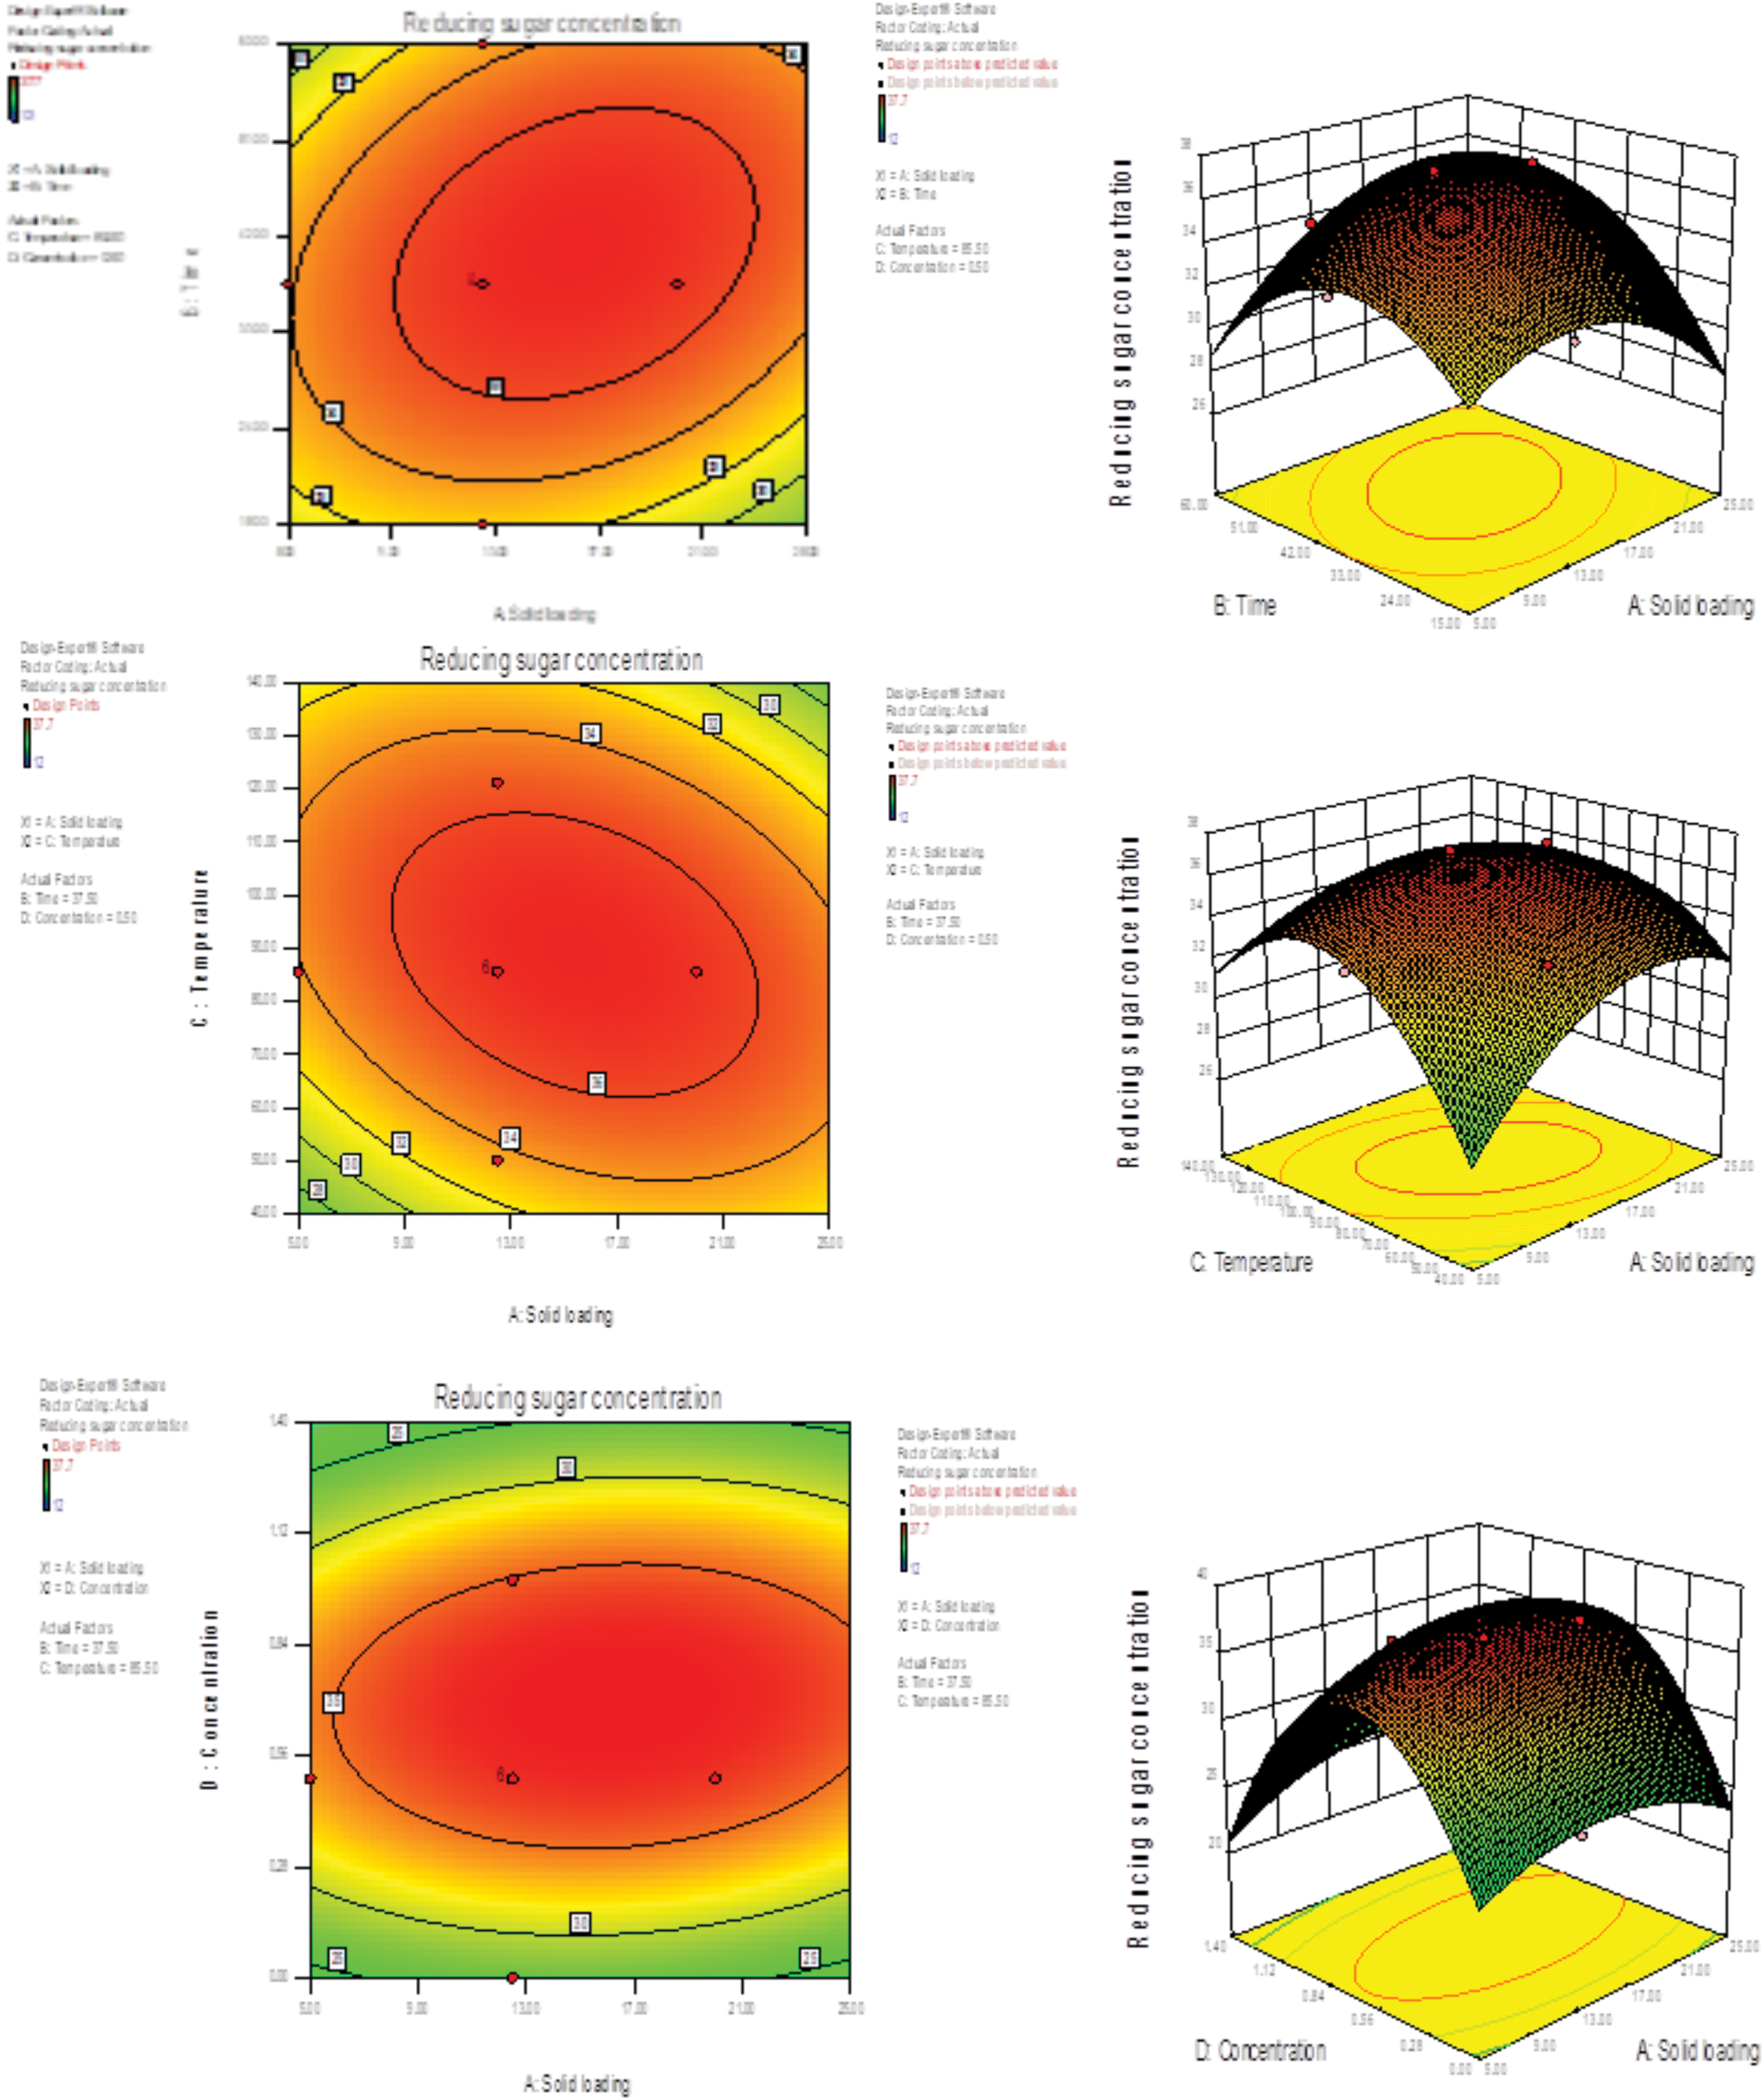
Contour and corresponding 3-D plots for sodium hydroxide pretreatment. Color images are available online.
The final optimized values of all the parameters were obtained by numerical optimization where solid loading 16.76%; time 15 min; temperature 120.97°C; and chemical concentration 2%, were found to be optimum in case of H2O2 pretreatment with reducing sugar concentration of 35.29 g L−1 (352.9 g reducing sugar kg−1 dry biomass). Similarly, in case of NaOH pretreatment, the optimized values were found to be solid loading 20.00%; time 42.51 min; temperature 84.79°C; and concentration 0.5% with reducing sugar concentration of 36.93 g L−1 (369.3 g reducing sugar kg−1 dry biomass).
Model Confirmation
Models developed by the software were validated by performing the confirmatory experiments for both the chemicals under optimized pretreatment conditions to compare the predicted values of responses. Predicted values of total reducing sugars for H2O2 and NaOH pretreatments were 33.95 g L−1 and 35.86 g L−1, respectively. Only a slight variation of 3.80% and 2.90% was observed with predicted values obtained with H2O2 and NaOH pretreatments, respectively. According to Levin et al. 39 and Guarneros-Flores et al., 40 <10 % of variation signifies the authenticity of the model. Hence, both the models developed by the software were validated.
Conclusion
Both the alkaline pretreatments offer immense potential for bioethanol production. The sugar recoveries after pretreatment with alkaline H2O2 and NaOH pretreatments under optimized conditions were found to be 352.9 and 369.3 g reducing sugar kg−1 dry biomass, respectively. Sodium hydroxide pretreatment yields enhanced enzymatic saccharification with high biomass loading. However, further studies on structural changes in biomass, techno-economic assessment and life cycle analysis are required to bring up the technology at commercial level.
Footnotes
Acknowledgments
The authors would like to thank Novozymes for providing Cellic Ctec2.
Author Disclosure Statement
No competing financial interests exist.
Funding Information
We gratefully acknowledge the Ministry of New and Renewable Energy, Govt. of India for providing funds to carry out the research activities.