
Abstract
Sugarcane bagasse (SB) consists of two major sugar polymers (cellulose and hemicelluloses) connected to lignin. Due to the recalcitrant nature of SB, pretreatment is considered a crucial process step before it can be converted to biomolecules. Raw SB consists of cellulose (40.4 wt%), hemicellulose (23.8 wt%), lignin (27.2 wt%), ash (3.0 wt%) and extractives (4.4 wt%). After pretreatment of SB with 8% sodium hydroxide at room temperature, the cellulosic fraction increased to 61.9 wt%, while hemicellulose and lignin fraction decreased to 17.1 wt% and 10.8 wt%, respectively. Design of experiment was employed to optimize FeSO4-assisted sulfuric acid hydrolysis conditions. The experimental results and predicted values showed strong agreement with high R2 value of 0.995. The highest glucose yield of 90.04% was obtained with 1.5% sulfuric acid, 40 mmol/L FeSO4 and 120 min, corresponding to predicted value of 88.98%. The optimum glucose yield was attained at high levels of FeSO4 and hydrolysis time, and a low level of sulfuric acid. After validation, the experimental and predicted values of glucose yield were 88.67% and 86.55% respectively, thus confirming the success of the optimization process. Also, the hydrolysates obtained were found to contain low amounts of inhibitory compounds (furfural and 5-hydroxymethylfurfural). Saccharomyces cerevisiae IQAr/45-1 efficiently converted the sugar present in the hydrolysate to achieve 82.2% of theoretical ethanol yield. Thus, this process, which involved the use of cheap chemical reagents to overcome SB recalcitrance and liberate fermentable sugars, could potentially support a biorefinery.
Introduction
Biorefineries that convert lignocellulosic biomass into electricity, fuel, and chemicals are a sustainable solution to the environmental problems arising from the large energy demands of modern society. 1 Lignocellulosic biomass is a low-cost and abundant bioresource that is typically composed of 40–80% cellulose, 10–40% hemicellulose, and 5–36% lignin. 2 Sugarcane bagasse (SB), like any other lignocellulosic material, is made up of two major sugar polymers: cellulose and hemicellulose. Cellulose is a linear polysaccharide and consists of D-glucose subunits linked by β-(1,4)-glycosidic bonds. 3 Hemicellulose consists of short chains of different heteropolysaccharides having different combinations of D-glucose, D-galactose, D-mannose, D-xylose, L-arabinose, D-glucuronic acid and 4-O-methyl-D-glucuronic acid. 4
Lignin is the third major component of plant cell walls, in addition to cellulose and hemicellulose, that inhibits the activities of biomass-degrading enzymes. 5 It is an aromatic polymer comprised of three mono-lignol monomers methoxylated to various degrees: p-coumaryl alcohol, coniferyl alcohol and sinapyl alcohol. 6 The joining together of the two sugar polymers (cellulose and hemicellulose) with lignin makes biomass highly recalcitrant to invading pathogens and chemicals. 7,8 Due to the recalcitrant nature of lignocellulosic biomass, pretreatment is considered a very important process step before it can be converted to biomolecules. 9
Types of pretreatments applied to lignocellulosic biomass include physical and chemical pretreatment. Physical pretreatment is primarily carried out to reduce particle size, thereby increasing the surface area and decreasing crystallinity. 10 However, the main drawback of physical pretreatment is high energy consumption. Chemical pretreatment involves the use of alkali or dilute acid. Acids such as sulfuric acid are the most widely employed for the pretreatment of lignocellulosic biomass due to its relatively low cost, but it causes equipment corrosion and results in the generation of inhibitory products, e.g., furfurals, 5-hydroxymethylfurfural (5-HMF), phenolic acids, and aldehydes. 11
Alkaline pretreatment is primarily a delignification process through which the cell wall of lignocellulosic biomass becomes deconstructed by (1) dissolving hemicelluloses, lignin, and silica; (2) hydrolyzing uronic and acetic esters; and (3) swelling cellulose under mild conditions. 12 Nonetheless, alkaline pretreatment process utilizes a large quantity of water for removing the salts from the biomass, thus resulting in high downstream processing costs. 3 Numerous studies have also been carried out on pretreatment of SB using alkali. 13 -15 For example, Rocha et al. 16 reported 92.7% lignin removal from SB after pretreatment with 1.0% sodium hydroxide solution at 100°C for I h.
Hydrolysis generally follows pretreatment and involves the breaking down of cellulose into glucose via enzymatic or chemical (dilute or concentrated acid) route. Dilute acid hydrolysis involves the use of high temperature (at least 180°C) and pressure (approximately 10 atmosphere), yet the process is characterized by low glucose yields. 17 On the other hand, cellulose hydrolysis using concentrated acid takes place at moderate temperature and pressure with higher glucose yields of approximately 90%, 18 but usually involves a longer reaction time (2–6 h). Concentrated acid hydrolysis can be carried out in two steps at normal atmospheric pressure and at temperatures below 100°C. 19 In the first step, the raw material is pretreated with 70–80 wt% sulfuric acid, mainly to break down the crystalline parts of the cellulose chains, while in the second step the acid is diluted to 20–30 wt%, preceding hydrolysis. 20 Pretreatments with the dilute acids are considered the most appropriate at industrial scale because conversions can be carried out in an economical and environmentally friendly manner. 3
The current cost of cellulosic ethanol via enzymatic route (accounting for up to 30–50% of the total cost of ethanol production) is considered prohibitive and thus unsustainable at commercial scale. 21 However, chemical hydrolysis using cheap chemicals such as sulfuric acid could be a better alternative to lower the cost of cellulosic ethanol. Reports abound in the literature on acid hydrolysis of lignocellulosic biomass, 22,23 yet Iron (II) sulfate (FeSO4)-assisted sulfuric acid hydrolysis of SB is scarcely reported. A catalyst comprised of a dilute solution of a metal salt such as FeSO4 and strong acid e.g., sulfuric acid, has been reported to lower the activation energy (i.e., temperature) of cellulose hydrolysis and consequently enhance glucose yield compared to hydrolysis with dilute acid alone. 24 Thus, FeSO4-assisted sulfuric acid hydrolysis was proposed in this study to improve the yield of glucose from SB and minimize inhibitory products generation.
In this study, design of experiment (23 full factorial designs) was used as a tool to predict and optimize FeSO4-assisted sulfuric acid hydrolysis of SB. Design of experiment is a valuable tool that can be employed to evaluate the relationship of a set of multiple variables or factors. 25
Consequently, different parameters affecting acid hydrolysis such as sulfuric acid concentration, FeSO4 concentration, and hydrolysis time, were investigated. In addition, the fermentability of the acid hydrolysate of SB was assessed by employing Saccharomyces cerevisiae IQAr/45-1.
Materials and Methods
Sample Preparation and Processing
SB was collected from Santa Cruz, a local sugar mill plant located in Américo Brasiliense, São Paulo, Brazil and stored in a laboratory freezer at −20°C. Sample was dried at 50°C to moisture of approximately 10% (w/w) in a BOD (Biochemical oxygen demand) incubator (Marconi, Piracicaba, Brazil). Dry SB samples were stored in transparent plastic bags at room temperature before use. SB was milled using ball mill with closed chamber (Marconi) and sieved using a set of three superposed sieves of different meshes (32, 35, and 150 mesh) to obtain particles of ∼0.5 mm.
SB was refluxed in a Soxhlet extraction apparatus containing a mixture of toluene:ethanol (2:1, v/v) and subsequently in water for 30 min to remove the remaining solvents before drying at 50°C to constant weight. 26 Sample was stored in plastic bag at room temperature to be used for the determination of chemical composition.
Pretreatment
15.0 g of dry SB (particle size approximately 0.5 mm) was suspended in sodium hydroxide (NaOH) solution (8%, w/v) in 250-mL Erlenmeyer flask at solid/liquid loading ratio of 1:15, as described by Laluce et al., 13 with stirring included. The flask was gently swirled to enable the dry SB to become completely soaked with the alkaline solution and kept at room temperature for reaction time varying from 1 h to 24 h with stirring (magnetic stirrer) at 60 rpm. At the end of each reaction time, sample was filtered using Whatman No. 1 filter paper. The residue on the filter paper was washed several times with deionized water to neutral pH before drying at 50°C to constant weight.
Decrease in weight of dry biomass was calculated using Equation 1 and expressed as % weight loss in biomass.
Chemical Composition of the Bagasse Samples
The chemical composition of the raw and alkaline-pretreated SB was determined using standard laboratory analytical methods. 27 Acid-insoluble lignin was measured by weighing, after drying, the residue obtained after acid hydrolysis at 105°C overnight. The fraction of acid-insoluble ash was determined by heating the samples at 550°C until a constant weight was obtained. The sugar contents in the hydrolysates (after neutralization by the addition of calcium carbonate) were analyzed by high-performance liquid chromatography (HPLC).
Acid Hydrolysis
In this work, a two-step sulfuric acid hydrolysis was performed on dry SB (10% moisture content) according to the method described by Heinonen et al., 20 with some modifications (e.g., addition of FeSO4 in the hydrolysis step). In the first step, 2.0 g of pretreated SB (8% NaOH at room temperature for 24 h) was mixed with 40 wt% sulfuric acid solution in a 250-mL round bottom flask at solid-liquid ratio (SLR) of 1:5 and allowed to stand for 1 h in an oil bath (40°C) with stirring at 60 rpm using a magnetic stirrer. After reaction, sulfuric acid concentration was diluted to the desired concentration with deionized water, and FeSO4 (desired amount) was added, initiating the hydrolysis step. The temperature was subsequently increased and maintained at 90°C for the set time duration. At the end of hydrolysis, the solid residue was separated by filtration using Whatman No. 1 filter paper and filtrate was neutralized with calcium hydroxide to pH 5.0–6.0. After filtration of the neutralized hydrolysate, the solution was analyzed for glucose, 5-HMF, and furfural.
Glucose yield (%) was calculated using Equation 2.
Experimental Design and Optimization
The influence of three independent variables—x1 (sulfuric acid concentration), x2 (FeSO4 concentration) and x3 (hydrolysis time)—on glucose yield was studied using a 23 full factorial design. Two experiments for each condition and three at the midpoint, resulting in a total of 11 experimental runs, were made to evaluate the effect of variables. The ranges of independent variable studied were sulfuric acid (1.5–4.5%), FeSO4 (0.0–40.0 mmol/L) and time (40–120 min), while temperature was fixed at 90°C during the hydrolysis step. Experimental runs were randomized to reduce the effects of unaccountable lack of consistency in the actual responses due to outlying factors. Three experiments at midpoint of the design were carried out to provide an additional level for lack of fit testing (in case all coefficients were significant) and to provide degrees of freedom for pure error estimation, due to the replication of experiments at this point. 28
For statistical analysis, the variables were coded according to Equation 3, where each independent variable is represented by xi (coded value), Xi (real value), X0 (real value at the midpoint), and ΔXi (step change value). The ranges and levels of the variables investigated in this study are given in Table 1. Low and high factor levels were coded as -1 and +1; the midpoint was coded as 0.
Experimental Range and Levels of the Process Independent Variables Evaluated for FeSO4-Assisted Sulfuric Acid Hydrolysis of Pretreated SB, According to a 23 Full Factorial Design
The glucose yield (%) was taken as the dependent variable or response of the design experiments. The results were subjected to an analysis of variance (ANOVA), and the response and variables (in coded unit) were correlated by the response surface analysis to obtain the coefficients of Equation 4.
y = β0 + β1x1 + β2x2 + β3x3 + β12x1x2 + β13x1x3 + β23x2x3 (Equation 4)
where y is the predicted response; β0 is the constant term; β1, β2 and β3 are the regression coefficients for the linear effect terms; β12, β13 and β23 are the interaction effects; x1, x2 and x3 are the coded levels of the independent variables (sulfuric acid, FeSO4 and time).
The significance of each term for the response was also evaluated by observing the F-ratio, where the probability (p) is <0.05. The adequacy of the model was determined using model analysis, a lack-of-fit test and coefficient of determination (R 2 ) analysis. For experimental design matrix, data analysis, fitting models, regression and surface plots, Statistica 10.0. (StatSoft) software was used.
Fermentation
S. cerevisiae IQAr/45-1 is a thermotolerant ethanologenic yeast strain obtained from the hybridization of parental strains of S. cerevisiae and three Brazilian industrial strains (PE-2, CAT-1, SA-1) during fermentation of non-sterilized molasses. 29 This strain can only ferment hexose sugars, and it was maintained in medium containing 30.0 g/L glucose, 3.0 g/L yeast extract, 5.0 g/L peptone and 20.0 g/L agar at pH 6.0 ± 0.2 and temperature 30°C. Starter culture was developed by growing the cells at 30°C for 24 h in a culture medium containing 30.0 g/L glucose, 3.0 g/L yeast extract, and 5.0 g/L peptone at pH 6.0 ± 0.2.
The fermentation of acid hydrolysate of pretreated SB (pH 6.0 ± 0.2) was carried out in 125-mL Erlenmeyer flask with a working volume of 50 mL supplemented with 3 g/L of yeast extract. It was inoculated with S. cerevisiae (10.0% v/v) at optical density (OD600) of 0.6 and incubated at 30°C for 24 h with shaking at 150 rpm. 30 Thereafter, samples were collected and centrifuged at 10,000 g for 15 min at 4°C. Cell-free supernatant was used to determine the ethanol and residual sugar concentration.
Fermentation parameters were calculated
31
using the following:
where YP/S is the ethanol yield; Ei and Ef are the ethanol concentration at the beginning of the fermentation and the end of the fermentation (g/L) respectively; and Si and Sf are the total sugar concentration at the beginning of the fermentation and the end of the fermentation (g/L), respectively.
where QPp is the volumetric ethanol productivity (g/L/h); Ei and Ef are the ethanol concentration at the beginning and end of fermentation (g/L), respectively; and t0 and tf are the fermentation time at the beginning of the fermentation and the end of the fermentation (g/L), respectively.
where YX/S is the biomass yield; Xi and Xf are the biomass concentration at the beginning of the fermentation and the end of the fermentation (g/L), respectively; and Si and Sf are the total sugar concentration at the beginning of the fermentation and the end of the fermentation (g/L), respectively.
where QPx is the biomass productivity (g/L/h); Xi and Xf are the biomass concentration at the beginning and end of fermentation (g/L), respectively; and t0 and tf are the fermentation time at the beginning of the fermentation and the end of the fermentation (g/L), respectively.

where theoretical yield is equivalent to 0.511 g/g.
Analytical Procedures
Concentrations of monomeric sugars (glucose, xylose and arabinose) in the soluble fraction were determined by HPLC using a BIO-RAD HPX-87H column at 45°C eluted at 0.6 mL/min with 5 mM sulfuric acid. Sugars were detected with a temperature-controlled RI detector. For the determination of furfural and 5-HMF, the following conditions were used: Column Kinetex Phenomenex, C18, 5 μm, 100 A, 150 x 4.6 mm; oven temperature 25°C; ultraviolet detector (SPD-20A) at 208 nm, mobile phase acetonitrile/water (1:8) with 1% acetic acid and flow rate 0.8 mL/min. Before injection samples were filtered in PTFE VertiPure (polytetrafluorethylene) syringe filters with pore size 0.45 μm and diameter 13 mm. All the standard calibration curves for HPLC analysis (R 2 > 0.996) were used for the calculation.
Ethanol in the fermentation broth was quantified using GC-2010 Plus gas chromatograph coupled to a QP2010 mass spectrometer and equipped with an autosampler model AOC-6000 system (Shimadzu, Tokyo, Japan). The capillary column used was a Zebron ZB-WAX (15 m × 0.25 mm × 0.25 μm) (Phenomenex Torrance, CA, USA), maintained at 35°C. Helium (purity 99.999%) was used as carrier gas at a flow rate of 1.2 mL/min and for injection of the samples a split injection port was used, operating at 220°C and with a split ratio of 1:100. The mass spectrometer, equipped with an electron impact (EI) source, was operated in selected ion monitoring (SIM) mode at 70 eV electron energy and the mass fragments used in the analysis were m/z 46.0, 45.0 and 31. The temperatures of the ion source and transfer line were 230°C and 220°C, respectively. The solvent cut time was 1 min and the time of analysis was 3 min. The autosampler operating in a headspace mode used an incubation temperature of 65°C and incubation time of 5 min. The sample volume used by sampler was 2,500 μL and the headspace volume injected was 500 μL.
The quantification of ethanol was made by analytical curve method using standard solutions in the range of 1.03 to 50.50 mmol/L (47.4 to 2369.0 ppm), made in triplicate. The last solution in the analytical curve range was used as stock solution to produce the less concentrated solutions, by dilution with deionized water. The stock solution was made by adding ethanol (Honeywell/Riedel-de-Haën, 99.9%) to deionized water. For sample solutions, 200 μL of solutions from fermentation broth was added to deionized water, totalling a final volume of 2500 μL.
The total reducing sugars (TRS) was estimated by the DNS method, 32 and the calibration curve was obtained using glucose as a standard. Cell concentration (g/L) was determined by turbidimetry and calculated from a standard curve made by plotting dry weight of cells versus optical density at 600 nm. All chemicals used in experiments were of analytical and microbiological grade. All analytical determinations were performed in triplicate (average results are shown).
Results and Discussion
Chemical Composition of Raw and Pretreated Sugarcane Bagasse
Milling was employed mainly to reduce the particle size of SB (approximately 0.50 mm), resulting in an increase in surface area and decrease in crystallinity. 33 Table 2 shows the result of alkaline pretreatment of SB with 8% NaOH at different reaction time. The yield of dry solid residues decreased as the reaction time increased, whereas the weight loss in biomass (%) increased from 25.9% to 37.6% as the reaction time was increased from 1 h to 24 h. The lowest weight loss in biomass (25.9%) was obtained after 1 h, while the highest weight loss in biomass (37.6%) occurred after 24 h. Besides, weight loss in biomass increased slowly after 6 h of reaction time. This suggests that after 6 h of reaction time, major parts of lignin in SB might have been solubilized in the NaOH solution. Alkaline pretreatment has been reported to promote the cleavage of intermolecular ester linkages between hemicelluloses and lignin, resulting in the solubilization of lignin and hemicellulose fragments in the alkaline solution. 34 Thus, 6 h was selected as the optimum time for pretreatment of SB, taking into account the energy cost associated with the process.
Effect of Reaction Time on the Yield of Dry Solid Residues and Weight Loss in Biomass (%) During Pretreatment of SB with 8% NaOH (w/v) at Room Temperature
Data are Mean ± SD, n = 3.
The chemical composition of raw and pretreated SB is presented in Table 3. The raw SB used in this study consists of cellulose (40.4 wt%), hemicellulose (23.8 wt%), lignin (27.2 wt%), ash (3.0 wt%) and extractives (4.4 wt%), which is consistent with the values reported by other authors. 35,36 However, after pretreatment, the cellulosic fraction of SB increased to 61.9 wt%, while the hemicellulose and lignin fractions decreased to 17.1 wt% and 10.8 wt% respectively. Also, the ash content of SB increased to 5.3 wt% after pretreatment. The increase in cellulosic fraction after pretreatment is mainly attributed to lignin and partly hemicellulose removal from SB. Maryana et al. 37 reported 56.3% of cellulose yield after pretreatment of SB in 8% NaOH solution at 100°C for 40 min. Also, Talha et al. 38 reported cellulose yield of 58.6% after pretreatment of SB with 4% NaOH in autoclave at 100°C and 1 bar pressure for 45 min. Thus, the cellulose yield (61.7 wt%) obtained in this study is comparatively higher than the values reported by other authors as mentioned above, despite the low temperature condition used. This suggests that the incorporation of stirring via magnetic stirrer to the process enhanced the contact between SB and the alkaline solution, thereby increasing delignification.
Chemical Composition of Raw and Pretreated Sugarcane Bagasse
Data are Mean ± SD, n = 3, NA: not analyzed.
Glucose Yields and the Inhibitory Products Formation
Glucose yields obtained from the FeSO4-assisted sulfuric acid hydrolysis of SB under different sulfuric acid concentrations, FeSO4 concentrations, and hydrolysis time are presented in Table 4 for the eleven experimental runs. The highest glucose yield (90.04%) was obtained under hydrolysis conditions of sulfuric acid (−1), FeSO4 (+1) and hydrolysis time (+1), while the lowest yield of glucose (52.88%) occurred at sulfuric acid (−1), FeSO4 (0) and hydrolysis time (−1). The yields of glucose obtained varied from 52.88% to 90.04%. A similar value of glucose yield (88%) was reported by Kong-Win et al. 23 after a two-step hydrolysis of cellulose with 72% sulfuric acid, followed by neutralization with 40 wt% NaOH solution and subsequent post hydrolysis at 121°C for 10 min. Furthermore, the experimental values of glucose yield were closely related to the predicted response values, indicating a high degree of precision and reliability in the conducted experiments.
Experimental Matrix with the Coded Levels of the Variables and Measured and Predicted Values of Response (Glucose Yield) After Acid Hydrolysis of Pretreated Sugarcane Bagasse
Data for the Measured Glucose Yield (%) are Mean ± SD, n = 3.
It was observed that at decreasing acid concentration, increases in FeSO4 concentration and reaction time resulted in increased glucose yield. The increased contact between Fe2+ ions and cellulose at low acid concentration might have contributed to improved hydrolysis efficiency. This could be attributed to the catalytic activity of FeSO4, which results in decreases in the activation energy of cellulose hydrolysis. 24 Li et al. 39 reported improvement in the efficiency of FeCl3-catalyzed acid hydrolysis of microcrystalline cellulose at low acid concentration. On the other hand, lower yields of glucose were obtained in the absence of FeSO4, suggesting that some part the amorphous cellulose was hydrolyzed. Generally, high glucose yields can be attributed to the initial pretreatment applied to SB, which resulted in cellulose enrichment and removal of significant part of lignin. Other authors also reported the importance of pretreatment step in obtaining higher glucose yield from lignocellulosic biomass. 40
The inhibitory compounds (furfural and 5-HMF) generated during acid hydrolysis are presented in Table 5. The concentrations of furfural and 5-HMF in the acid hydrolysates ranged from 1.20 to 12.50 mg/L and 0.45 to 4.60 mg/L, respectively. Other authors reported 124.54 mg/L of 5-HMF and 978 mg/L of furfural from acid hydrolysis of sweet sorghum bagasse under conditions of 1.75% sulfuric acid, 121°C and 40 min. 22 Thus, the relatively low concentrations of furfural and 5-HMF obtained in this study suggest that the mild hydrolysis condition (90°C) applied during hydrolysis might have played a role in mitigating the decomposition of pentoses and hexoses into degradation products.
Effects of FeSO4-Assisted Sulfuric Acid Hydrolysis on 5-HMF and Furfural Generation from Sugarcane Bagasse
Data are mean ± SD, n = 3.
Optimization and Validation of the Experimental Model
The 23 full factorial design experiments for FeSO4-assisted sulfuric acid hydrolysis of pretreated SB, based on three independent factors with a two-level structure, resulted in 11 experimental runs. The wide range of glucose yields (52.88 to 90.04%) indicates the need to optimize acid hydrolysis conditions. Glucose yield was chosen to be the response (dependent variable). The linear model equation (Equation 10), obtained from the experimental results, is expressed as coded units, which is used to explain the relationship between the independent variables (sulfuric acid, FeSO4 and hydrolysis time) and dependent variable (glucose yield):
y = 66.37 − 1.19x1 + 8.40x2 + 6.04x3 − 3.9x1x2 − 0.22x1x3 + 3.47x2x3 (Equation 10)
When the values x1, x2 and x3 are substituted in the above equation, the predicted values displayed strong agreement with the measured values of glucose yield derived from the experimental results. The coefficient of the linear terms of sulfuric acid (x1), FeSO4 (x2) and hydrolysis time (x3) shows the effect of that particular factor for the acid hydrolysis. Similarly, the coefficient multiplied by two factors, such as x1x2, x1x3 and x2x3 represents the interaction effects on the responses. A positive sign indicates a synergistic effect, while a negative sign indicates an antagonistic effect. Thus, FeSO4 and hydrolysis time as well as their interactions exhibited synergistic effects on the response (glucose yield). On the other hand, sulfuric acid and its interaction with FeSO4 and hydrolysis time displayed antagonistic effects on the response. These suggest that glucose yield can be optimized by reducing sulfuric acid concentration, while simultaneously increasing both FeSO4 and hydrolysis time.
Analysis of Variance
Table 6 shows the ANOVA results for the acid hydrolysis of pretreated SB. The p-values (probability values) are used as tools to check the significance of each of the coefficients in the model, which in turn, may indicate the patterns of the interaction among the variables. The smaller the p-value, the more significant the corresponding coefficient.
ANOVA Results for Glucose Yield, R-sq = 0.9951, R-sq(adj) = 0.9838
SS: sum of squares; df: degree of freedom; MS: mean square; F-value:
Fisher distribution; p-value: probability value.
In the ANOVA Table, the model p-value of 0.002 (< 0.05) and p-value of 0.490 (> 0.05) for lack of fit suggest that the model fitted adequately to the experimental data. Among the three main effects, FeSO4 (x2) and hydrolysis time (x3) were significant (p-values <0.05) on the response (glucose yield), whereas sulfuric acid (x1) was insignificant (p-value >0.05). This suggests that glucose yield was directly connected to these two main factors (FeSO4 and hydrolysis time). Similarly, the response levels of the interaction effects of sulfuric acid*FeSO4 (x1x2), and FeSO4*hydrolysis time (x2x3) are also significant (p-values <0.05), while the interaction effect of sulfuric acid*hydrolysis time (x1x3) was insignificant (p-value >0.05).
According to Pareto analysis (Fig. 1), the effects of variables on glucose yield (%) were ranked as follows: FeSO4 (16.33) > hydrolysis time (11.76) > sulfuric acid*FeSO4 interaction (7.61) > FeSO4*hydrolysis time interaction (6.75) > sulfuric acid (2.32) > sulfuric acid*hydrolysis time interaction. The correlation between the Pareto analysis of effects and ANOVA results confirms the adequacy and fitness of the model.
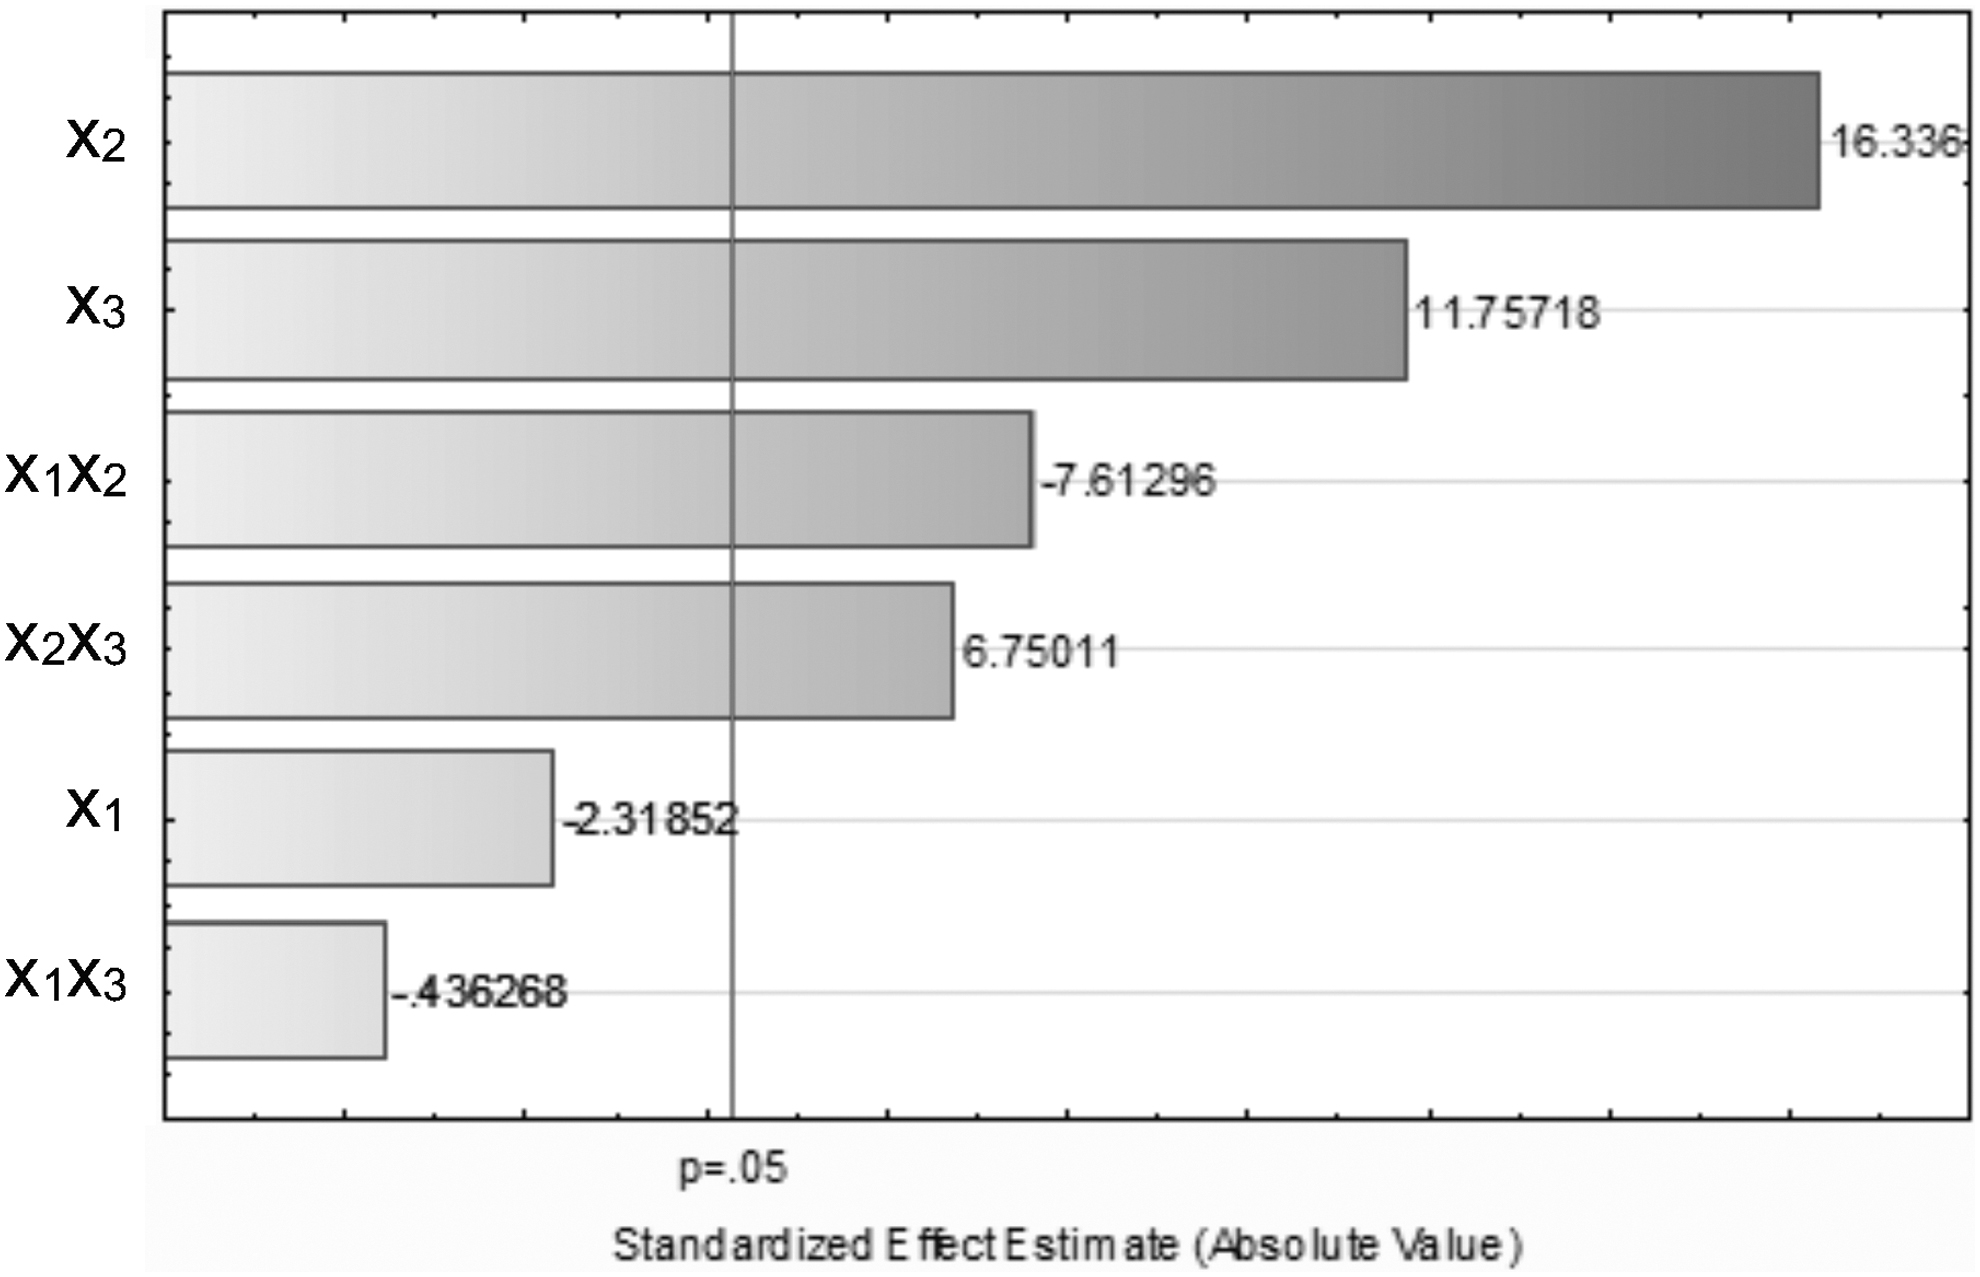
Graph of Pareto analysis ranking the effects of individual factors on glucose yield (%).
Effect of Independent Variables
Response surface curves were plotted to examine the effect of the interaction between the independent variables and to determine the optimum levels of the variables. The independent variable interactions are illustrated by surface plots, as shown in Fig. 2a-c. In each surface plot, two variables are altered, while the third variable is fixed at a constant value of zero coded level. Glucose yield (%) is represented as a function of sulfuric acid and FeSO4, or hydrolysis time.

Surface plots of glucose yield (%) as a function of
Figure 2a shows the combined effect of FeSO4 and sulfuric acid on the glucose yield when hydrolysis time was fixed. As expected, increases in FeSO4 concentration led to corresponding increases in glucose yield, whereas higher sulfuric acid concentrations exhibited negative effect on hydrolysis efficiency. FeSO4-assisted sulfuric acid hydrolysis may likely target multiple chemical sites in plant cell wall polymer networks, including the C-O-C via acid-base reactions and C-H bonds in cellulose via redox reactions. 41 Thus, supplementation of sulfuric acid with FeSO4 is expected to enhance the cleaving of C-H bonds in cellulose by Fe2+ ions during hydrolysis and eventually results in the release of sugars.
The combined effects of FeSO4 concentration and hydrolysis time on glucose yield are shown in Fig. 2b. A substantial increase in glucose yield occurred by increasing FeSO4 concentration and hydrolysis time. The gradual increases in hydrolysis time allowed more Fe2+ ions to interact with cellulose. Consequently, more C-H bonds in the cellulose were cleaved, resulting in higher glucose yield. Furthermore, the Fe2+ ions can absorb oxygen atoms of the glucose unit in cellulose to form an intermediate complex, thereby lowering the activation energy and increasing hydrolysis efficiency. 42
Fig. 2c shows the combined effect of sulfuric acid and hydrolysis time on glucose yield at a fixed FeSO4 concentration. Here it can be seen that glucose yield depends strongly on the hydrolysis time, with a higher hydrolysis time increasing hydrolysis efficiency. On the other hand, a higher sulfuric acid concentration displayed a negative effect on hydrolysis efficiency. However, the negative effect of sulfuric acid was almost eliminated at a higher hydrolysis time. Thus, maximum glucose yield can be achieved by increasing hydrolysis time and decreasing sulfuric acid concentration. This suggested that as hydrolysis time increases, the contact time of the acid with cellulose increases, thereby enabling the amorphous part to be hydrolyzed by the acid. 43
As shown in Fig. 2a-c, the optimum glucose yield was mainly influenced by the FeSO4 concentration and hydrolysis time. A possible explanation is that at increased hydrolysis time, more Fe2+ ions are able to diffuse into the amorphous and crystalline region of the cellulose and cleave the glycosidic bonds, resulting in the degradation of cellulose. Besides, Li et al. 39 reported improvement in the efficiency of FeCl3-catalyzed acid hydrolysis of microcrystalline cellulose at low acid concentration. Other authors reported a maximum glucose yield of 67.3% from SB hydrolyzed with 0.28% sulfuric acid at 210°C for 6 min, 44 which is considerably lower than the maximal glucose yield of 90% obtained in this study. Thus, the addition of FeSO4 as a co-catalyst in the dilute sulfuric acid hydrolysis of SB significantly contributed to improving glucose yield.
Determination of Optimal Point and Model Verification
The optimal point for maximal yield of glucose (90.04%) based on the statistical model was found to be 1.5% of sulfuric acid (X1 = -1), 40 mmol/L of FeSO4 (X2 = 1) and 120 min of hydrolysis time (X3 = 1). At these conditions, the model predicted value of glucose yield was 88.98%.
To verify the model's (Equation 10) adequacy in predicting maximum glucose yield, three replicates of experiments were performed using the optimal hydrolysis conditions (1.55% sulfuric acid, 40 mmol/L FeSO4 and 120 min) provided by the desirability function. According to Table 7, a new experimental value of 88.67% was obtained for glucose yield, with predicted value of 86.55%. As can be observed, the experimental value of glucose yield showed a strong agreement with the predicted value, thus confirming the success of the optimization process. Therefore, design of experiment is an effective tool that can be employed to optimize FeSO4-assisted sulfuric acid hydrolysis of SB.
Optimal Values of the Independent Variables, Experimental, and Predicted Glucose Yield
Data are Mean ± SD, n = 3.
Fermentation
The acid hydrolysate obtained from FeSO4-assisted sulfuric acid hydrolysis of SB was neutralized, concentrated and fermented using S. cerevisiae-IQAr/45-1 at initial low cell density. S. cerevisiae ferments hexose sugars with high efficiency because of its high ethanol tolerance and fermentation rates, hence yielding ethanol close to the maximum theoretical yield (0.51 g/g hexose sugar consumed). 45
According to Table 8, increases in time resulted in decreases in TRS with corresponding increases in ethanol levels, thus demonstrating that sugars in the acid hydrolysate were readily converted into ethanol. The levels of ethanol rose very slowly during 4 h of fermentation as the yeast strain was in the lag phase for a short adaptation to the new environment. 46 Subsequently, ethanol levels rose to a maximum level of 6.27 g/L after 12 h, while the levels of biomass formation increased throughout the period of fermentation, reaching a maximum level of 2.75 g/L after 24 h. The maximum ethanol yield (0.43 g/g) and productivity (0.56 g/L/h) was obtained after 8 h of fermentation, whereas the maximum biomass yield (0.26 g/g) and productivity (0.19 g/L/h) was obtained after 4 h. The lowest ethanol yield and productivity—0.23 g/g and 0.18 g/L/h, respectively—was obtained after 24 h.
Fermentation Profile of S. cerevisiae on Acid Hydrolysates of SB After 24 h
Data are Mean ± SD, n = 3.
The maximum ethanol level (equivalent to 82.2% of theoretical ethanol yield) obtained in this study is relatively higher than the theoretical ethanol yield of 78.47% reported in the literature. 47 Also, Pitarelo et al. 48 reported ethanol yield of 0.45g/g (equivalent to 88% of theoretical ethanol yield) from enzyme-hydrolyzed SB pretreated with phosphoric acid-catalyzed steam explosion at 180°C for 5 min. Biomass production correlated with the sugars consumption during 24 h of fermentation, and this finding is similar to those reported by other authors. 30,49 However, a significant amount of TRS (6.83 g/L) remained after 24 h, presumably xylose, which could be attributed to inability of S. cerevisiae to metabolize pentose sugars. 50
Interestingly, no inhibitory effect from furfural and 5-HMF was observed on S. cerevisiae, since it efficiently consumed the sugars present in the acid hydrolysate. The lack of inhibitory effects of furfural and 5-HMF are mainly due to its presence at very low concentrations. But, concentrations of furans and phenolic compounds above 0.3 g/L have been reported to adversely affect growth and ethanol production rate in S. cerevisiae during fermentation. 51
Conclusion
SB was first subjected to alkaline pretreatment to obtain enriched-cellulosic fraction prior to acid hydrolysis. Design of experiment was an efficient tool for optimizing FeSO4-assisted sulfuric acid hydrolysis of SB. It was found that 40 mmol/L FeSO4 and 120 min of hydrolysis time were the most significant parameters in the acid hydrolysis process. Hydrolysates contained very low amounts of inhibitory compounds (furfural and 5-HMF), and were successfully fermented by S. cerevisiae with high ethanol yields.
However, the sugar concentration resulting from FeSO4-assisted sulfuric acid hydrolysis was low, thereby giving rise to water-evaporation costs. Thus, methods allowing a higher starting biomass loading would help to overcome this problem. Consequently, this study, which involves the use of simple chemical reagents to overcome biomass recalcitrance and liberate valuable sugars, has the potential to support a biorefinery.
Footnotes
Acknowledgments
The authors would like to thank the National Institute of Alternative Technologies for Detection, Toxicological Evaluation and Removal of Micropollutants and Radioactivies (INCT-DATREM) (FAPESP: 2014/50945-4, CNPq 465571/2014-0) for the GC-MS.
Author Disclosure Statement
No competing financial interests exist.
Funding Information
The authors would like to thank Coordenação de Aperfeiçoamento de Pessoal de Nível Superior (CAPES) for the financial support.