
Abstract
This study proposes a new Cluster Quotient (CQ) to highlight the cluster characteristics and their effect on regional innovation systems based on all US Metropolitan Statistical Areas (MSAs) in 2014. This study finds that San Diego, CA plays an important role in biotechnology industries, and the CQ index would be a better method to measure the degree of clusters than the Location Quotient index (LQ) given that the CQ method is based on the definition of a cluster and strongly correlated with high industry quotient MSAs. The study also highlights that biotechnology clusters have a positive impact on patents. An increase of 1% of the CQ generates an increase of 0.25% of patents. The result highlights that biotechnology clusters play an important role in regional innovation systems and need to be seriously taken into consideration in the field of urban planning.
Introduction
Biotechnology has become a major engine for national and urban competitiveness in the twenty-first century. Biotechnology is seen as a key technology for future growth and competitiveness by policymakers. 1 –4 Biotechnology is a knowledge-driven sector because it consists of working knowledge to create value, decoding genomics and proteomics and being a paradigmatic knowledge-based economic activity. 5 –7
Biotechnology industries are also among the most innovative and important economic drivers in our contemporary world. 8 –13 For example, the European biotechnology economy employs approximately 22 million people and generates income of €2 trillion. 14 In the United States, the biotechnology economy accounts for over 16 million jobs and an additional 5 million jobs due to the economic multiplier effect. The highly skilled nature and demand for bioscience jobs supports a wage growth that well outpaces that of the private sector, increasing by 13.1% in real terms since 2001, compared with just 4.4% pay raises among all other industries. 15
However, in spite of the importance of biotechnology, prior studies on biotechnology industries mostly have centered on Europe, other countries, some specific regions in the United States (such as one state), or one Metropolitan Statistical Area (MSA). 16 –19 For example, Segers highlights how biotechnological firms play an important role in open innovation by clustering and intensive partnering to innovative with knowledge. 18 Abbasiharofteh and Broekel report that the role of biotechnology clusters for evolution of knowledge networks in Berlin between early 1990s and 2016. 16 Sengoku highlights a unique and optimal innovation model for regional biotech industry to develop start-up firms and entrepreneurs from the perspective of regional innovation systems in Japan. 20
Not only that, while many scholars have focused on the relationship between biotechnology and regional innovation systems, it is still unclear how biotechnology industries play an important role in regional innovation systems in the whole US. 21 –27 For example, Zhang highlights the relationship between the development of biotech and regional innovation systems in Shanghai, China. 27 Kolympiris et al. show that location-specific factors, such as proximity to the funding venture capital and certain knowledge assets, play a crucial role in the location choice for biotechnology firm in the US. 22 Petruzzelli et al. reveal that the use of scientific knowledge is negatively associated with patent influence outside the biotechnology industry, whereas it is positively related to make a patent more relevant for the assignee's next technological developments. 23
This study, therefore, explores the cluster characteristics of biotechnology industries and their effect on regional innovation systems in all US MSAs in 2014. This study proposes a new cluster index called CQ (Cluster Quotient) to measure the magnitude of clusters in the US MSAs given that the LQ (Location Quotient), which is the most frequent index for finding clusters, fails to reflect the number of industries that is directly related to the definition of a cluster into the index. 28 –36 This study highlights the spatial patterns of biotech clusters in the US MSAs by each field with the new CQ index.
Next, the study employs ten econometric models to examine how biotechnology industries play an important role in regional innovation systems in the US. To grasp the relationship between biotechnology industries and regional innovation systems, the study uses patent data released by the US Patent and Trademark Office as a proxy variable of regional innovation systems. While one may say patent data cannot represent regional innovation systems, patent data has been one of the successful indices as a proxy variable of the regional innovation output. 37 –43 Therefore, the study employs ten log-linear Cobb-Douglas regression models for the patent data to estimate the effect of biotechnology industries on regional innovation systems in US MSAs data in 2014. To the best of my knowledge, it is the first attempt in the field of biotechnology to explore the cluster characteristics of biotechnology industries based on the whole number of firms and workers and their effect on regional innovation systems in the US, using all US MSAs data.
Materials and Methods
To shed light on biotechnology industries, this study first explores the definition of biotechnology. The word biotechnology is a cross between the Greek words “bios,” which means everything to do with life, and “technikos,” which means involving human knowledge and skills. 14 Biotechnology is not a category used by government statistical agencies in collecting or reporting economic data. 44,45 Therefore, there is no single definition of biotechnology industries. Against this backdrop, some organizations try to define the fields of biotechnology industries by important policy implications. For example, OECD defines biotechnology as the application of science and technology to living organisms, as well as parts, products, and models thereof, to alter living or non-living materials for the production of knowledge, goods, and services. 46 The Biotechnology Innovation Organization (BIO) classifies biotechnology industries into five key components: agricultural feedstock and chemicals; biotechnology-related distribution; drugs and pharmaceuticals; medical devices and equipment; and research, testing, and medical laboratories. 15
This study, however, does not follow the classification of BIO but suggests a new classification of biotechnology industries due to limitations of BIO's method. First, some industries in BIO's classification are difficult to categorize as biotechnology industries and are thus roughly classified. For instance, BIO suggests research and development in the physical, engineering, and life sciences (North American Industry Classification System (NAICS) code: 54171) is characterized as biotechnology industries, but it would be better to include research and development in biotechnology (NAICS code: 541711) in the biotechnology category. Second, BIO uses unclear categories for the fields of biotechnology industries. For example, it categorizes agricultural feedstock and chemicals as one field, but it would be better to have them as separate fields. Third, BIO does not include the biology field, which is one of the most important areas for biotechnology industries. For example, biomass electric power generation (NAICS code: 221117) is one of the most spotlighted biotechnology fields among renewable energy for solving global environmental problems by utilizing biotechnology knowledge and skills.
In this context, this article defines biotechnology as technology based on biological systems, living organisms, or derivatives thereof for the improvement of the value of materials and organisms to pursue sustainable development. This article suggests a new classification of biotechnology fields using the NAICS codes as follows: agricultural biotechnology, biological biotechnology, chemical biotechnology, medical biotechnology, and research and development (R&D) in biotechnology (Table 1).
Classification of Biotechnology Industries
A NEW CLUSTER INDEX: CQ
A feature of biotechnology industries is that the firms tend to exist in geographically proximate clusters near to the knowledge source, i.e., universities and research laboratories specializing in biotechnology.
47,48
Most previous studies have employed the Location Quotient (LQ) index to estimate an industry's cluster or the effect of industries in regions.
28
–36
The LQ is an analytical statistic that measures employing workers in each industry sector relative to a larger geographic unit (usually the nation) and calculated as follows:
where, i = regions and j = industries; LQij = location quotient for the industry j in i; Qij = local employment for industry j in i; Qi = Total local employment in i; Qj = reference area employment for industry j; and Q = Total reference area employment.
However, the LQ has a serious limitation as a cluster index since it is only based on the number of workers and cannot consider the number of industries, which is exactly related to the definition of a cluster. Most scholars suggest the number of industries or firms as the requirement of clusters. According to Porter, who is the pioneer of the cluster theory, business clusters are defined as geographic concentrations of interconnected businesses, suppliers, and associated institutions in a particular field. 49 Rosenfeld explains that a cluster is concentrations of firms that are able to produce synergy because of their geographic proximity and interdependence. 50 Other scholars define clusters as non-random geographical agglomerations of firms with similar or closely complementary capabilities. 51 –53 The UK Department of Trade and Industry also defines clusters as the concentration of competing, collaborating, and interdependent companies and institutions, which are connected by a system of market and non-market links. 54
In this sense, a cluster means that a number of industries gather together, exchange their knowledge and skills, and create new synergy effects, but the LQ index is only calculated by the number of workers. In this case, for example, the LQ index cannot distinguish the differences between one firm hiring 1,000 workers and 10 firms hiring 1,000 workers even though 10 firms clustered in the region are closer to the definition of a cluster.
Likewise, to identify the clusters of industries in regions, the number of workers should also be considered given that it can explain the size of the firms and employment effect of the industry. For example, if we only employ the number of firms in the cluster index, the index cannot reflect the different size of firms into the cluster effect. For instance, two firms have the same value between one firm hiring 1,000 workers and the other hiring 10 workers even though the former one has a stronger employment effect for the region. Therefore, when we calculate the cluster index, it would be better to consider both the number of industries and workers. In this vein, the study proposes a new Cluster Quotient (CQ), which is an analytical statistic that measures the magnitude of clusters in regions relative to a larger geographic unit and calculated as follows:
where: CQij = Cluster Quotient; IQij = Industry Quotient; EQij = Employment Quotient; i = industries; e = employment; j = MSAs; I = industries in all MSAs; and E = employment in all MSAs.
A CQ greater than 1 indicates that the region has a greater share of a cluster than is the case in the reference area. If a CQ is equal to 1, then the region has the same share of a cluster as it does in the reference area.
Results and Discussion
THE CLUSTER PATTERNS OF BIOTECHNOLOGY INDUSTRIES
This study highlights biotechnology clusters in the US MSAs calculated by IQ (Industry Quotient), EQ (Employment Quotient), and CQ (Cluster Quotient) (Table 2). The study confirms that the biotechnology clusters by CQ show different patterns with the clusters by LQ (see the EQ given that they are calculated by the same equation). One important finding is that seven MSAs in the top 20 of CQ are out of the top 20 of LQ, implying that some important biotechnology MSAs, which have a high IQ, can be ruled out if we only apply the LQ method to find biotechnology clusters. For example, while Burlington, NC and Durham, NC ranked second and fourth, respectively, in the top 20 of CQ, they did not rank in the top 20 of LQ even though they have the highest and the second highest IQ of biotechnology industries among all US MSAs. This result implies that the CQ index would be a better index than the LQ index for finding a cluster in that a cluster is concentrations of industries, and high IQ MSAs are highly associated with the CQ index, unlike the LQ index.
The Rank of IQ, EQ, and CQ
When looking at the top 20 MSAs, San Diego, CA ranked first in CQ. The MSA has a high CQ value (3.58), more than three, meaning that it has a highly developed biotechnology cluster in the MSA. This result matches up with previous research, where San Diego, CA is recognized as a flourishing biotechnology cluster. 19,55 For instance, Mary Lindenstein Walshok, dean of UC San Diego Extension and author of a book on San Diego's innovation economy, explains that San Diego is the most developed biotech hub. This is because geography and land-use decisions, which were made in the late 1940s and early 1950s, are the pillars of a successful biotech hub in San Diego. The city of San Diego made the biotech hub on Torrey Pines Mesa possible by zoning that area for research and development and light industry. So instead of allowing the usual commercial development on prime coastal land, it was kept open for science. By reserving land in advance, San Diego made it possible for research institutes and technology companies to cluster together. That proximity encourages collaboration and makes it easy for new companies to arise from a large talent pool. 56
In addition, California has the highest number (four) of biotechnology clusters within the top 20 MSAs among the United states. This result is consistent with the prior studies that California has the largest concentration of biotechnology firms in the United States, and it has been and continues to be in a unique position to lead the nation in biotechnology. 57,58
Next, the study explores the rank of biotechnology industries by fields: agriculture, biology, chemistry, medicine, and R&D. First, agriculture shows the highest CQ values from the first to the top 20 among the biotechnology fields (Table 3). For instance, Jonesboro, AR, which ranked first in agriculture, has a CQ value higher than 77.69. The second-ranked MSA (St. Joseph, MO) and the third-ranked MSA (Chico, CA) have CQ values of 57.41 and 43.40, respectively. This highlights that biotechnology industries related to agriculture are one of the major industries in the regions and heavily concentrated. One more characteristic in the agricultural field is that all MSAs within the top 20 have a CQ value higher than four.
The Rank of Biotechnology Industries by Fields
For biotechnology industries related to biology, Janesville, WI ranked first (8.86), followed by San Francisco, CA (7.74) and Omaha, NE (7.34). Overall, MSAs in California also ranked high given that four MSAs in California have a CQ value higher than three. The difference between the field of biology and that of agriculture is that biology has many MSAs higher than three in the Northeast region, such as Boston, MA (6.23).
In the field of chemistry, the top-ranked MSA (Augusta, GA) has quite a high CQ value—more than 12. New Orleans, LA (9.81) and Houston, TX (8.76) ranked second and third, respectively. Also, biotechnology industries in chemistry are clustered in the South—especially Texas, which has many developed chemistry clusters with four MSAs with a CQ value higher than three, implying that the MSAs in Texas play an important role in chemical biotechnology industries.
Biotechnology industries related to medicine show the smallest gap between the first and top 20 among the biotechnology fields. The top three MSAs have a CQ value higher than two: Burlington, NC (3.68); San Diego, CA (2.65); and Vallejo, CA (2.59). Burlington, NC, in particular, is the only MSA with a CQ value higher than three. Overall, the spatial pattern of medical biotechnology industries shows relatively even distribution across the US MSAs.
In R&D, the top-ranked MSA has the second highest CQ value among the top-ranked MSA of biotechnology fields. Ames, IA, the top-ranked MSA, has a CQ value higher than 12.04. Durham, NC (10.06) and San Diego, CA (10.00), the second- and third-ranked MSA, respectively, show the CQ value higher than 10. The CQ values in R&D sharply dropped after the top third, and only 39 MSAs have a CQ value higher than one, showing that R&D biotechnology clusters are heavily concentrated in specific regions (Fig. 1).
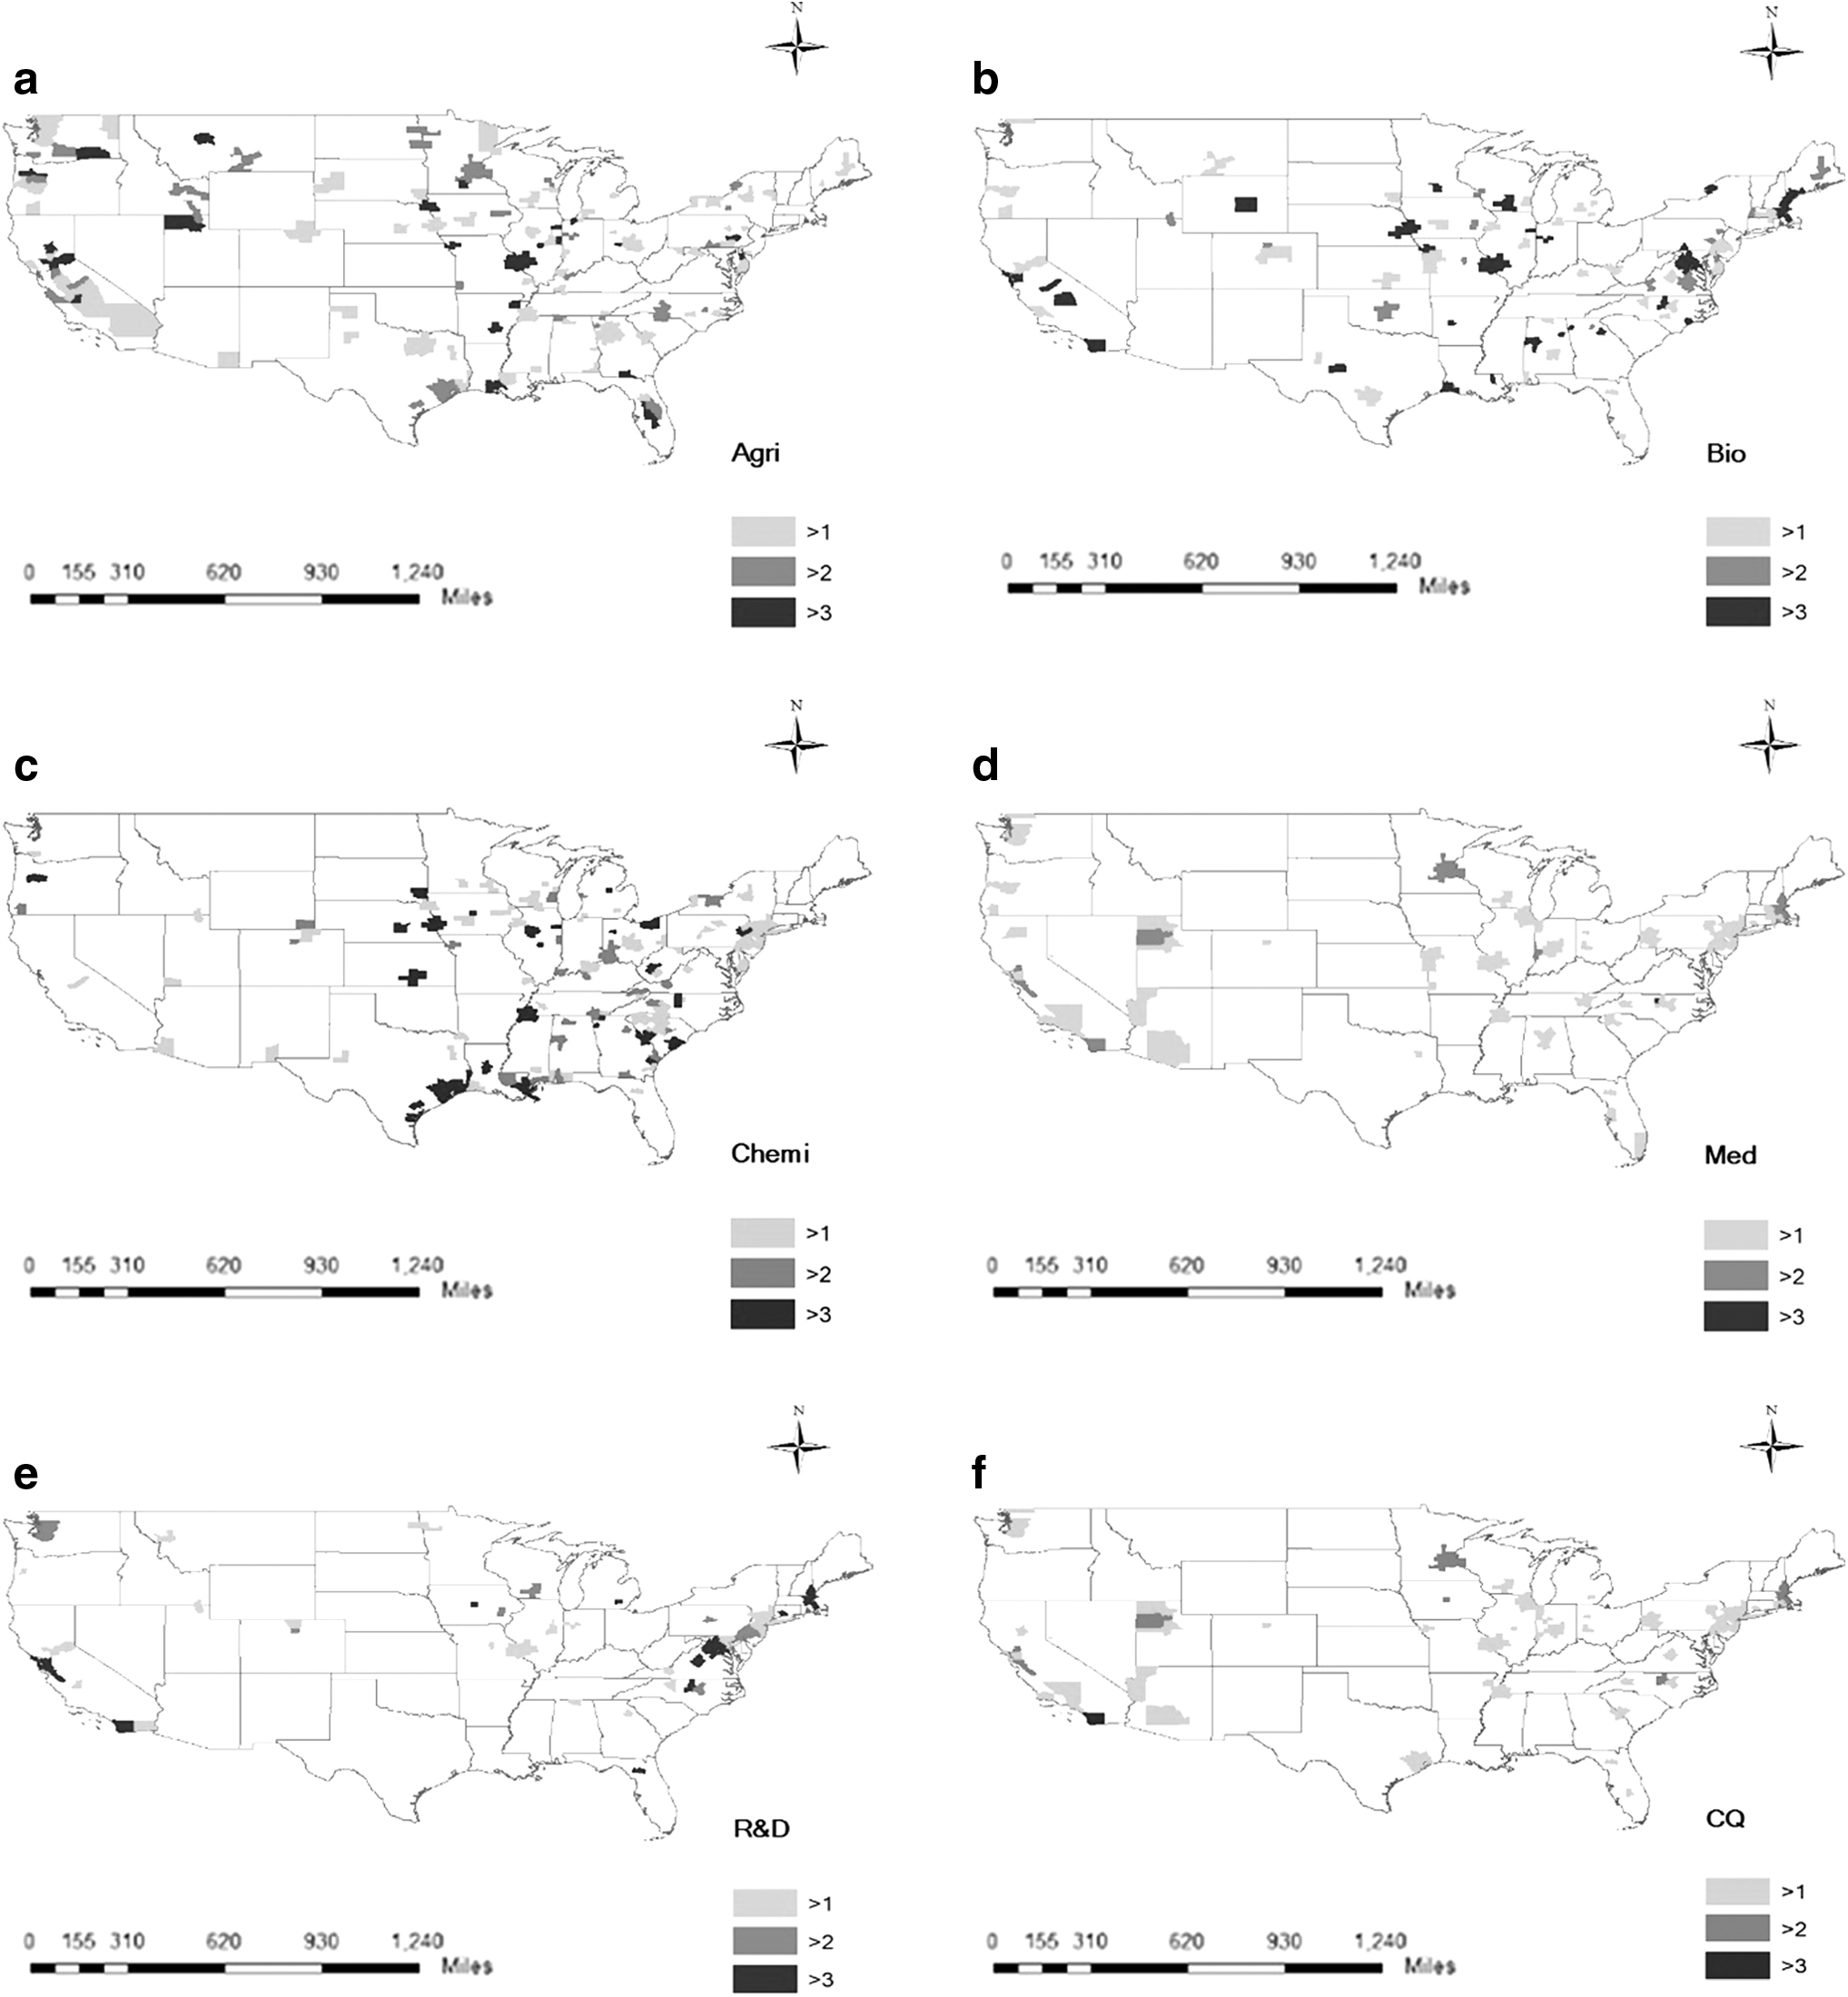
The CQ values of biotechnology industries in agriculture, biology, chemistry, Medicine, R&D, and all.
THE EFFECT OF BIOTECHNOLOGY CLUSTERS AND INDUSTRIES
While the importance of the understanding of biotechnology continues to grow, there are few studies on the effect of biotechnology clusters and industries on regional innovation systems in the whole US MSAs. In this background, the study employs log- linear Cobb-Douglas regression models to estimate the effect of biotechnology industries on regional innovation systems in the US MSAs. This study develops ten models to examine the relationship between biotechnology and regional innovation systems. The models are differentiated by the biotechnology industry variables: model 1 (the number of biotechnology industries), model 2 (the Cluster Quotient index of biotechnology industries), model 3 (the Location Quotient index of biotechnology industries), model 4 (the specialization of biotechnology industries; specialization index = Max j (Sij / Sj), where Sij denotes the share of industry j in city i, and Sj is the share of industry j in national employment),
59
model 5 (the diversity of biotechnology industries, diversity index = 1/
whesre y indicates utility patents in the MSA; β0 denotes the intercept term; β(1,…,9) is the coefficient value; B1 represents the effects of biotechnology industries; L2 is labor input; C3 contains capital input; A4 estimates the number of all industries; W5 denotes the proportion of whites; K6 represents the proportion of blacks; S7 estimates the proportion of Asians; F8 indexes the proportion of foreign-born people; E9 is the number of people who have a bachelor's degree or above; and ɛ is the error term.
In this study, utility patents are the dependent variable as a proxy variable of regional innovation systems, and the ten biotechnology variables are the productivity variables for the Cobb-Douglas model. According to the previous literature, patents are a commonly used measure of the innovative intensity in regions. 37 –43,60 For example, Spender and Grant show that patents are some of the very satisfactory variables to measure knowledge creation in regions. 61 Acs et al. report that the spatial distribution of patent and innovation counts demonstrates a striking similarity in the US, and the similarity between the two measures is explained by a correlation of about 0.9. 60 Feldman and Florida show that patents and innovation have a very strong relationship given that their correlation is 0.934. 61 Therefore, patents can be the best readily available indicator of regional innovation systems in US MSAs. 62 –64
Next, the Cobb-Douglas function has been widely employed for large-scale studies (such as MSAs, states, and countries), which estimates between the effect of input and the change of output consistent with this study. 65 –69 For example, Balistreri et al. support the Cobb-Douglas function in the US based on 28 industries that cover the entire economy in the US. 65 Blundell and Bond explore 509 R&D-performing US manufacturing companies in 8 years by employing the Cobb-Douglas function. 66 ECFIN runs the Cobb-Douglas function to estimate potential growth and output gaps estimates for EU member states and the US. 67 Garcia-Mila et al. show the effect of public capital at the state level in the US based on a panel data set from 1970 and 1983. 68 Stern highlights the association between the GDP and energy use in the US by exploring four different Cobb-Douglas models. 69
In this article, Labor input is calculated by the number of workers from the county business pattern data, and capital input is estimated by real personal income released by the Bureau of Economic Analysis given that there is no data for capital input at the MSAs level. This study assumes that high real personal income in the MSA can be a proxy variable for the high quantity of capital input. For instance, Christensen and Jorgenson show that the value of capital stock may be set equal to the total flow of income. 70
Patents may be attributed to other regional conditions, such as an industrial environment and sociodemographic variables. For instance, real income may vary among demographic groups because of differences in the mix of goods and services consumed by these different groups. 71 Lee and Nathan reveal that different population composition is likely to demand a greater variety of non-traded goods and services, which affect knowledge workers, cultural diversity, and innovation. 72 Nathan also finds that ethnic inventors play important roles in US innovation systems, especially in high-tech regions like Silicon Valley. 73 High-tech US clusters like Silicon Valley have benefited from foreign entrepreneurs who both help connect South Bay firms to global markets and are responsible for 52% of the Bay Area's startups. 74 There are positive links between the presence of migrants and US regional patenting. 75,76 This study controls the number of all industries, race/ethnicity (the proportion of white, black, Asian, and foreign-born people), and educational achievement (the number of people who have a bachelor's degree or above). Tables 4 and 5 show data descriptions and the descriptive statistics of the variables. All variables in the models are included after checking the Durbin-Watson statistic, correlation analysis, histogram, and normal probability plot.
Data Descriptions
Specialization index = Max j (Sij/Sj), where Sij denotes the share of industry j in city i, and Sj is the share of industry j in national employment);
2
diversity index = 1/
Descriptive Statistics
After running the regression models, the CQ of biotechnology has a positive impact on the patents and is the only significant biotechnology explanatory variable for the patents among five models (model 1–5). An increase of 1% of the CQ generates an increase of 0.25% of the patents, showing that biotechnology clusters play a positive role in patents. Meanwhile, the LQ of biotechnology does not affect the patents (Table 6). This result shows that scholars may underestimate the cluster effect of biotechnology on patents if they employ the LQ method to measure the degree of biotechnology clusters in the regions. These different results between the CQ index and the LQ index are probably attributable to the fact that industries are the main driver of obtaining patents, while workers are not related to the patents as much as industries. In other words, the high industry quotient plays an important role in patents, and the CQ can reflect this important factor in the index. In contrast, the LQ cannot consider the high industry quotient into the index at all. Given that industries play a central role in patents and clusters, the CQ index would be a better index than the LQ index when we examine the relationship between biotechnology industries and patents or measure the degree of clusters in the regions.
The Result of Log-Linear Cobb-Douglas Models
<0.001; ** <0.05; * < 0.1 all variables except percentage variables are in logarithms.
The education achievement (the number of people who have a bachelor's degree or above) exerts a strong impact on patents. The variable has a positive impact on patents with an elasticity of about 1.4 in the models. The finding is in agreement with those of prior studies and can be understood from a human capital perspective. 77 –80 The concept of human capital pertains to people's knowledge and abilities that allow for changes in action and economic growth. 81 Badinger and Tondl suggest that growth of EU regions is positively related to the accumulation of physical and human capital, and Dakhli and De Clercq find strong support for the positive relationship between human capital and innovation based on the societal level across 59 different countries. 82,78 In addition, the proportion of Caucasian individuals is positively related to the patents in the models except for model 2, but it shows a marginal effect of 0.03.
Table 7 shows that the effects of biotechnology clusters on regional innovation systems varies>AQ6> by each industrial field. Among five industrial fields, biology clusters play a significantly positive role in patents with elasticity of 0.314. This result shows that biology industries are positively associated with regional innovation systems and scholars cannot find the strong impact of biology industries on patents if they adopt BIO's classification, which is among the most used in the US but does not include biology industries in categories of biotechnology industries. 15 In this case, scholars underestimate the effects of biotechnology on regional innovation systems and miss the main driver among biotechnology industries for regional development. In contrast, this study confirms that biology industries play an important role in regional innovation systems and should be considered one of the main areas for biotechnology industries. Governments also should design policies for biology industries to promote regional innovation effects and develop regional biology clusters. Given that biology clusters are the only biotechnology field that has a significantly positive impact on regional innovation systems, this study further explores the innovative role of biology industries in the US to provide more implications for policymakers.
The Effects of Each Biotechnology Cluster
<0.001; ** <0.05; * < 0.1 all variables except percentage variables are in logarithms.
THE INOVATIVE ROLE OF BIOLOGY INDUSTRIES IN THE US
Biology industries are considered an example of new-paradigm innovation industries and rapidly rising industrial fields. Innovation systems for renewable energy technologies have become a key research area for sustainable development, and biology industries are the main driver in regional innovation systems. 83 Biology industries can lead to the build-up of a well-functioning innovation system, and thus the systems can gain enough critical mass to overcome technical and environmental problems in the energy market. 84
Since the Energy Independence and Security Act of 2007 (EISA) was enacted in December 2007, biology industries play a more important role in regional innovation systems and sustainable development. The law contains a number of provisions to promote energy efficiency and the availability and use of renewable energy (Fig. 2). 85 One key provision of EISA is the setting of a revised Renewable Fuels Standard (RFS), which mandates the use of 36 billion gallons per year (BGY) of renewable fuels by 2022. 86 Biomass energy consumption in the United States grew more than 60% from 2002 to 2013 (Fig. 3). 87 Biomass fuels provided about 5% of total primary energy use in the United States. 88 As a result, according to the US Department of Energy, biomass industries had about a $100 billion direct and indirect impact on the US economy in 2014. The bioeconomy employs close to half of a million people in the US, and the potential exists for this figure to triple in the next 15 years. 89 Industry Market Research, Reports, & Statistics highlights that over the past five years (2013–2018), biomass industries in the US have grown by 0.7% to reach revenue of $866 million in 2018. In the same timeframe, the number of businesses has grown by 3.1% and the number of employees has grown by 4.0%. 90 For this reason, biology industries have been highly associated with regional innovation systems and sustainable development.
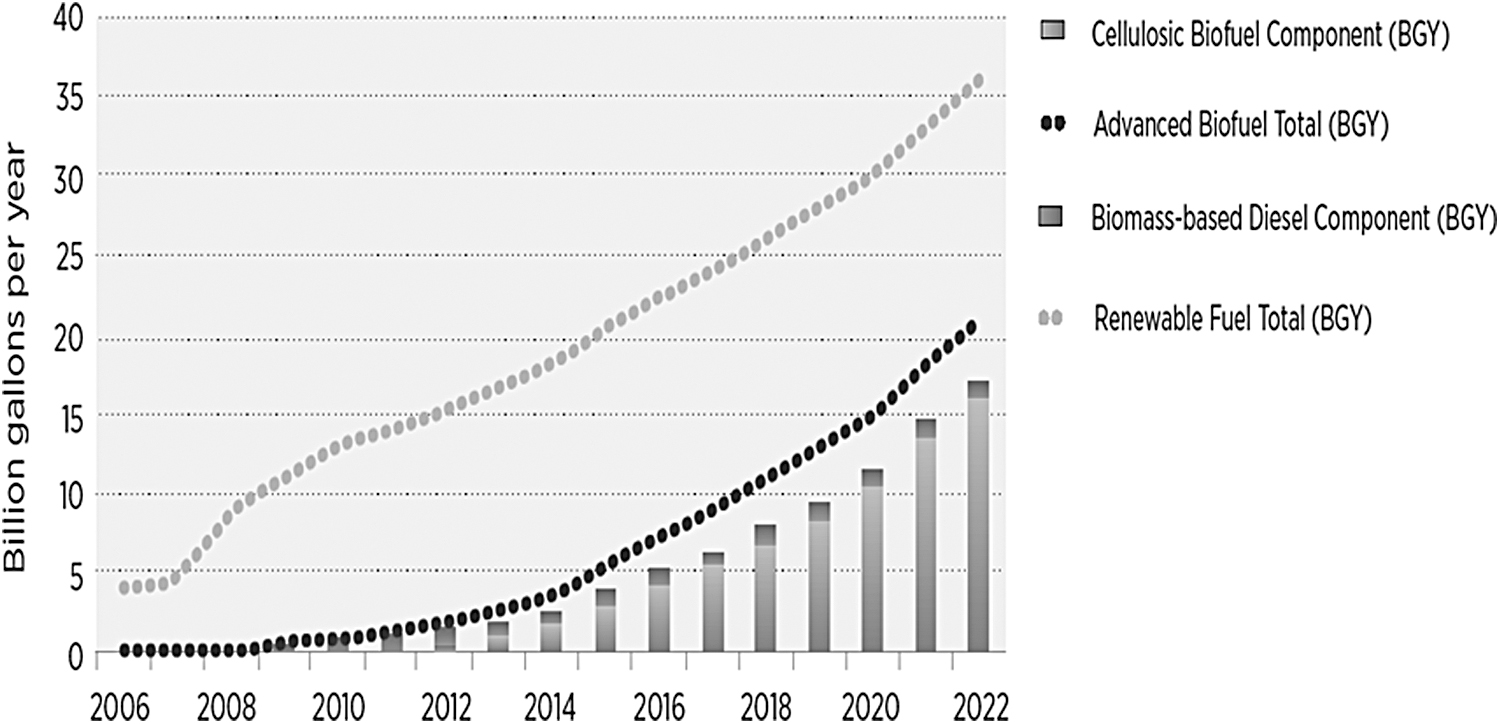
The revised Renewable Fuels Standard (RFS).
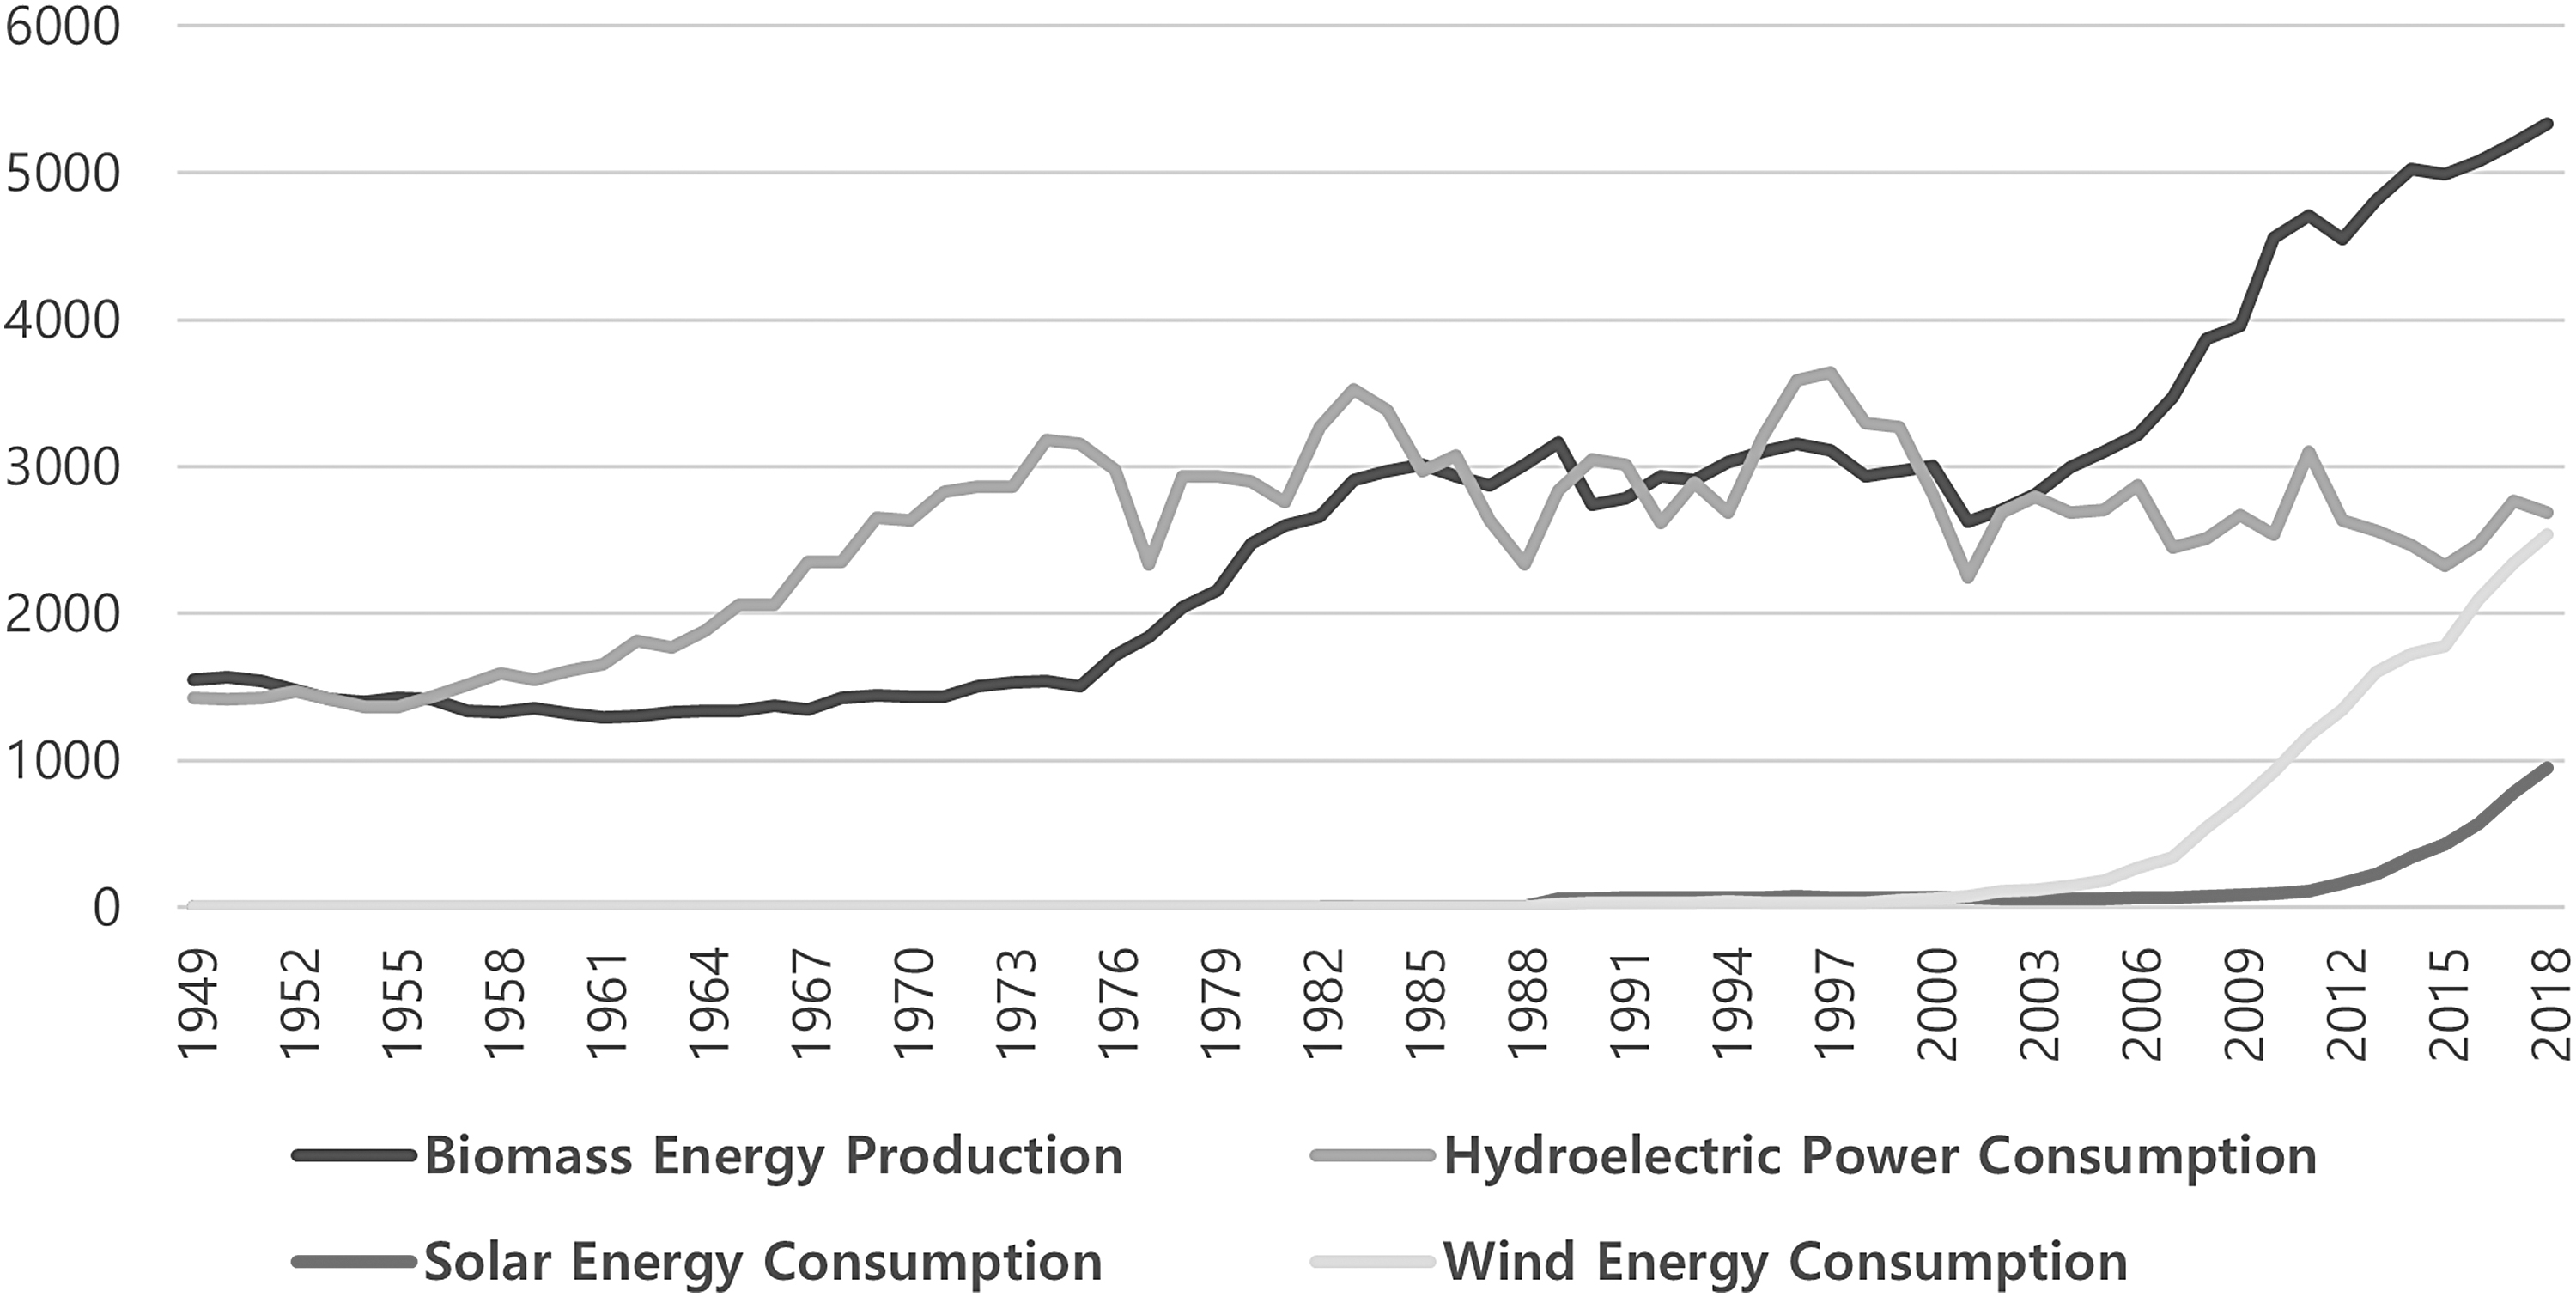
Renewable energy consumption (trillion Btu).
Many scholars and articles also show how biology industries play an important role in innovation and regional growth. For instance, a National Research Council report (NRC) highlights that biology industries are likely to have significant regional and local impacts, encouraging the growth of new technologies and regional innovation systems. 91,92 Biology industries develop their innovation processes with new techniques and inputs, collaborate with other industrial sectors to produce sustainable products. In other words, a major challenge for biology industries is to find methodologies to integrate sustainable technologies and innovation systems into their business models, and this task contributes to regional innovation systems. 93 To produce comparatively fewer harmful carbon dioxide emissions and reduce economies' dependency on fossil fuels, biology industries should develop abundant and renewable ways based on innovation processes, and thus they continuously interact with regional innovation systems. Therefore, biology industries can act as the main driver for positive and significant sustainable development through continual innovation, and the US government should invest in biology industries for sustainable development and encouraging regional innovation systems. 94
Conclusions
The study casts light on the cluster characteristic of biotechnology industries by employing a new Cluster Quotient index and analyzing their effect on regional innovation systems. The biggest differences between this article and previous research is that: (1) this study suggests a new classification of biotechnology industries based on the more elaborate design than the prior research; (2) this study proposes a new cluster index considering the number of industries and workers to measure the spatial patterns of biotechnology clusters in the MSAs, instead of Location Quotient, which is frequently used, but has a limitation for finding a cluster; and (3) this study provides insights on the effect of biotechnology industries on regional innovation systems using the whole US MSAs data.
This study finds that San Diego, CA plays an important role in biotechnology industries. Also, the CQ index would be a better method to measure the degree of clusters given that the CQ index is closer to the definition of clusters than the LQ index and the LQ fails to include the top and the top second-ranked MSAs of the highest industry quotient into top 20 MSAs. As scholars indicated, clusters are defined as a geographic concentration of industries, and thus the CQ index would be a better index than the LQ index to highlight clusters of industries in the regions given that the CQ index is calculated by the number of industries and workers, as opposed to the LQ index, which is only based on the number of workers.
The study also demonstrates the effects of biotechnology industries on regional innovation systems based on US MSAs in 2014. After running the Cobb-Douglas models, the CQ of biotechnology has a positive impact on patents. An increase of 1% of the CQ generates an increase of 0.25% in patents, showing that clusters of biotechnology play a positive role in patents. In contrast, LQ does not affect patents, implying that scholars may underestimate the cluster effect of biotechnology on patents if they measure it based on the LQ. Another important finding is that scholars should take biology industries into account for the study area of biotechnology industries, unlike BIO's classification, given that biology industries are one of the main areas of biotechnology industries and exert a positive impact on patents with the elasticity of 0.314. The result shows that scholars may miss the strong effects of biology industries on regional innovation systems if they don't consider biology industries as one of the biotechnology fields. 15 Also, governments should design policies for biology industries to promote regional innovation effects and develop biology clusters in the regions.
In sum, this study highlights that biotechnology clusters play an important role in regional innovation systems and need to be seriously taken into consideration in the field of urban planning. Given that biotechnology industries are highly associated with not only regional innovation systems but also sustainable development, it is worth promoting biotechnology industries as one of the main drivers in the 21st century.
Footnotes
Author Disclosure Statement
No competing financial interests exist.
Funding Information
No funding was received.