
Abstract

Executive Summary
This report was prepared for the USDA BioPreferred® Program. The conclusions and recommendations are those of the authors and have not been endorsed by USDA. The report is part of a series of reports tracking the impact of the biobased product industry on the US economy including the October 2014 USDA report, Why Biobased? Opportunities in the Emerging Bioeconomy; 1 the June 2015 USDA report, An Economic Impact Analysis of the US Biobased Products Industry, 2 the October 2016 report, An Economic Impact Analysis of the US Biobased Products Industry: 2016 Update, 3 and the July 2019 report, An Economic Impact Analysis of the US Biobased Products Industry: 2018 Update. 4
This report seeks to address seven important questions regarding the contributions of the biobased products industry in the United States: The quantity of biobased products; The value of the biobased products; The quantity of jobs contributed; The quantity of petroleum displaced; Other environmental benefits; The economic impacts of biobased exports; and Areas in which the use or manufacturing of biobased products could be more effective, including identifying any technical and economic obstacles and recommending how those obstacles can be overcome.
Although there have been several other studies on the contribution of the biobased products sector to the global and European economies, this series seeks to examine and quantify the effect of the US biobased products industry from economic, job, and environmental perspectives, and this report provides an important update to past reports. The report is intended to provide a snapshot of available information and a platform upon which to build future efforts as more structured reporting and tracking mechanisms may be developed. This report is focused on biobased products and, as such, does not focus on biobased fuels or other energy sources except when analyzing coproducts.
As detailed in this report, we used a similar, proven methodology to past reports that took a three-pronged approach to gathering information on the biobased products sector. The authors interviewed a broad spectrum of representatives of government, industry, and trade associations involved in the biobased products industry to understand the challenges and future growth potential for biobased products. We collected statistics from government agencies and published literature on biobased products, economics, and jobs; and we conducted extensive economic modeling using IMPLAN modeling software—developed by the USDA Forest Service—to analyze and trace spending through the US economy and measure the cumulative effects of that spending.
The IMPLAN model tracks the way dollars injected into one sector are spent and re-spent in other sectors of the economy, generating waves of economic activity, or “economic multiplier” effects. IMPLAN uses national industry data and county-level economic data to generate a series of multipliers. In turn, these are used to estimate the total implications of economic activity as direct, indirect, and induced effects. Contributions analyses were conducted to assess the effects of specific biobased segments within the US economy.
This report also includes further analysis of the value of US biobased product exports. Exports make important contributions to the Gross Domestic Product (GDP) providing a valuable market channel to support our farmers and growers in the agricultural community. The economic impacts of biobased exports were determined using export data from IBIS World and the IMPLAN economic model. An embedded summary of export growth is reported for each of the seven major sectors discussed next. The seven major sectors that represent the US biobased products industry's contribution to the US economy covered in this report are: Agriculture and Forestry; Biobased Chemicals; Biobased Plastic Bottles and; Biorefining; Enzymes; Forest Products; and Textiles.
This report specifically excludes the energy, livestock, food, feed, and pharmaceuticals sectors. These sectors are also excluded from participation in the BioPreferred® Program. According to the National Academies of Sciences, the bioeconomy accounted for 5.1 percent of the US gross domestic product in 2016, equating $959.2 billion dollars. 5 The next three figures show the major findings of this report. As summarized in Fig. 1, the total contribution of the biobased products industry to the US economy in 2017 was $470 billion, employing 4.6 million workers. It was estimated that each job in the biobased industry supported 1.79 jobs in other sectors of the economy. Figure 2 shows these numbers in more detail. The 1.65 million direct jobs supporting the biobased industry supported 2.96 million spillover jobs, including both indirect and induced jobs. Similarly, the $162 billion in direct value added had a spillover value added of $309 billion.
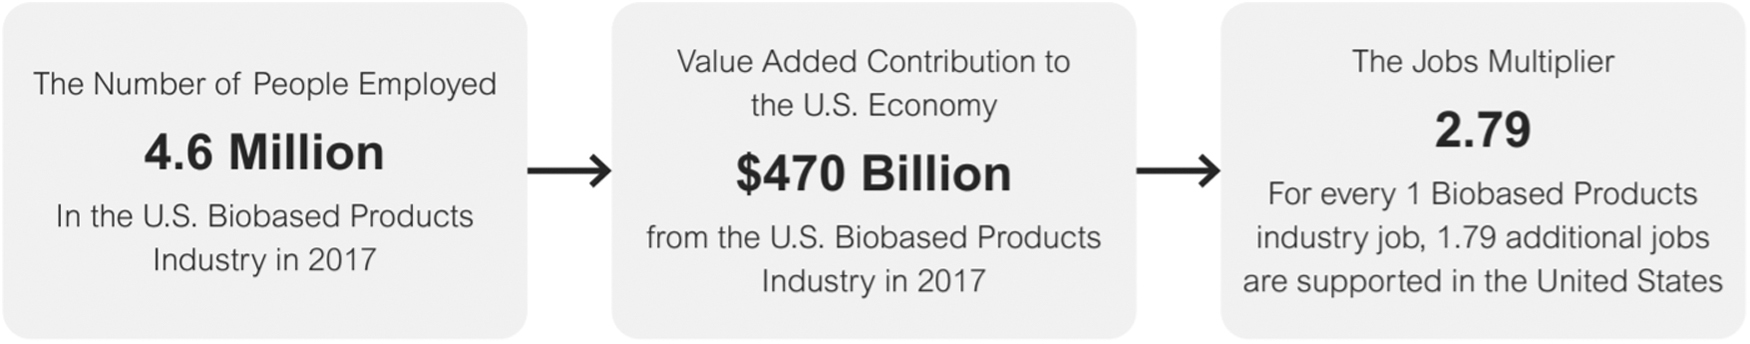
US biobased products industry key findings in 2017.
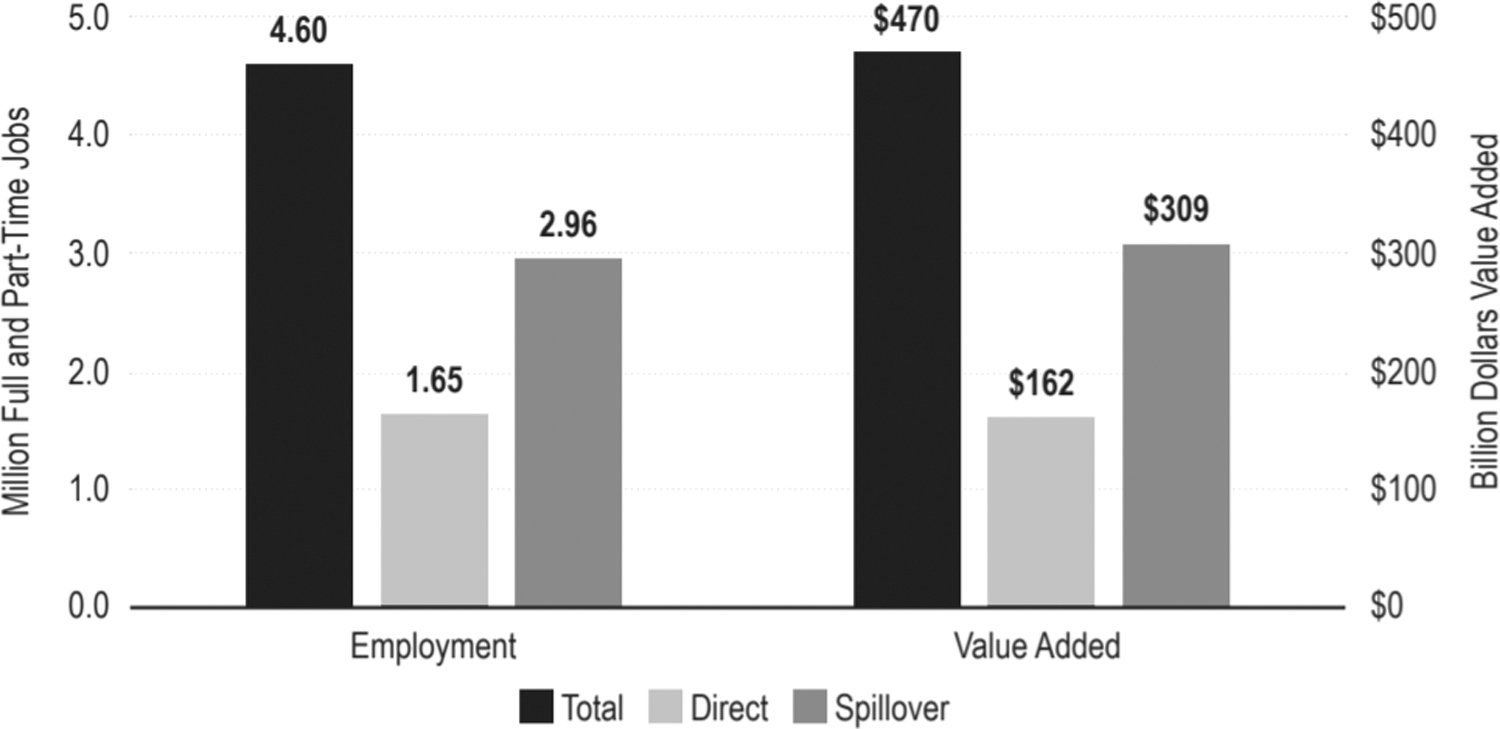
Total employment and value added to the US economy from the biobased products industry in 2017.
Figure 3 shows the value added to the US economy by biobased products was $470 billion in 2017, up from $459 billion in 2016. This is an increase of $10.9 billion, or a 2.4% increase over 2016 levels, and compares favorably with the National Research Council's estimate of $353 billion for 2012. This growth was due in part to the growth of the national economy and the growth of the GDP, but it also suggests that biobased products are a healthy and growing industry. Contributing to this is the increasing use of biobased materials in several sectors, as consumers are growing more cognizant of the need to use sustainable materials. Figure 3 also shows that employment in the industry decreased slightly from 4.65 million jobs in 2016 to 4.6 million in 2017.
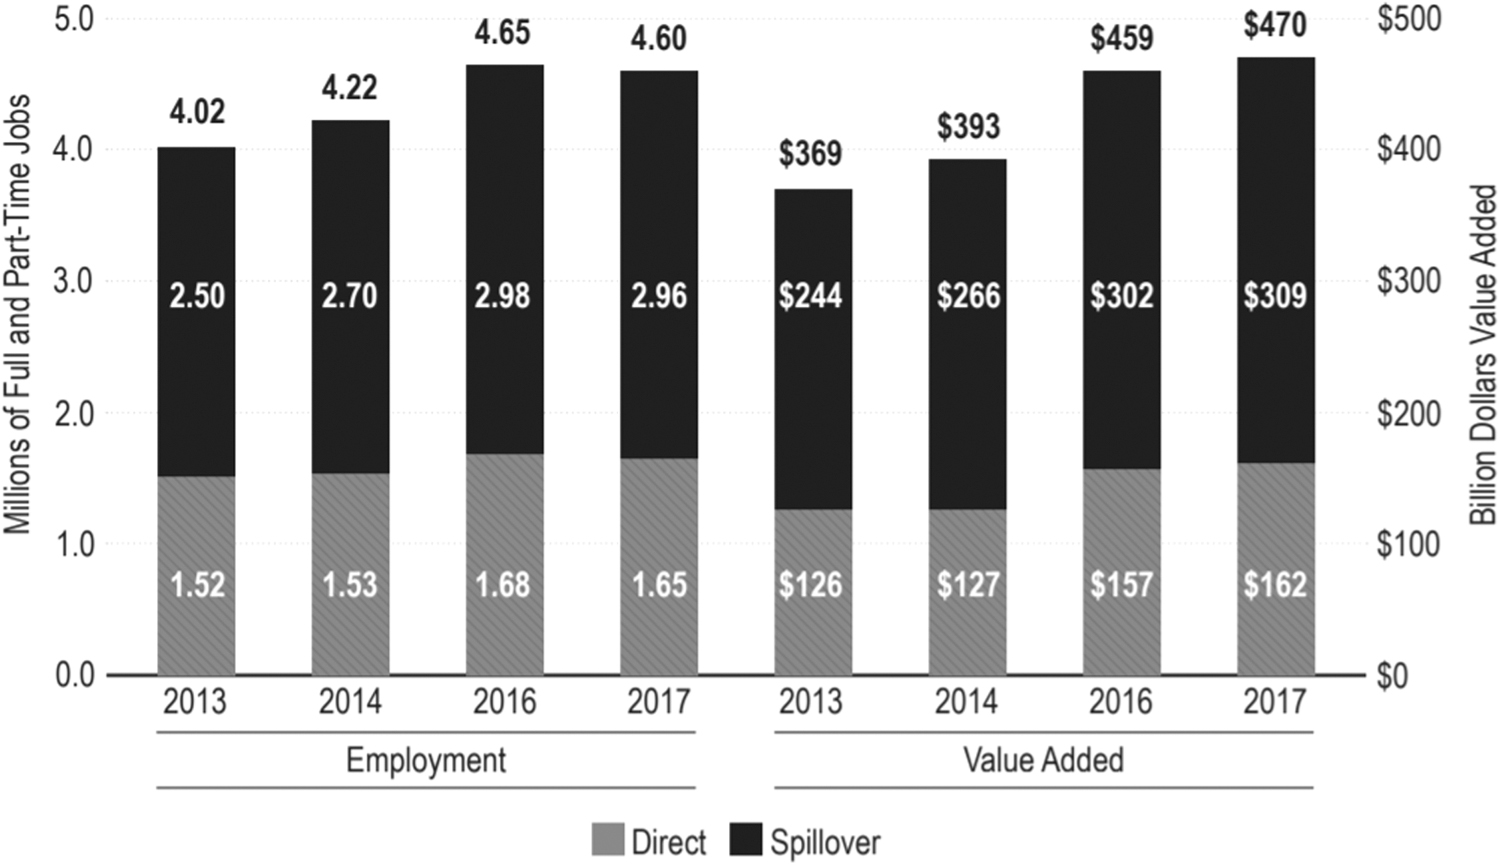
Economic impacts of biobased products industry in 2013, 2014, 2016, and 2017.
Next, we provide brief responses to the seven questions posed earlier regarding the contributions of the biobased products industry in the United States.
The Quantity of Biobased Products
While there is no database that tracks the “quantity of biobased products sold,” the USDA BioPreferred® Program has identified about 20,000 biobased products. The actual number of biobased products is likely dramatically higher than the number in the BioPreferred® Program's database as there is no requirement that all biobased products be listed in the BioPreferred® Program's database. In terms of jobs created and value added, the forest products segment alone more than doubles the estimates for the remainder of the biobased products sector, which is not well represented in the BioPreferred® Program's database due to the original exclusion of forest products from the program. Thus, 40,000 would be a conservative estimate of the total number of existing biobased products. Sufficient data are not available to estimate the total number of individual “units” of biobased products sold. However, the total value added from direct sales of biobased products was estimated to be in $127 billion 2014 and $162 billion in 2017, suggesting that both the sales and number of biobased products is increasing.
The Value of Biobased Products
As Fig. 3 shows, the value added to the US economy by biobased products was $470 billion in 2017. This includes $162 billion in direct value added and $309 billion spillover value added (direct value added plus induced value added). As mentioned earlier, this is a 2.4% increase over the 2016 levels reported in the previous report.
The Quantity of Jobs Contributed
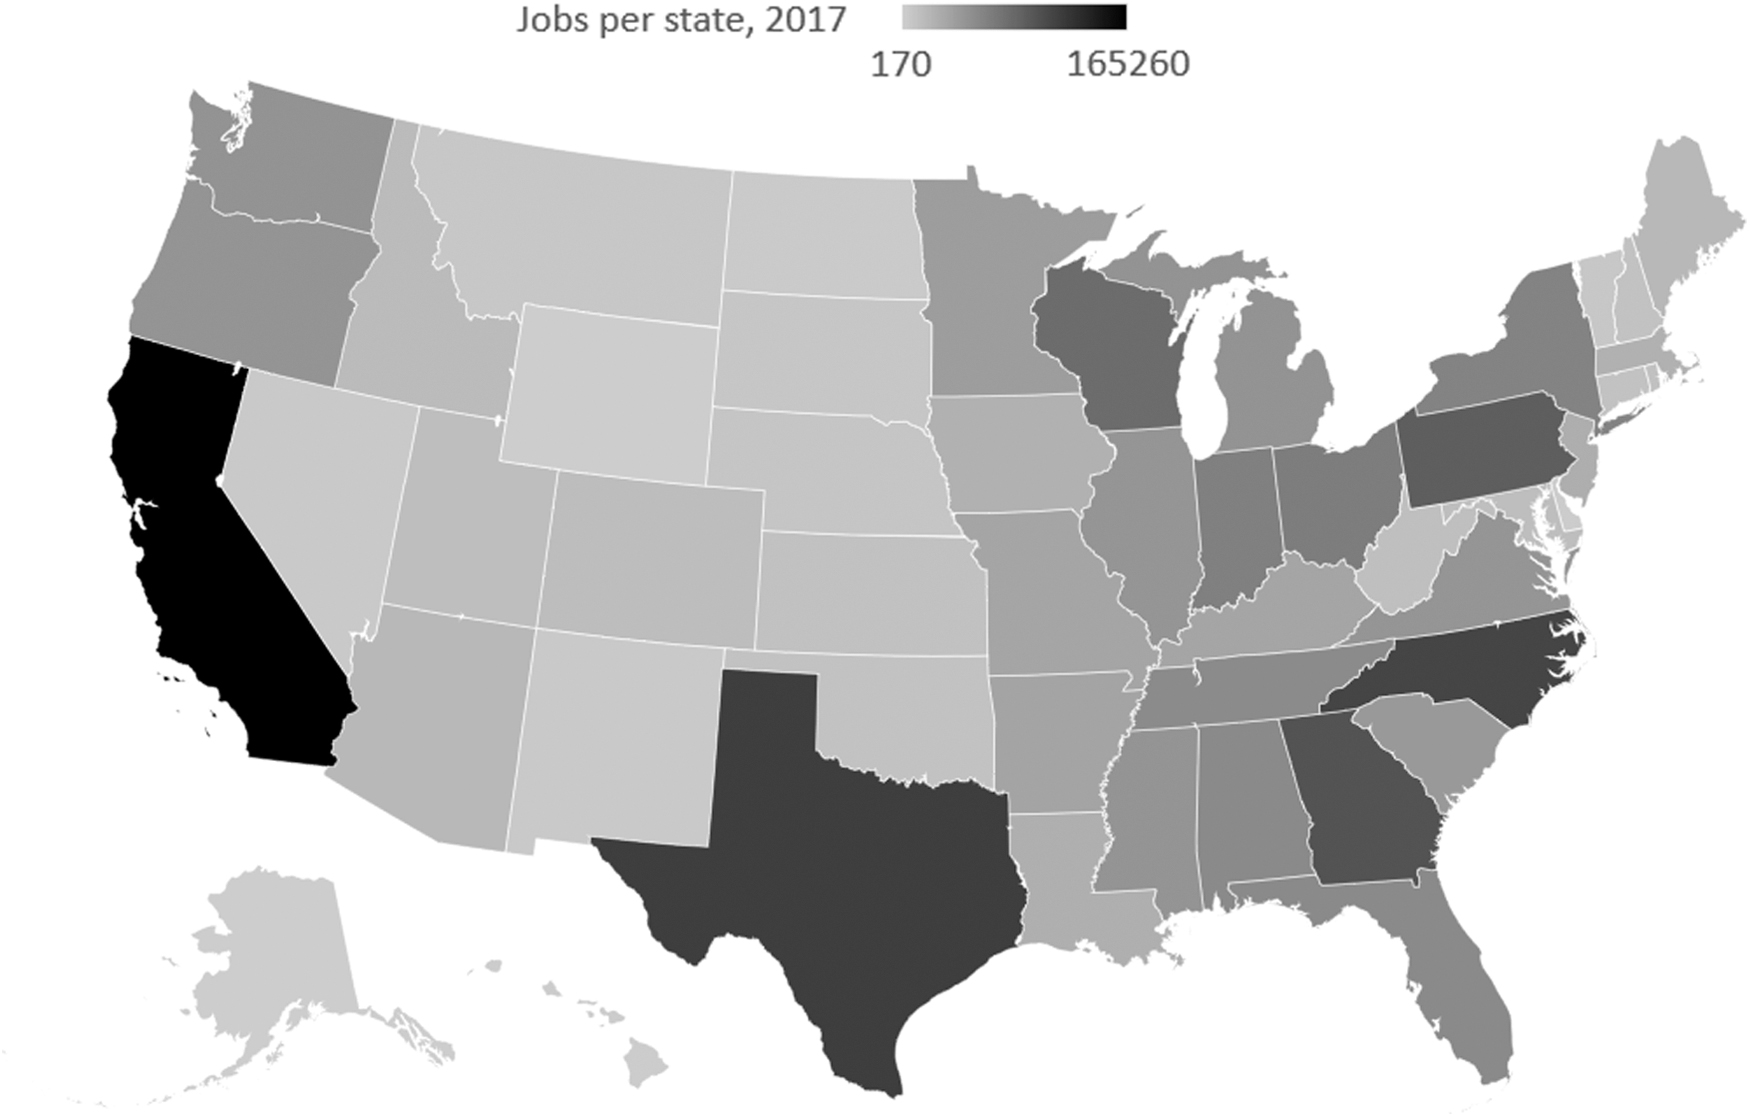
As shown in Fig. 1–3 , the biobased products industry employed more than 4.6 million people in the United States in 2017. This included more than 1.65 million jobs directly in the biobased products industry and 2.96 million spillover jobs (direct jobs plus induced jobs). Figure 4 shows the estimated geographic distribution of these jobs at the state level, based on the distribution of jobs in 2017.
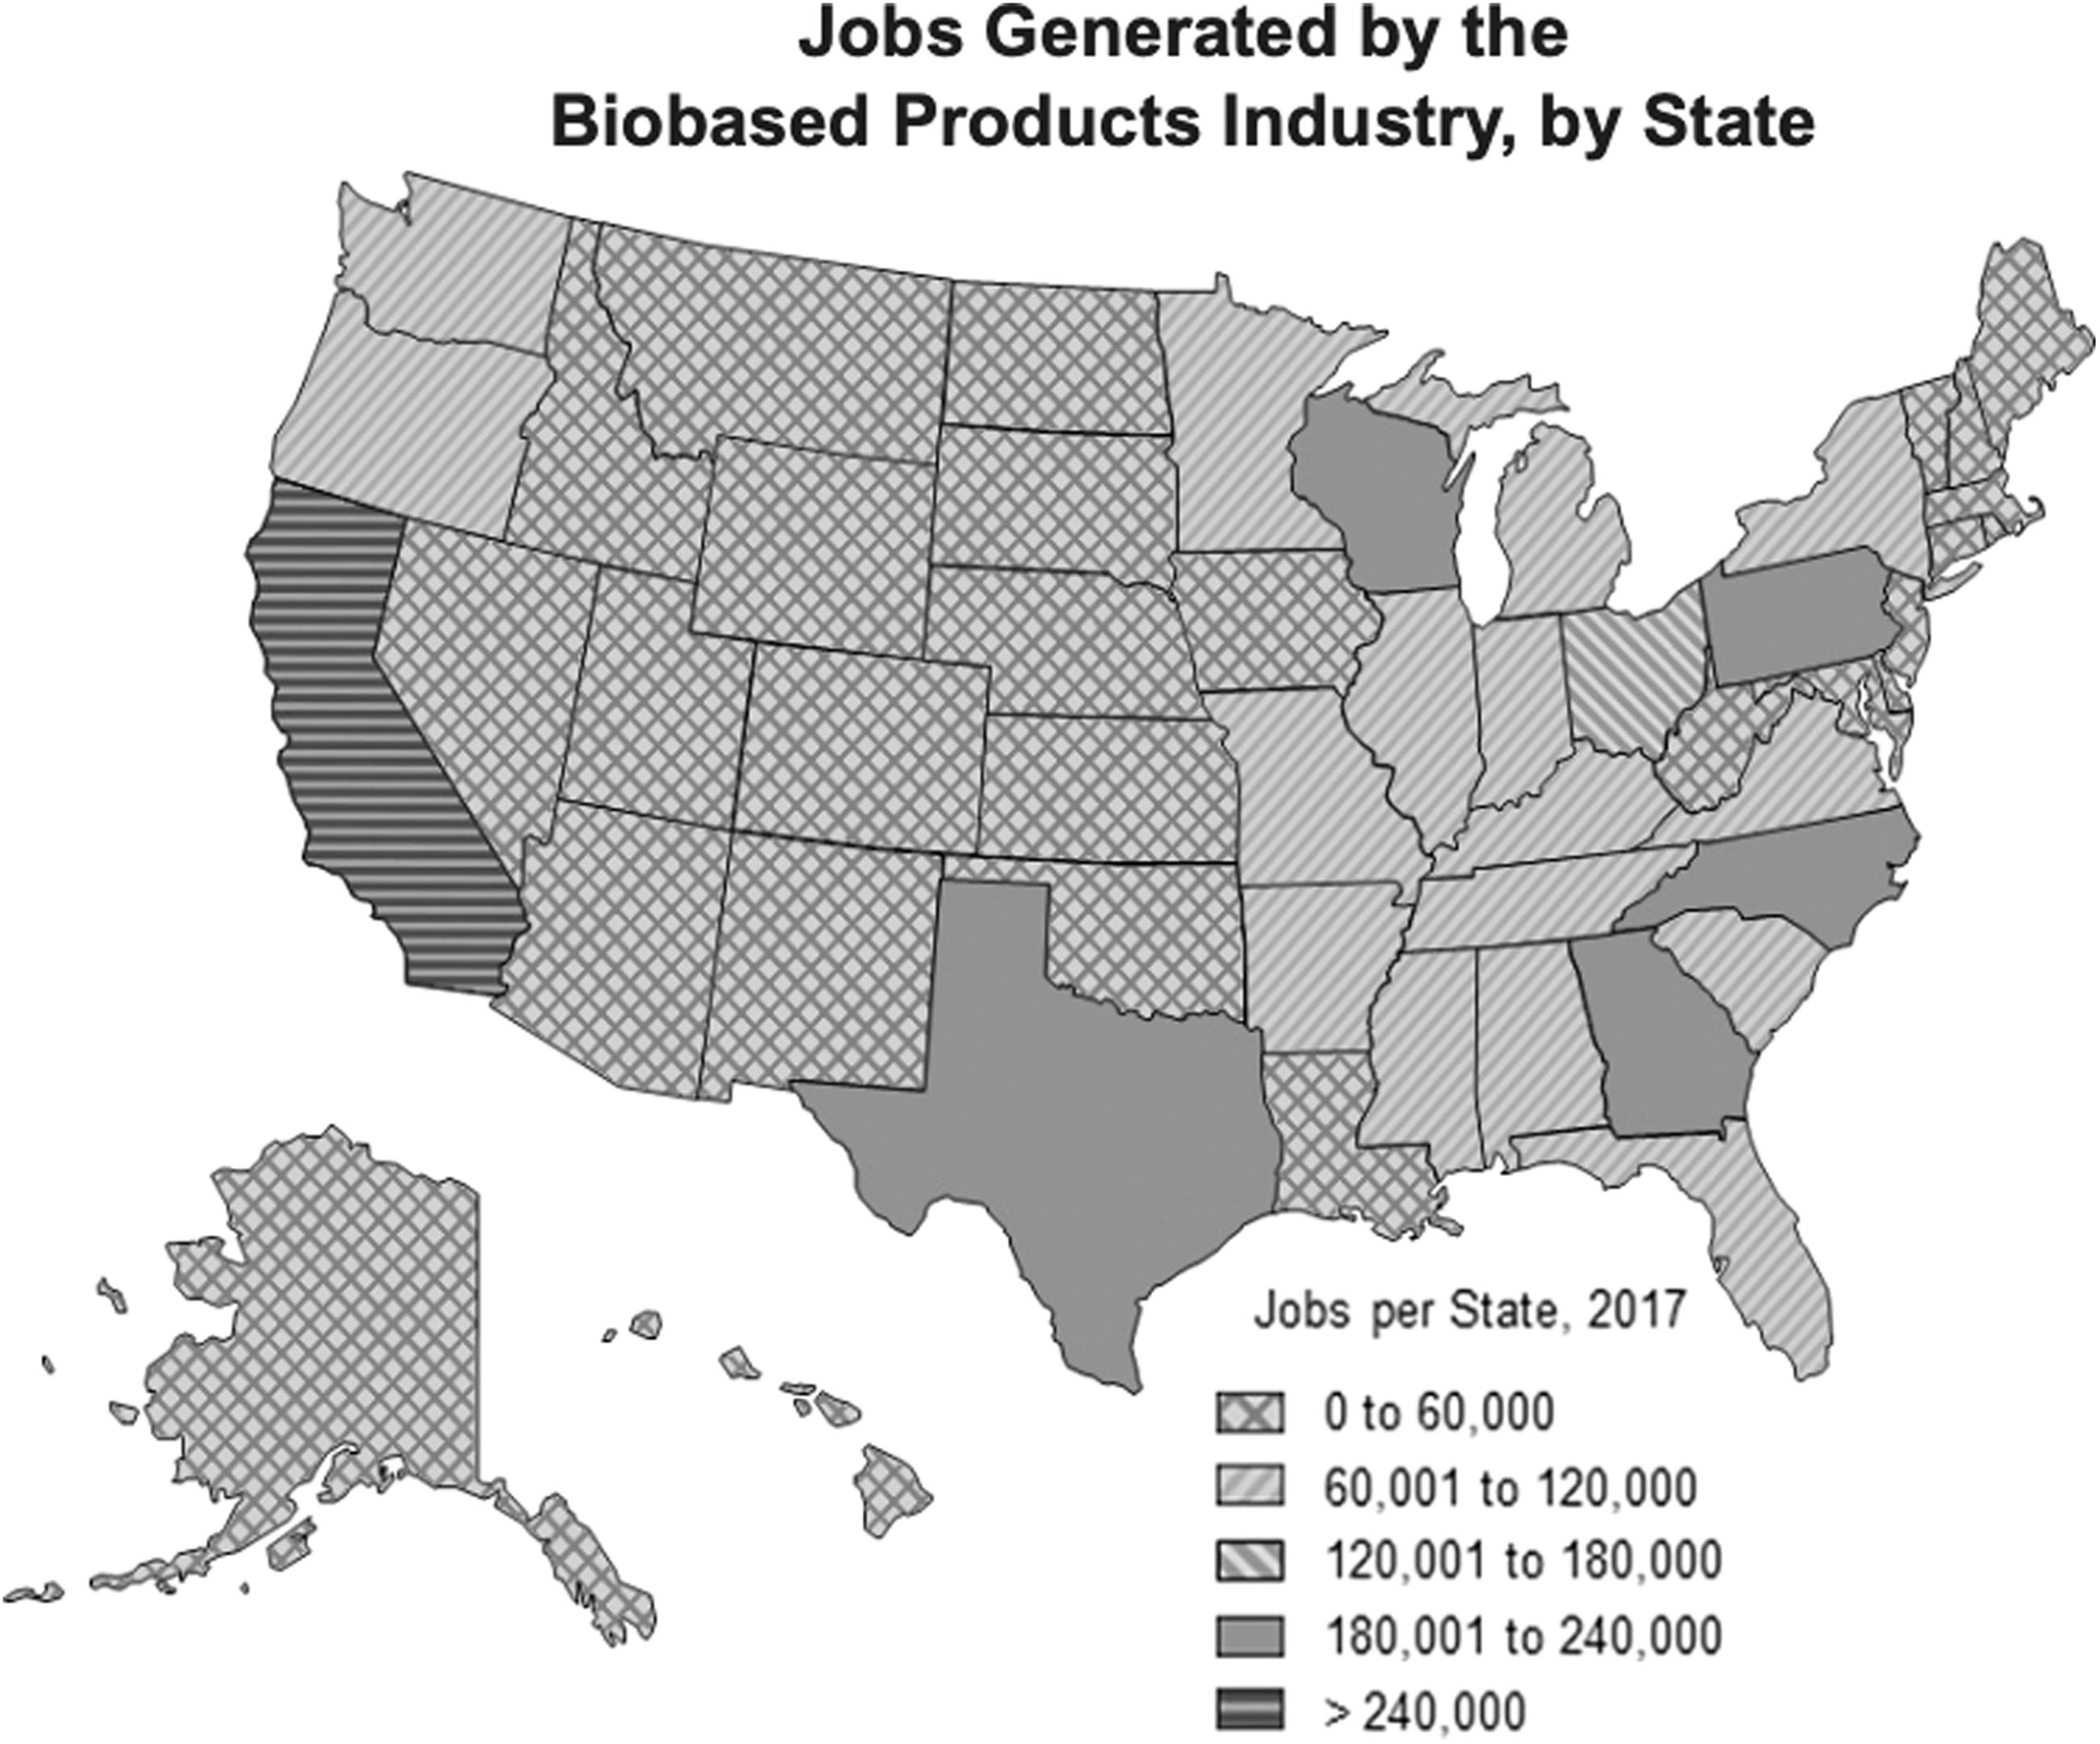
Jobs supported by the biobased products industry by state. Note: Higher numbers reflect a greater number of jobs in the biobased products industry at the state level relative to the US average.
The Quantity of Petroleum Displaced
The use of biobased products reduces the consumption of petroleum equivalents by two primary mechanisms. First, chemical feedstocks from biorefineries have replaced a significant portion of the chemical feedstocks that traditionally originate from crude oil refineries. Biorefineries currently produce an estimated 150 million gallons of raw materials per year that are used to manufacture biobased products. Second, biobased materials are increasingly being used as substitutes for petroleum-based materials, which have been used extensively for many years. An example of this petroleum displacement by a biobased material is the use of natural fibers in packing and insulating materials as an alternative to synthetic foams, such as Styrofoam. In this report, we updated the oil displacement values from the 2018 report to reflect economic growth. In 2017, the estimated oil displacement is estimated to be as much as 9.4 million barrels of oil equivalents.
Other Environmental Benefits
While only limited lifecycle analyses of the production of biobased products have been conducted, the key environmental benefits of manufacturing and using biobased products are 1) reducing the use of fossil fuels and 2) reducing the associated greenhouse gas (GHG) emissions. The previous paragraph presents an estimate of the petroleum displacement associated with the biobased products industry. The authors also estimated the GHG emission reductions associated with the production of biobased products as alternatives to petroleum-based products. This number was calculated for the 2017 report and is updated in this report to reflect economic growth. A literature review showed there are a wide range of GHG reductions resulting from the use of biobased products as an alternative to petroleum-based products. Using the upper range of GHG emissions reductions potential at an assumed 60% reduction, the analysis indicates that up to 12.7 million metric tons of CO2 equivalents may have been reduced in 2017. A 60% reduction is a conservative estimate based on the emissions reductions potential from the biobased chemicals and biorefining sectors. Given the increasing interest in and use of biobased products, it is essential to conduct additional analyses of their potential impacts on water quality, water use, land use, and other environmental impact categories.
The Economic Impact of Biobased Exports
Biobased products made in the United States are consumed both domestically and internationally. The economic contribution of biobased product exports calculated using the IMPLAN economic model and industry export data from IBIS World are estimated at 569,000 jobs and $59 billion in value added. The magnitude of these impacts illustrates the importance of biobased products trade to the US economy and to the rural economies that grow the agriculture inputs for the biobased products industry.
Areas in which The Use or Manufacturing of Biobased Products Could be More Effective, Including Identifying any Technical and Economic Obstacles and Recommending How Those Obstacles Can be Overcome
National and regional policies continue to incentivize the use of biobased feedstocks and the procurement of biobased products. Additionally, business-to-business programs continue to increase biobased supply chains and product offerings to customers.
Two events with potentially important implications for biobased products occurred in 2018-2019. The 2018 US Farm Bill (Agriculture Improvement Act of 2018) signed by the president on December 20, 2018 legalized the industrial use of hemp (containing no more than 0.3% THC). The new bill allows hemp cultivation, where in the past, hemp was limited to pilot projects. Already there has been a significant increase in businesses developing a new generation of products and rural companies manufacturing hemp fibers for numerous products including prosthetics, flooring, construction materials, and apparel.
The second event was an industry-led policy program. Smithfield Foods, the world's largest hog and pork producer, publicly announced it was going to implement a “manure-to-energy” project across 90% of its facilities. This program has the potential to create significant volumes of renewable biogas to produce biobased chemicals and other products in rural parts of the United States. While these public and private policy examples continue the positive momentum and expansion of biobased products and benefit the rural parts of the United States, there still exist a number of near- and long-term opportunities to further advance the biobased products industry. These opportunities include creating production credits, increasing the visibility of the USDA BioPreferred® Program's USDA Certified Biobased Product label, and the expansion of other related USDA programs. Our key recommendations include the following for the consideration of USDA and other relevant public and private sector organizations:
Modification of the North American Industry Classification System (NAICS) codes by the Office of Management & Budget (OMB) to include biobased products-specific codes for items such as biobased chemicals and plastics.
As stated in prior reports, the authors still see the need to improve the ability of the Federal Government, including the GSA and other acquisition departments of Federal agencies, to track the purchase of biobased products in acquisition systems. Currently, it is difficult to accurately determine the use of biobased products by the Federal Government.
Increase basic and applied research funding to universities for developing biobased feedstocks and products through the National Science Foundation (NSF), USDA, DoD, and the Department of Energy (DOE). This includes developing opportunities for overcoming economic disparities in the rural United States through the expansion of the biobased products industry.
Increase opportunities for private sector and university collaboration through ongoing NSF, USDA, and DOE grants. Many of the biobased product innovations available today began in university laboratories, and supporting the source of these important developments is vitally important for increasing the growth of the industry.
Leverage biobased product purchasing goals with the DOE and other Federal agencies. These recommendations all have a common theme of increasing collaboration between multiple industry partners, public sector organizations, academic institutions, consumer-marketing consultancies, and others. The goal is that by working together, the many challenges that exist in growing the biobased products industry can be addressed through alternative and innovative approaches that promote consumer awareness, utilize existing market and supply chain channels in different ways, and develop technologies that promote renewable resources in new and different markets
Introduction
The USDA Biopreferred® Program
Established by the Farm Security and Rural Investment Act of 2002 (2002 Farm Bill) and strengthened by the Food, Conservation, and Energy Act of 2008 (2008 Farm Bill), the Agriculture Act of 2014 (2014 Farm Bill), and the Agriculture Improvement Act of 2018 (2018 Farm Bill) the USDA BioPreferred® Program is charged with transforming the marketplace for biobased products and creating jobs in the rural parts of the United States. The program's mandatory Federal purchasing initiative and voluntary labeling initiative quickly have made it one of the most respected and trusted drivers in today's biobased marketplace. Visit
Strategic goals
The mission of the BioPreferred® Program is to facilitate the development and expansion of markets for biobased products. To accomplish this mission, the program has two broad strategic goals: 1) to advance the biobased products market and, 2) to increase the purchase of biobased products government-wide. As of May 2019, there were more than 15,000 products in the BioPreferred® Program's catalog.
Mandatory federal purchasing
Private and public purchasers look to the USDA BioPreferred® Program to ensure their purchases are biobased. Beginning in 2005 with its first designations of six product categories, the program has now designated 139 product categories representing approximately 15,000 products that are included in the mandatory Federal purchasing initiative. By providing a central product registry through its online catalog, accessible at
Voluntary consumer label
USDA introduced the BioPreferred® Program's voluntary labeling initiative to the consumer market in February 2011. To date, more than 3,500 products have been certified to display the USDA Certified Biobased Product label and the number of applications continues to increase. With a web-based application process, the USDA BioPreferred® Program makes it simple for manufacturers to apply for the label and track their applications. The program's partnership with ASTM International ensures quality control and consistent results, and offers purchasers of biobased products a universal standard to assess a product's biobased content.
Economic Impact Analysis
Total US Biobased Products Industry
In this section, we examine in detail the major sectors of the biobased products industry in the United States. For each sector, we discuss the raw materials, processing steps, intermediates, and products introduced into the economy. The data provided includes major US and global firms, total value added to the US economy in 2017, and the number of direct, indirect, and induced jobs supported by the sector in the United States. The distributions of economic value added and employment by subsector are also provided. Case studies and interviews with companies in the forefront of the biobased products industry are interspersed within this section.
Figure 2 shows the aggregate effect of the biobased products industry on employment and gross domestic product in the United States in 2017. The total contribution of the biobased products industry to the US economy in 2017 was $470 billion, and the industry employed 4.6 million workers. Each job in the biobased products industry was responsible for supporting 1.79 jobs in other sectors of the economy. Figure 2 shows these numbers in more detail. The 1.65 million jobs directly supporting the biobased products industry resulted in 2.96 million spillover jobs, which includes indirect jobs in related industries and induced jobs produced from the purchase of goods and services generated by the direct and indirect jobs. Figure 3 compares the economic impact of the biobased products industry from 2013 to 2017.
Figure 5 illustrates how the value-added produced by the biobased products industry is allocated across each state (using an approximated range), and Figure 6 shows the number of jobs the biobased products industry supports by state. An important conclusion from these figures is that the biobased products industry affects every state in the nation and that its impact is not just confined to states where agriculture is the main industry.

Direct value added contributed by the biobased products industry in each state and the District of Columbia in 2017.
Direct jobs contributed by the biobased products industry in each state and the District of Columbia in 2017.
Table 1 lists the top 10 states that contributed to the biobased products industry for the most recent data modeled at the state level (2017) and the percent change between 2013 and 2017.
Top 10 States for Direct Value Added to the Biobased Products industry in 2017 and Percent Change Between 2013 and 2017
Defining The Biobased Products Industry
The bioeconomy is “the global industrial transition that utilizes biotechnology in creating renewable terrestrial and aquatic resources in energy, intermediates, and final products to the benefit of economic, environmental, and social concerns.” 1 This transition within the US economy also aims to create and maintain national security through renewable resources and energy. This report focuses on the biobased products industry, a part of the bioeconomy. The biobased products industry includes the following seven major sectors of the US economy: Agriculture and Forestry; Biorefining; Biobased Chemicals; Enzymes; Biobased Plastic Bottles and Packaging; Forest Products; and Textiles.
These analyses specifically exclude energy, livestock, food, feed, and pharmaceuticals. One of the limitations of undertaking this research is that, at present, no NAICS codes have been established specifically for biobased products. The NAICS is the standard used by Federal agencies in classifying business establishments for the purpose of collecting, analyzing, and publishing statistical data related to US businesses. This limitation is discussed further in the Recommendations section. Despite the lack of specific data on biobased products, the authors developed an extensive database of applicable NAICS codes that represent the associated sectors. For instance, while there is no NAICS code for “biobased chemicals,” there is an exhaustive listing of “chemical” sectors, such as paints and adhesives, other basic chemicals, plastics, and artificial fibers. These sectors represent segments of the US economy that include biobased chemicals. A complete listing of all the modeled NAICS codes used is provided at the beginning of the section on each sector.
Next, the authors developed an estimate for the biobased percentage of each sector. For example, what percentage do biobased chemicals comprise of the total chemical sector? To accomplish this task, the authors analyzed the peer-reviewed literature, domestic and international reports, related literature from industry and trade organizations, and market intelligence reports. The authors also conducted interviews with representatives from industry, various organizations, academia, and the government. Table 2 provides the estimated percentage of each sector comprised of biobased products (for example, the estimated percentage of the chemicals industry comprised of biobased chemicals is 4%). 7 -12
Percentages of Biobased Products in Each Sector of the US Economy in 2017
Where conflicting percentages were presented, the authors elected to utilize the lower, more conservative estimates. The full report, available at
For more details on Agriculture and Forestry, Forest Products, and Textiles, please see full report, available at
Biorefining
Biorefining is an innovative alternative to the production of petroleum-based energy, and it is an important part of emerging biobased economies (Fig. 7). Over the next five years, the global market for biorefining is expected to increase to almost $717 billion, with a compound annual growth rate (CAGR) of 8.9%. North America and Europe lead the world market, but the Asia Pacific market is expected to have the highest growth rate in the coming years. This positive outlook from the industry is largely due to the volatile prices of fossil fuels. Growth in the sector is limited in that major investment and technological costs are required to open a new biorefinery and there is a shortage of biomass suppliers. However, the potential unpredictability in this sector will be stabilized to some extent by increased awareness of sustainability issues and the consequences of burning fossil fuels, and the industry's interest in developing biobased products.
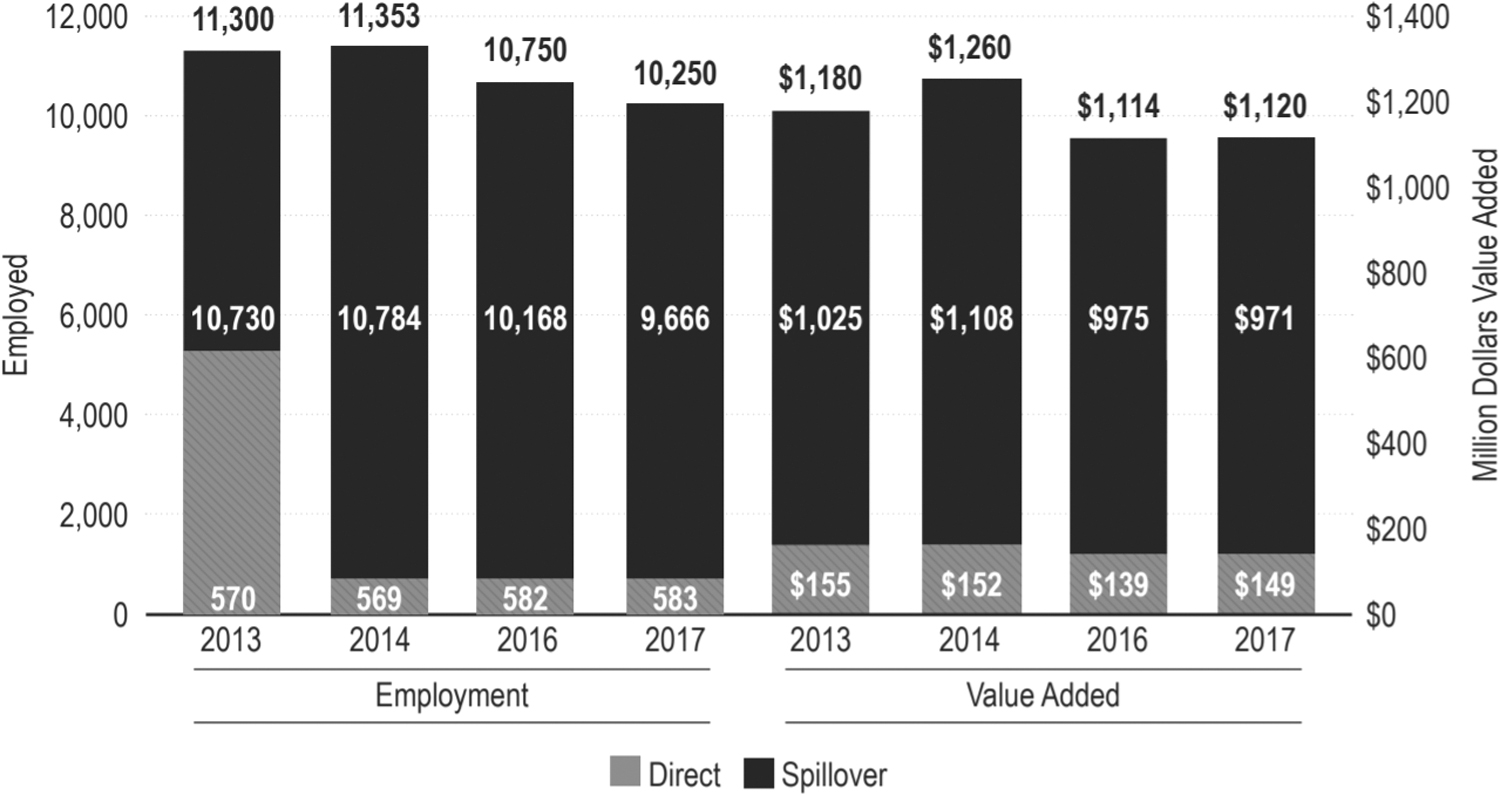
Biorefining sector contribution to employment and value added in 2013, 2014, 2016, and 2017.
Biorefineries are an important pathway to help revive marginalized, rural, agricultural, and industrial economies (Table 3). Biorefineries can help usher in a new economic engine and support local communities, from farmers to local governments, by creating a steady source of revenue. Biorefineries help farmers keep their land and provide an additional base from which they can sell their products. 13 The taxes generated benefit local governments. Further, supporting rural economies with large-scale investments, such as biorefineries, will help reduce the pattern of rural to urban migration that is taking people away from farmlands. Biorefineries establish energy security by reducing the US's dependence on foreign oil and create steady, well-paying, knowledge-based jobs. 14
Distribution of Direct Value Added and Employment by Biorefning Sub-Sectors
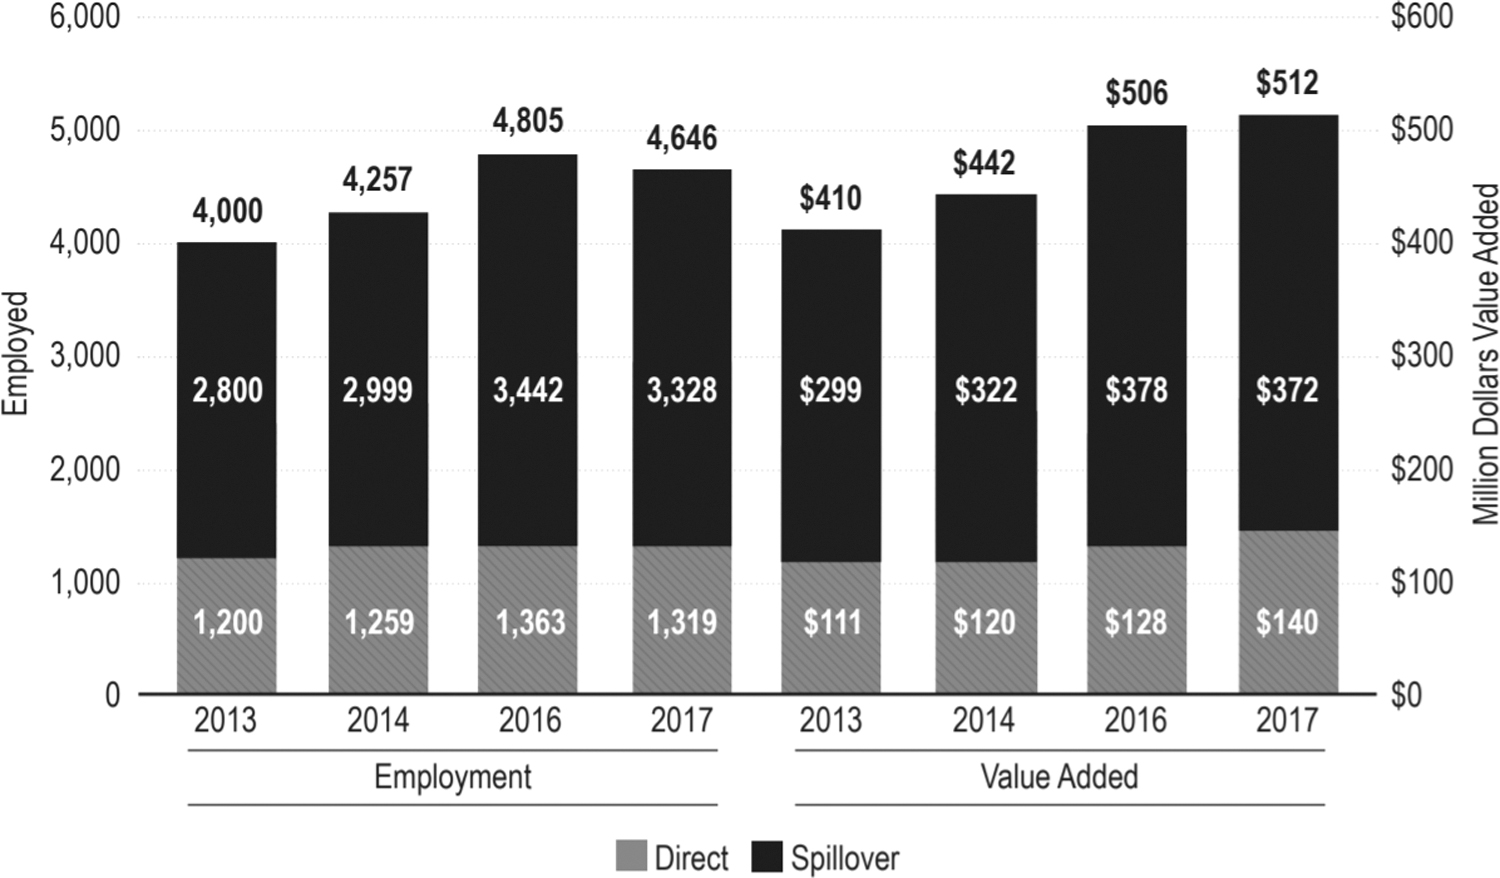
Biobased Chemicals
Biochemicals (Fig. 8) currently make up a very small segment, estimated at less than one percent of the overall revenue, of the chemical industry. This section and the subsequent sections describe the chemical manufacturing industry, not the biochemical manufacturing industry. As such, the authors have covered the developments in the chemical industry by highlighting opportunities for biobased chemicals.

Biobased chemicals sector contribution to employment and value added in 2013, 2014, 2016, and 2017.
The chemical manufacturing sub-sector transforms organic and inorganic raw materials into various chemicals. Products that are further processed, such as resins, plastics, and soaps, are categorized uniquely to distinguish them from production of basic chemicals. The primary sub-sectors within this sector, as defined by their NAICS codes, are basic chemical manufacturing, plastic and resin manufacturing, soap and cleaning compounds, and cosmetic and beauty products (Table 4). 15 The United States is a global leader in chemical production, second only to China. After struggling for most of the past five years, the industry is expected to rebound over the coming five years and grow at an annual rate of 2.1%. Increased demand from downstream consumers signals a return to increased revenue and profits for the industry. 16
Distribution of Direct Value Added and Employment by Biobased Chemicals Sub-Sectors
Consumer spending and manufacturing have a direct effect on chemical demand since 96% of all products made in the United States require chemical inputs. Therefore, an increase in the industrial production index, which tracks the mining, manufacturing, electric, and gas industries, directly affects demand for chemicals. The construction industry is also important to chemical manufacturing in that it is a key supplier to the industry and is also a marker of the health of the overall economy.
The current, modest growth in emerging economies abroad is a good sign for industry exports, even as the industry battles against the trade-weighted index. It remains to be seen how strong the dollar will become over the coming years and what kind of detrimental effect this will have on exports. As producers benefit from lower operating costs, revenue is mitigated further by increases in wages and increases in input prices.
Chemical prices over the past five years have been extremely volatile, particularly due to crude oil prices. This volatility occurs because chemicals are the most influential raw materials from the standpoint of what industries must pay to obtain them. The biobased chemical industry offers an alternative model for sourcing raw materials independent of fossil fuels. This provides chemical manufacturers the ability to conduct long-term planning using steadier inputs. Major industry giants, such as DowDupont and the Sherwin-Williams Company already have committed themselves to a turn towards the biobased industry. Further, the awareness and demand for green products and sustainable business models will encourage companies, both large and small, to explore the biochemical industry and invest in it.
Plastic & resin manufacturing
The plastic and resin manufacturing industry produces synthetic rubber, thermoplastics, and thermosetting resins. While demand has been steady, the volatility of the prices of raw materials has caused revenue to decrease over the past five years. Demand from construction and manufacturing industries is a key marker for success in this industry. Over the five-year period from 2018 to 2022, annual growth is expected to increase by 0.3%. Exports, during the same period, are expected to increase by 0.4%.
Synthetic fiber manufacturing
The synthetic fiber industry relies heavily on several key downstream purchasers, from carpet and textile mills to manufacturers of industrial products. As some of these industries slowed in recent years, the synthetic fiber industry was also less profitable. Exports also decreased as the US dollar gained in value, and imports became more affordable, which weakened domestic demand even further. Over the next five years, from 2018 through 2022, revenue is expected to recover somewhat, with an increase of about 1.1%. This increase is expected because of a healthier economy, specifically a strong construction market and more disposable income.
Soap & cleaning compound manufacturing
Over the past five years, foreign competition and volatile oil prices have put a strain on the industry's profits. Between now and 2022, manufacturers are expecting to have to contend with this competition by producing high quality, brand name, environmentally-friendly products that capitalize on increased disposable income. Industry leaders will explore products that feature “biodegradability, aquatic toxicity, renewable feedstock, and carbon dioxide emissions.” However, as the dollar appreciates, exports in this industry are expected to decrease sharply to 6% over the next five years. Biobased chemicals are an important growth factor in this sub-sector, because consumers are more concerned about using natural organic and plant-based compounds in their soap.
Cosmetic & beauty products manufacturing
This industry produces a wide range of products, from essentials, such as deodorant and body wash, to discretionary items, such as creams and lotions. Consumer demand for environmentally friendly products with natural ingredients is helping to create a new market that relies on biobased products. As companies in the United States expand their reach globally, exports are expected to increase by 4.6% in the period between 2018 and 2022, while overall revenue is expected to have very modest growth of 0.6%.
Ink manufacturing
Restructuring will continue in the ink manufacturing industry between 2018 and 2022 as it grapples with declining print media, ranging from newspapers to books. Increased consumer spending and the associated labeling and packaging that require inks are one bright spot, but, overall, this industry will continue to shrink at a rate of 1.5%. Exports also are set to decrease by 0.9% due to the increasing competition from foreign producers. The authors estimated that biobased plastic production in the United States was approximately 0.3% of the total annual production of plastic, and the authors estimated that the entire chemical sector was 4% biobased chemicals. 17 Estimates of the future penetration of the market by commodity chemicals by 2025 vary from as little as 6–10% to as much as 45–50% for specialty and fine chemicals. 18-19
Enzymes
Enzymes (Fig. 9) 20 are used in a wide range of industrial sectors, including the production of biofuels, washing detergents, foods and animal feed, and biobased chemicals (Table 5). Unlike chemical catalysts, enzymes have an active site of specific size and form that will fit only a specific range of substrates for a very specific reaction. Enzymes are used as detergents in the textile sector to break down protein, starch, and fatty stains in the finishing of fabrics. They are also used in the biofuels industry in the conversion process of first generation feedstocks and in the conversion of agricultural wastes (second generation) into ethanol and in several other industrial sectors, such as paper and pulp, wine making, brewing, and baking.
Enzymes sector contribution to employment and value added in 2013, 2014, 2016, and 2017. 20
Distribution of Direct Value Added and Employment by Enzymes Sub-Sectors
Globally, the industrial enzyme market greatly contributes to the annual revenue and is a major driver for innovation across a number of industries. The industrial enzyme market in the United States was estimated at $1,315 million in 2016 and is expected to grow at a CAGR of 5.6% in the period 2017–2022. 21 This positive outlook is owed to a number of factors, ranging from government legislation to growing demand in a number of key industries. 22 The United States and many countries in Europe, including France, Germany, and Sweden have especially supportive policies. The use of enzymes in the production of paper, rubber, photography, and detergents, to name a few, is expected to drive expansion as well. 22 New research in forensics and molecular biology will also help drive innovation and meet demand. 22
Enzymes are proteins that promote specific chemical reactions and are the foundation for the metabolism of living organisms. These reactions speed up biochemical processes, making them more efficient by using less energy and resources. Humans have been using enzymes to produce biochemical reactions for thousands of years, with the earliest example being the fermenting of crops into wine and beer. While there are more than 4,000 recognized enzymes in the world, it is estimated that more than 25,000 exist in the natural world. With an estimated 90% of enzymes yet to be classified, this indicates an enormous possibility for innovation and growth. Industrial enzymes serve a dual function within the biobased industry. By facilitating biochemical reactions, enzymes directly reduce the use of petrochemicals and a reliance on fossil fuels. At the same time, enzymes, their feedstocks, and their byproducts are biodegradable, and reduce industrial waste headed to landfills. One area in which there is considerable excitement within the industry is the modification and specialization of existing enzymes. New research into redesigning enzymes will help industrial processes become even more efficient and environmentally preferable.
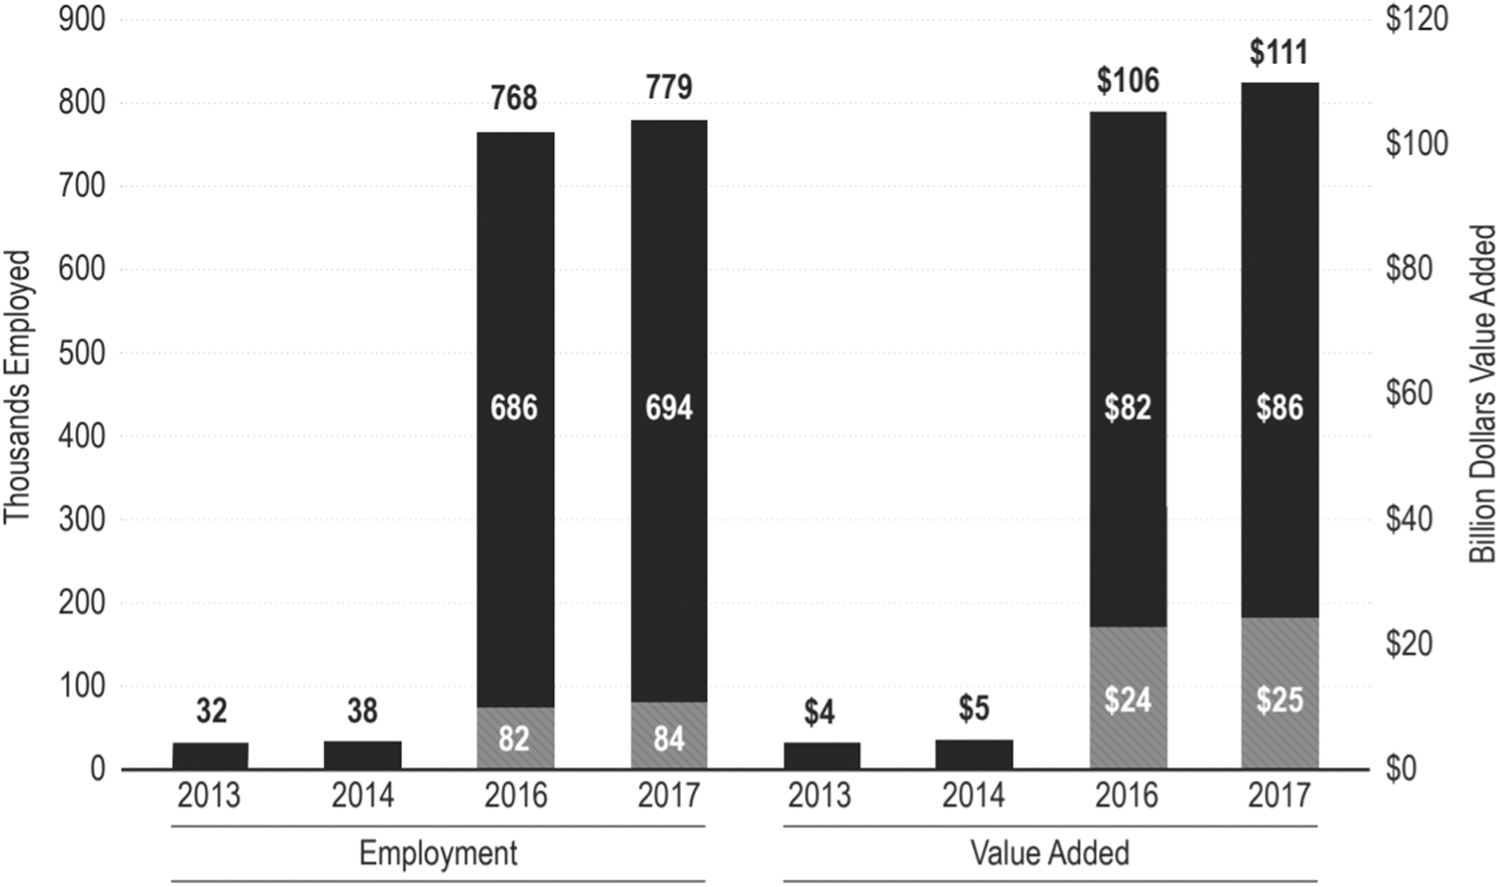
Biobased Plastic Bottles and Packaging
Among the seven biobased product sectors, biobased plastics (Fig. 10, Table 6) is the one in which new technologies and changes will be most recognizable by consumers.
Biobased Plastic Bottles and Packaging Sector Contribution to Employment and Value Added in 2013, 2014, 2016, and 2017.
Distribution of Direct Value Added and Employment by Biobased Plastic Bottles and Packaging Sub-Sectors
The biobased plastics manufacturing sector is relatively young and has a positive growth forecast estimated at 4.5% to 2023. New manufacturers, new products, and new markets all contribute to this growth. In addition, the increasing awareness of sustainability, both on the part of producers and consumers, helps drive innovation and demand. Exports account for about 5% of total revenue, which is $177.9 million annually.
Support from the US government, specifically the BioPreferred Program, helps provide the framework required for the expansion of the sector. Additional favorable legislation would further benefit the industry since it is part of a competitive market. Strong economic conditions worldwide are key markers for growth. Typically, as consumers spend more money, the demand for packaged products increases accordingly. Volatility in the price of crude oil is another indicator for growth in biobased plastics. When oil prices fluctuate, companies turn to biobased plastics as an alternative to petroleum-based plastics to obtain more stable pricing. As environmental awareness expands worldwide, consumer demand will encourage manufacturers to explore renewable resources further. Voluntary steps toward environmentally preferable packaging by industry leaders, such as Coca-Cola and PepsiCo, create market opportunities while setting a precedent for change across sectors. As biobased plastics become more mainstream, consumers will expect more companies to follow suit. This will create further innovation and technological advances that will help manufacturers expand into other sectors beyond packaging, such as construction and medical supplies.
Exports
Exports in the biobased plastics sector have been decreasing slowly as global production catches up with production in the United States. Currently, Asia is producing more than half of the world's biobased plastics. Biobased plastics exports from the United States are destined primarily for China (39.4%), Taiwan (27.6%), Japan (9.8%), and Hong Kong (6.3%). Exports are expected to account for about 5% of total revenue.
Products
Biobased plastics are plastics manufactured from renewable biomass, such as vegetable oil, cornstarch, pea starch, and microbiota. Generally, biobased plastics are assigned to four categories, i.e., cellulose-based, glucose-based, starch-based, and synthetic-based biobased plastics. Cellulose-based biobased plastics represent about 15% of the sector's revenue.
Cellulose materials, such as acetate, are modified from sources such as cotton, hemp, and wood pulp. These plastics are used in a wide range of applications, from packing confectionaries to DVDs. The use of cellulose polymer materials, such as cellulose film, has been decreasing as other polymers, such as propylene, have become more popular. Overall, cellulose-based biobased plastics have been losing market share.
Glucose-based biobased plastics are produced from polyhydroxibutyrate, which is derived from sucrose through bacterial fermentation. The bacterial component makes the end product alterable for different uses. Polylactides (lactic acid polymers or PLA) are another glucose-based plastic that is composed of lactose derived from beet sugar, potatoes, or wheat. These biobased plastics are water-resistant, and used to make food packaging, cups, bottles, carpets, and clothing. These plastics account for 10% of the sector's revenue.
The sale of starch-based biobased plastics contributes an estimated 55% of the sector's revenue, which is the largest share of any of the biobased plastics. These plastics are used mainly for food-service tableware. They can be manufactured from raw or modified starch or what is known as thermoplastic starch (TPS), as well as by fermenting starch-derived sugars, known as PLA. Cassava, potatoes, and wheat are common sources of starch.
Synthetic-based plastics are unique polymers that include lignin-based biobased plastics, which use byproducts from the paper-milling industry. Synthetic- based plastics make up about 20% of the industry's revenue.
Markets
The biobased plastics sector manufactures products for several industries that can be categorized into three primary groupings: packaging, bottles, and transportation.
Packaging comprises the largest share of the market for biobased plastics, accounting for 36.5% of total revenue. Packaging is used for food, electronics, and toys. Demand in this market reflects the overall status of the economy since a growing economy and the resulting increases in consumer spending increase the demand for packaging.
Plastic bottles account for about 32.3% of the industry, with industry leaders, such as The Coca-Cola Company, providing the largest markets. The main drivers of growth in this market are the increasing awareness of global environmental issues and the desire to appeal to consumers' concerns. Concern about petroleum-based plastics emitting toxins into drinking water and increasing prices for oil also benefits this sector. Volatile oil prices make plant-based bottles more appealing to manufacturers. It is expected that the market share of plastic bottles will continue to increase.
The use of biobased plastics in the transportation industry is a relatively new innovation. Automakers are replacing traditional plastics with biobased plastics, primarily due to their lighter weight. This sector also depends heavily on a strong economy since sales of cars increase and decrease depending on the state of the economy. This sector accounts for about 9.3% of total revenue.
Labor and research
This industry continues to expand as new research produces additional innovations. Legislative support and funding for university-level research are important for the future biobased plastics, as is the case for the entire biobased industry. Because the biobased industry relies on the results of ongoing research, labor costs in this industry, at 17.8% of revenue, are much higher than labor costs in other manufacturing industries. The industry requires highly skilled labor, with the majority being scientists and engineers who specialize in renewable resources. The average salary in this industry is approximately $70,000 per year.
Editor's Note
This report was excerpted with permission from USDA Rural Development. The full report (