
Abstract

Introduction
In November 2022, Synonym launched Capacitor (
Over the past few years, billions of dollars of investment have flowed to synbio companies whose innovations will help us build a more sustainable, adaptive and resilient global industrial economy. But achieving commercial adoption requires a network of large-scale infrastructure, which as shown in the Capacitor data, doesn't yet exist.
In this report, we share some key takeaways and trends from Capacitor. Our goal is to help the community understand the current fermentation production capacity network and the gaps that we need to address to ensure industry success over the long term.
We're encouraged by sustained user engagement and much-needed dialogue around biomanufacturing capacity that Capacitor has generated and aim to keep this topic top-of-mind for all of the bioeconomy's stakeholders. We're equally as excited about the connections that Capacitor has made between capacity-seekers and capacity-providers and can't wait for more of these stories.
Key Takeaways
With 1,000+ registered users, 200 facilities and 20+ required specifications per facility, we've sifted through lots of data to understand the current supply of and the demand for microbial fermentation capacity.
This report highlights trends in the data so that the ecosystem understands the major infrastructure gaps we need to overcome for biomanufacturing to become a powerful building block in a greener global economy.
Our top three takeaways are:
There are many stakeholders interested in fermentation and we expect to see more over the coming quarters
From a geography and sector perspective, there are lots of organizations that are interested in learning about fermentation capacity. While we assumed that our users would be concentrated at US-based synbio companies, it turns out the constituency has been far broader. We have users logging on from all over the world, with over half of them coming from outside of North America and a substantial portion of them coming from non-profits, consultancies, large food corporations and financial institutions.
It's a reminder that the bioeconomy will require collaboration across international, cross-functional and public-private groups to succeed and Capacitor's diverse user base drives this point home.
Existing fermentation capacity turns up in all sorts of places
While most of the recent press focuses on the gaps in current fermentation infrastructure, there actually are many facilities that exist today. The majority of the current facilities are bench or pilot scale and are located in the Americas or Europe. Capacitor facilities contain over 30 million liters of fermentation capacity and the many of the facilities have bioreactors up to the 20,000 liter size. If you're a startup in one of these regions and are looking for smaller-scale capacity, you may not immediately run into the capacity bottleneck issue that more mature synbio companies are facing in their effort to scale up and decrease costs to compete with legacy animal-derived or petroleum-based products.
But existing fermentation capacity doesn't match what the majority of users are seeking
While there is definitely a decent network of bench and pilot scale capacity in the Americas and Europe. Capacitor users are predominantly seeking and filtering for facilities with technical specifications that don't match the available capacity. For example, the most commonly used filter on Capacitor is ‘Size of Bioreactors' and more than half of the time, users are filtering for bioreactors that are larger than 20,000 liters. When looking at the data, less than 20% of Capacitor facilities have bioreactors that are larger than 20,000 liters. This is one of the many mismatches that we've identified between what existing facilities provide and what the users increasingly need. We hope this will help the ecosystem understand which gaps need to be addressed as more facilities come online in the near future.
About the Report
Capacitor is the most comprehensive and free database of microbial fermentation facilities worldwide. Synonym released the product in November 2022 with knowledge partnership participation from The Good Food Institute, Blue Horizon and Material Innovation Initiative. Capacitor aims to help synthetic biology (‘synbio’) companies more easily find capacity and connect with production partners to scale.
Methodology
To build the Capacitor directory, our team conducted direct outreach to facilities. The facility data included in this report was collected from June 2022 to February 2023 via direct contact with facilities and secondary research. Our team makes every effort to ensure accuracy of our facility data with ongoing follow-ups and updates to facilities. We continue to add or remove facilities as they come online or offline.
The Data
Capacitor has 200 facilities listed in over 30 countries (Fig. 1). The majority of the capacity that has been uploaded to Capacitor is in Europe (∼20.1 million liters), followed by the Americas (∼9.3 million liters). There is less capacity in APAC that has been uploaded (∼1.5 million liters) but we expect to see this figure grow as biomanufacturing becomes more mature and more contract development and manufacturing organizations (CDMOs) are established in the region. We expect the capacity numbers (in all regions) to increase as we make the database more complete.

Total capacity (in millions of liters) and total number of facilities uploaded.
Facility Technologies
The facilities that have been uploaded can support any part of the microbial fermentation value chain, including feedstock processing, fermentation, biomass recovery, purification, drying, secondary processing, and packaging (Fig. 2). The majority of facilities on Capacitor support the upstream fermentation process (79%). Many of these facilities, however, are also capable of supporting other parts of the fermentation value chain such as biomass recovery (58%), purification (69%) and drying (47%).
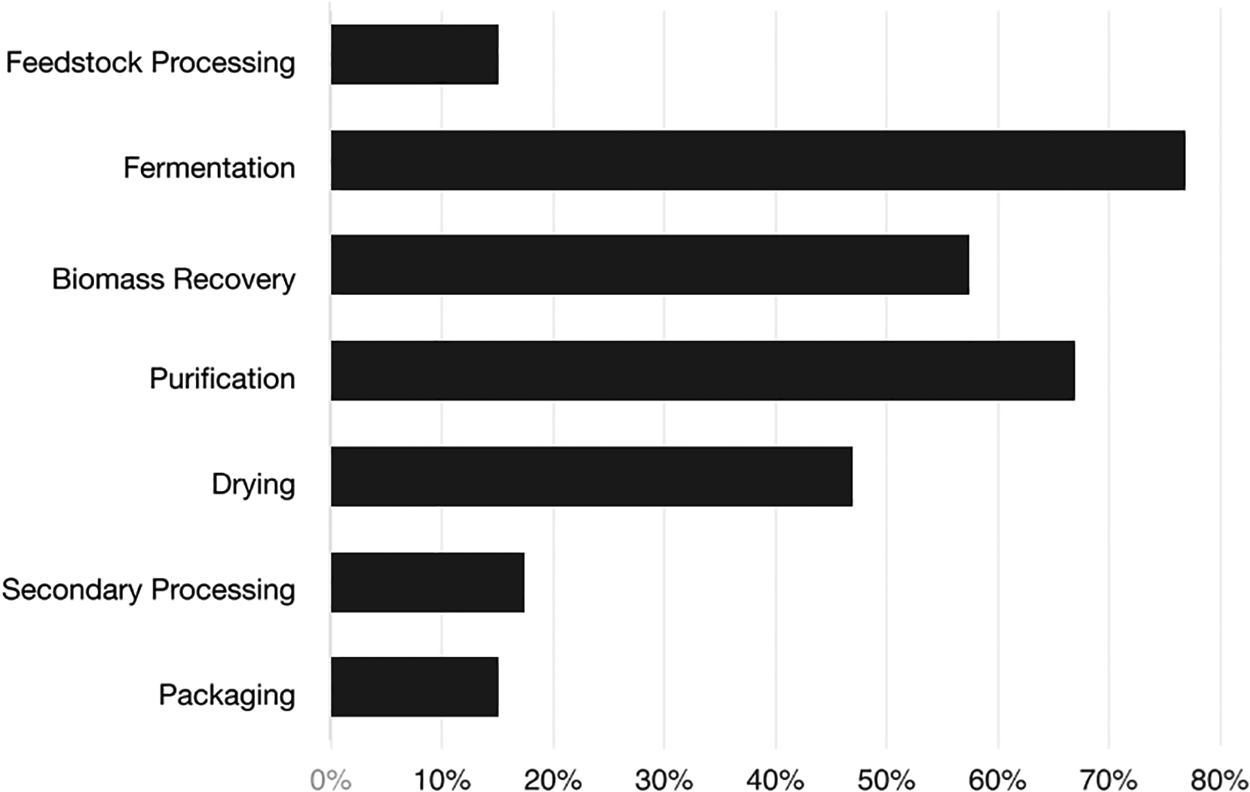
Percentage of facilities that offer each technology.
WHAT USERS ARE SEEKING
The majority of users filtering on the ‘Facility Technology’ are looking for fermentation. After fermentation, users are most often looking for facilities that can support purification and drying. The data for ‘Facility Technology’ aligns well with what the users are demanding.
Facility Sub-Technologies
Looking at the technologies in more detail through the sub-technology filters, we see similar trends to the facility technologies data. The most common facility sub-technology across all regions is aerobic fermentation (73%), followed by centrifugation (62%), chromatography (47%) and ultrafiltration (41%) (Fig. 3).

Percentage of facilities that offer each sub-technology.
WHAT USERS ARE SEEKING
The majority of users filtering on ‘Facility Sub-Technology’ are seeking aerobic fermentation, followed by anaerobic fermentation, spray drying and centrifugation, all of which are some of the top sub-technologies offered by the facilities on Capacitor. However, there's a large difference in the facilities that offer aerobic fermentation (73%) and centrifugation (62%) from those that offer anaerobic fermentation (31%) and spray drying (35%), despite users showing strong interest in all of these sub-technologies.
Facility Scale
The majority of the facilities on the platform are bench-scale (29%) and pilotscale (41%) and most are located in the Americas and in Europe (Fig. 4). Based on the current landscape, there are far fewer demo-scale (15%) and commercial-scale (16%) facilities, which is why most of the recent dialogue around biomanufacturing capacity advocates for the development of largerscale infrastructure.
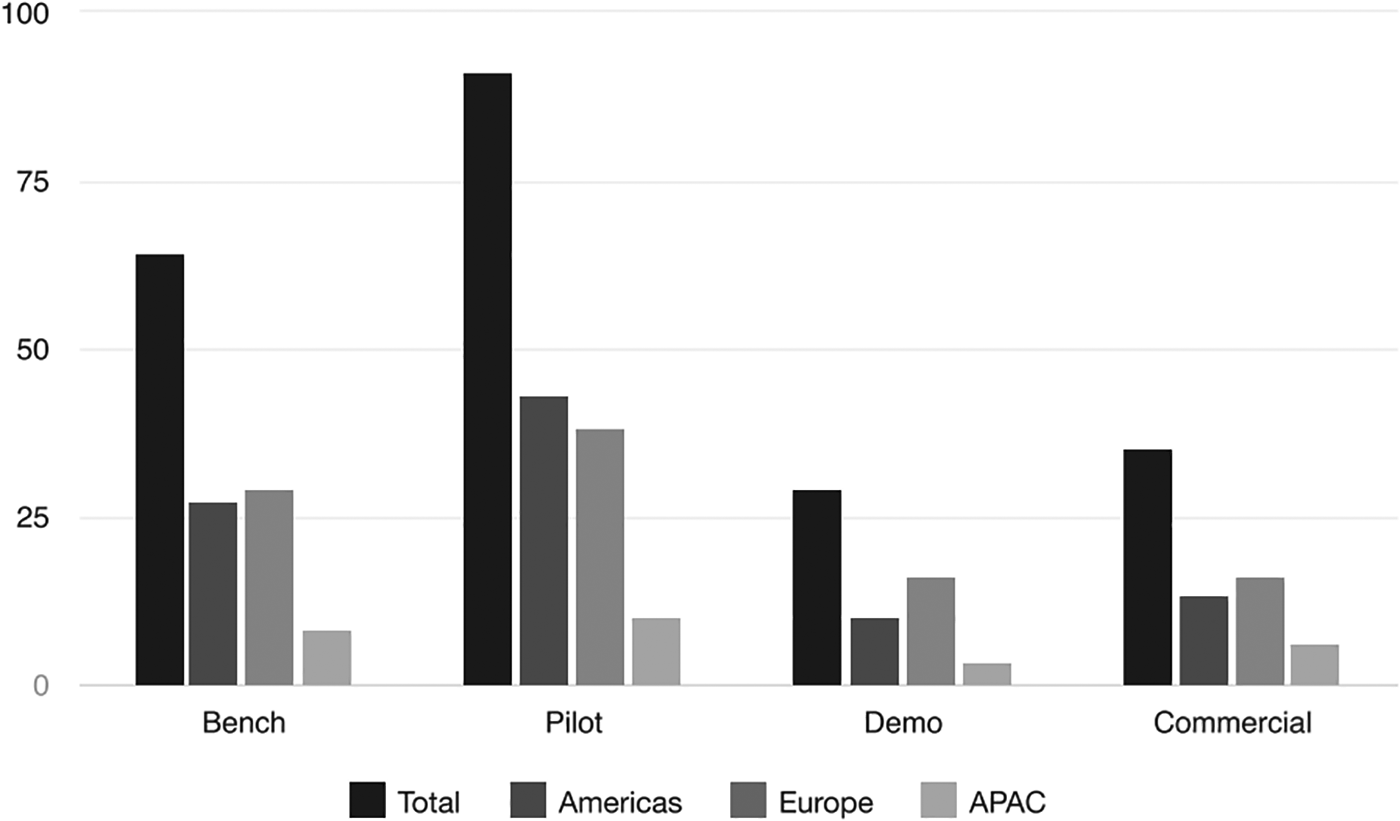
Number of facilities by scale.
WHAT USERS ARE SEEKING
There are some users who are filtering for smaller-scale (bench and pilot) facilities, but the majority of users filtering on ‘Facility Scale’ are looking for commercial-scale (34%) or demo-scale (24%) facilities that simply don't exist to meet current, let alone future demand. This mismatch represents a gap in the existing fermentation infrastructure network and is a clear indication why there is a lot of focus on building large-scale capacity in the coming quarters.
Since scale means different things to different users, we also plotted the number of facilities in a range of total capacity buckets (Fig. 5).

Distribution of facilities by total capacity ranges. Note: Facilities that have not provided their total capacity are not included in this chart.
Nearly 30% of the facilities on the platform have between 1,001 and 10,000 liters of capacity. Beyond that, over 63% of the facilities fall between the 101 and 50,000 liter range. Roughly 12% of the facilities have over 500,000 liters of total capacity.
Size of Bioreactors
As companies scale-up their bioprocesses, they need to gradually increase the size of the bioreactor in which production occurs (Fig. 6). Based on the facilities in Capacitor, 91 have bioreactors in the 100 L to 1,999 L range and 86 have bioreactors in the 10 L to 99 L range. As the size of bioreactors increases, the number of facilities that have these tanks decreases substantially. There are 48 facilities with bioreactors in the 2,000 L to 19,999 L range and only 20 facilities with bioreactors in the 20,000 L to 99,999 L range. There are very few facilities with tanks greater than 100,000 L.

Number of facilities with size of bioreactors in specific ranges.
WHAT USERS ARE SEEKING
As companies scale-up their bioprocesses, they need to gradually increase the size of the bioreactor in which production occurs. Based on the facilities in Capacitor, 91 have bioreactors in the 100 L to 1,999 L range and 86 have bioreactors in the 10 L to 99 L range. As the size of bioreactors increases, the number of facilities that have these tanks decreases substantially. There are 48 facilities with bioreactors in the 2,000 L to 19,999 L range and only 20 facilities with bioreactors in the 20,000 L to 99,999 L range. There are very few facilities with tanks greater than 100,000 L.
Product Expertise
The facilities on Capacitor have manufactured 20+ kinds of products over the past few years. The top products that facilities have produced are Enzymes (67), Proteins (54), Biomass (48), Recombinant proteins (46), Probiotics (35) and Nutraceuticals (34) (Fig. 7). Given the sizable investment into alternative protein companies over the past few years, it's not surprising that many facilities, although mostly bench and pilot-scale, can support production of these molecules.

Number of facilities with product expertise.
WHAT USERS ARE SEEKING
The data for ‘Product Expertise’ shows that the facility capabilities align with user demand. The top three products users are filtering for are Proteins, Enzymes and Recombinant proteins and these are the most commonly supported products that the facilities uploaded have recently manufactured.
When layering on total capacity by product expertise, the results vary depending on the product. There are 42 facilities on the platform that support the production of biomass and the capacity of these facilities is 3.7 million liters (Fig. 8). There are fewer facilities (31) on the platform that support the production of probiotics, yet there is more capacity at these facilities (10.2 million liters). Beyond the total capacity for probiotics outlier, the total capacity at facilities that specialize in manufacturing certain products also aligns with the products that users are most frequently looking for (Proteins, Enzymes and Recombinant proteins).
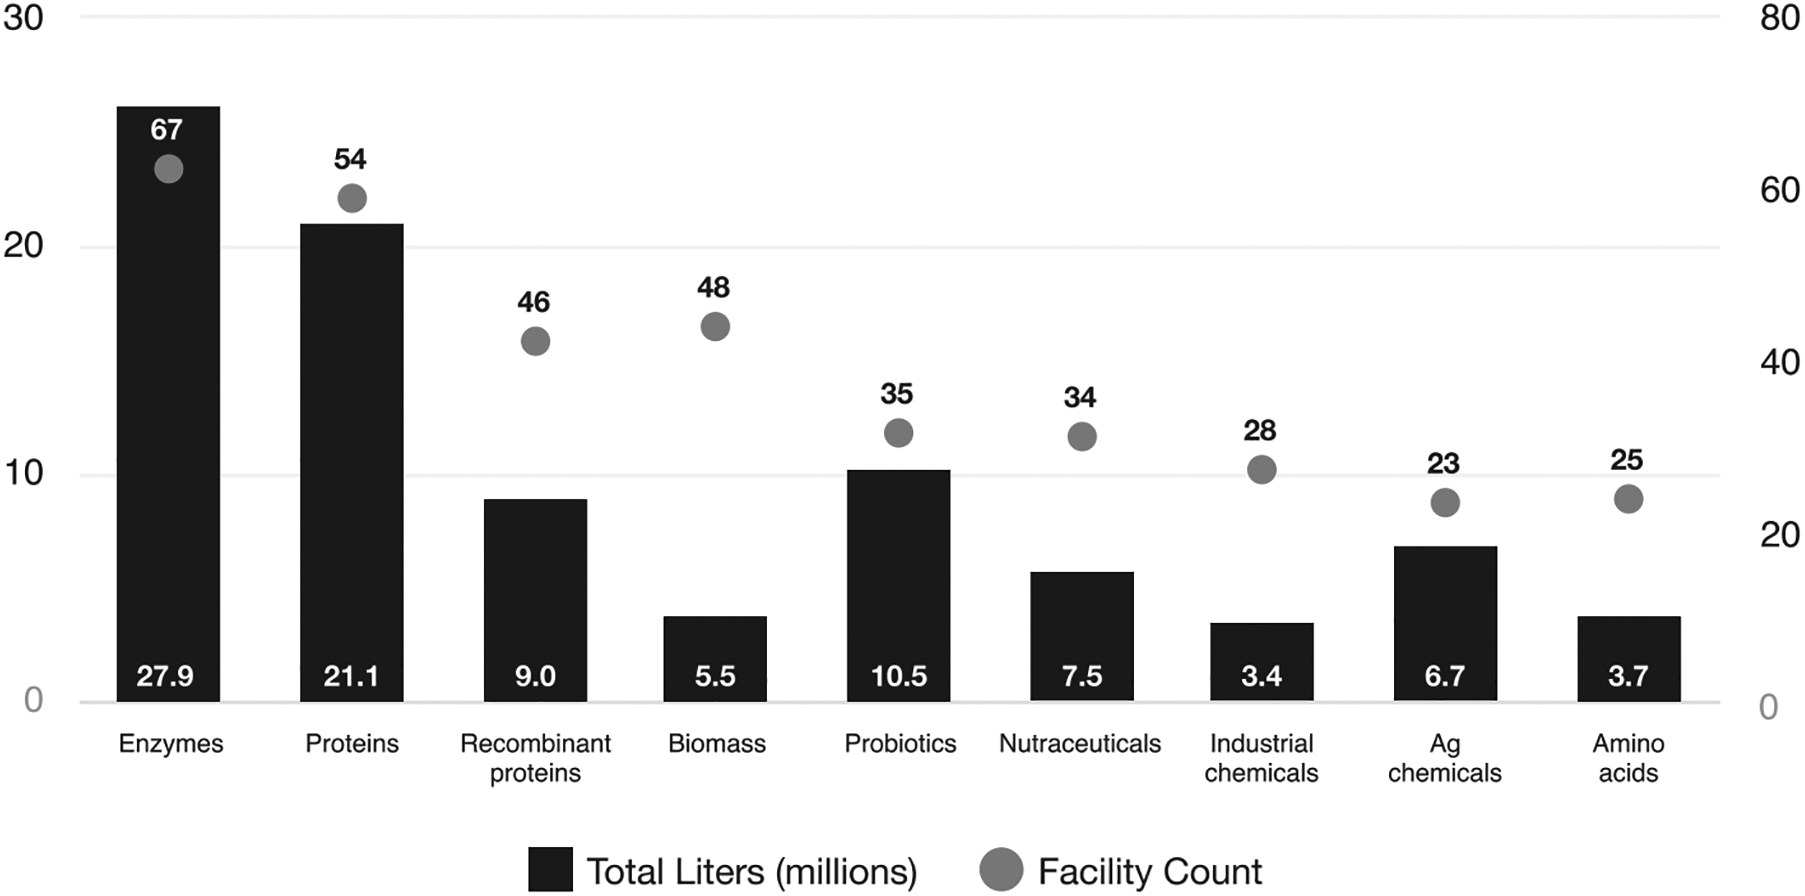
Total capacity (in millions of liters) and number of facilities with product expertise.
Facility Rank by Page Views
At the global level, the facilities with the most views in total tend to be ones with the larger-scale capacity (100,000+ L). Users in each region are generally looking at the facilities that exist within their region. In regions where there are not as many facilities uploaded, such as APAC and Africa, users are predominantly looking at facilities in Europe. We expect this data to change as more facilities are built in these regions and added to Capacitor.
User Geography
Capacitor has registered users in 90+ countries. Scaling and increasing capacity is not something unique to a single country or continent—it's a necessary component of the global shift towards building a stronger bioeconomy and this breadth of coverage is reflected in the data. The majority of users are from the Americas (43%) and Europe (38%) (Fig. 9). Though not the majority, there are some users in APAC (17%) and Africa (1%) and we expect these numbers to grow as biomanufacturing becomes more mainstream in these regions. On a country-specific level, most users are from the US (38%) and countries in Europe. Nearly 5% of users are coming from India, highlighting the growing interest and investment of biomanufacturing in APAC.

User geographic coverage.
User Segments
Beyond coming from all over the world, our users also come from many different professional backgrounds (Fig. 10). We are happy to see that the bioeconomy's diverse set of stakeholders are leveraging the tool for their own particular use case. The majority of registered users come from synbio companies (38%), facilities (17%) and large corporations (9%). We also have a sizable user base from finance, consulting, academia and non-profits.

Percentage of registered users in industry segments.
Conclusion
Many users are filtering for demo and commercial facilities and bioreactors larger than 20,000 L. The existing infrastructure network severely lacks these pieces and we need future development to fill these gaps.
There are many facilities that make up the existing network, predominantly in Europe and the Americas and at the bench and pilot scales. But as the user behavior data suggests, we need more capacity, especially at the larger scales and with larger bioreactors, to help companies produce in quantities big enough to achieve cost parity with legacy products.
The good news is that there are lots of people working to solve this problem. Many synbio, contract manufacturing organizations, governments and other stakeholders are focused on bringing more capacity online in the coming quarters. As this capacity gets built, Capacitor will continue to be the central repository for this capacity that will power the future global bioeconomy.
Over the coming months, we hope to grow an even more comprehensive directory of global fermentation capacity and invite you actively participate by completing the actions below.