




Abstract
Abstract
Background:
Exposure to second-hand smoke (SHS) is increasingly recognized as an occupational hazard to workers in the service industry. In areas of the world with moderate climates, open windows and doors are assumed to provide a work environment with only marginally increased exposures to SHS.
Methods:
We measured indoor fine particulate matter (PM2.5) in 50 semiopen air venues in Greece during the summer. Cotinine levels from a nonsmoking employee of each of these venues were measured from a postshift urine sample.
Results:
In these semiopen-air venues, the mean level of indoor PM 2.5 levels were 113.5 ± 72.3 μg/m3. The mean postshift urinary cotinine levels of nonworking workers in these venues was 15 ng/mL. PM2.5 levels were strongly correlated with urinary cotinine concentrations (spearman's r = 0.914). Linear regression analyses indicated that when taking into account the time of the measurement, the day of the week, for each 1 cigarette/100 m3 the indoor PM2.5 concentrations increased by 26.6 μg/m3 [95% confidence interval (CI): 7.6–45.7 μg/m3, p = 0.007) and urinary cotinine levels of nonsmoking workers increased by 5.0 ng/mL (95% CI: 0.4 to 9.6, p = 0.034).
Conclusions:
In a sample of bars and restaurants with windows and doors open, indoor PM2.5 concentrations were elevated and increased proportionately to the density of smoking. Cotinine levels of nonsmoking employees increased with indoor PM2.5 concentrations, and also with the density of smoking. Open windows and doors do not protect workers from exposure to second-hand smoke.
Introduction
Exposure to SHS is associated with numerous adverse health effects. It increases the risk of coronary heart disease and similarly to other particle exposures, has significant effects on the respiratory health of nonsmoking humans inducing coughing, phlegm production, and reduced lung function, including higher residual volume and lower maximal expiratory flow.(4–6) Moreover, occupational exposure to SHS is associated with an increased risk of lung cancer, whereas nonsmoking employees exposed to SHS have been found to have elevated tobacco specific carcinogens in their body, an indicator of the possible negative ramifications of this exposure on their health.(7,8) Taking these above facts into account a number of countries and regions have moved to ban smoking in public places, including within the hospitality industry. Within such venues, pre- and post-measurements documenting the reduction in the population's exposure to SHS is usually assessed through the measurement of airborne particulate matter smaller then 2.5 μm (PM 2.5).(9–11) Indeed, after the implementation of the ban in Norway, total PM 2.5 level in bars and restaurants fell from 262 to 77 μg/m3, a 70% reduction, whereas a similar reduction was also noted in Scotland after the implementation of the smoke-free legislation (an 86% reduction, from 246 μg/m3 to 20 μg/m3).(9,12) Although indoor air monitoring is easy to perform and can provide real-time measurements, PM 2.5 measurements, although relatively accurate, are not tobacco specific.(13) On the other hand, the optimal assessment of exposure to SHS can be performed by analyzing physiological fluids (i.e., serum, saliva, urine) of exposed persons for tobacco specific biomarkers, such as cotinine.(14)
As most studies use either air quality measurements or biomarker assessment, we aimed at investigating the correlation between urinary cotinine levels of nonsmoking café workers and the level of indoor particulate pollution (PM 2.5) attributable to SHS within each venue, whereas secondly to identify the factors that influence the level of exposure in semiopen cafés with a specific focus on the role of having open doors and windows so as to reduce exposure to SHS.
Materials and Methods
Air monitoring protocol
A TSI SidePak AM510 Personal Aerosol Monitor (TSI, Inc., St. Paul, MN, USA) was used to sample and record the levels of fine particles in the air. The SidePak uses a built-in sampling pump to draw air through the device and the particulate matter in the air scatters the light from a laser to assess the real-time concentration of particles less than 2.5 μm in micrograms per cubic meter, or PM2.5. Particles of this size are released in significant amounts from burning cigarettes, are easily inhaled deep into the lungs, and are associated with pulmonary and cardiovascular disease and mortality.(15) Cigarette smoke is not the only source of indoor pollution that can produce PM2.5, since particles of this size are not specific to tobacco smoke, but PM2.5 monitoring is regarded as highly sensitive to SHS.(13,16,17) The flow rate of the TSI Sidepack was set at 1.7 lt/min and the calibration factor applied was 0.32, in accordance to the calibration factors used when measuring SHS exposure with this specific instrument, as defined by other researchers.(16,17)
Sampling protocol
A total of 50 venues were sampled in Greece, during the warm months of May and June 2008. A convenience sample of venues was used (due to the lack of a comprehensive list of venues), whereas all had doors and windows open due to the warm temperature at the time of sampling. The equipment was set to a 1-sec log interval, which data-logged the real-time PM2.5 measurement. Sampling took place somewhere between 10 am in the morning until late in the night (12 am–12 pm). Sampling was discreet in order not to disturb the occupants' normal behavior, during which observational information was noted, regarding the number of cigarettes, people, air volume, windows and doors that are open, and other factors that, according to the literature, might affect the PM2.5 levels (i.e., cooking in area, candles).(16) Air monitoring was performed for at least 30 min in all venues, whereas the first and last minute of logged data were removed because the results may be contaminated with outdoor air measurements. The remaining data points were averaged to provide an average PM2.5 concentration within the venue. In addition to indoor PM2.5 measurements, outdoor levels of PM2.5 were also measured (at an average of 12 μg/m3) so as to subtract the level of outdoor particulate matter from the measured indoor PM2.5 levels, thus taking into account PM2.5 due mainly to SHS (no venues had other obvious sources of indoor PM 2.5 exposure). As the measurements were performed during the summer, all of the visited venues had opened windows and doors, allowing for air exchange between the venue and the environment.
This aforementioned methodological approach has been applied successfully in studies monitoring indoor SHS exposure by a number of researchers.(10–12,17)
Cotinine—Nicotine analytical procedures
Following written consent, one nonsmoking employee from each café or bar was requested to provide a urine sample at the end of their shift, on the same day in which the aerosol levels were measured. For this purpose they were provided with sterile urine collection cups, which were subsequently separated into vials and stored at −40°C within 1 h of sampling. All participants were informed about the study, and written consent was obtained. Approval to conduct the survey was granted by the Ethics Committee of the University of Athens.
Exposure to SHS was measured using urinary cotinine levels. Cotinine, the main metabolite of nicotine in the human body, has an ideal half-life of approximately 16–20 h, depending on age and smoking status, and therefore represents recent exposure to SHS.(18,19) Nonsmoker status was crossevaluated by both self-report (employees who have reported that they were not current smokers) and biomarker status, with the cutoff cotinine level of smokers and nonsmokers designated at 100 ng/mL.
The sample preparation for the cotinine analysis included mixing an aliquot (2 mL) of each urine sample with 2 mL of phosphate buffer solution at a pH of 7. The biological samples were processed by solid phase extraction. The SPE columns (Discovery C18, 100 mg, 1 mL) were preconditioned with 1 mL of methanol and 1 mL of phosphate buffer pH 7.00. The mixture of biological sample and buffer spiked with procaine (IS) (5 μL of 100 ppm solution) was passed through the conditioned SPE columns at a flow rate of 1 mL/min by applying vacuum. The columns were rinsed with 2 mL high-performance liquid chromatography (HPLC) grade water and dried under full vacuum for 5 min. The analytes were eluted with 1 mL dichloromethane–isopropanol–isoamyalcohol–ammonia (96/2/2/0.4 v/v). The organic phase was dried under stream of N2 and reconstituted in 50 μL of methanol.
Two microliters of the above solution were injected for analysis on a Shimadzu QP2010 (EI, GCMS) system equipped with an EquityTM-5 (30 m × 0.20 mm i.d. × 0.20 μm) capillary column and with an autosampler (AOC-5000, Shimadzu, Kyoto, Japan) in splitless mode. The column temperature was initially held to 70°C for 2 min and then was raised to 300°C at the rate of 20°C/min. The injector temperature was 280°C. The interface and ion source temperature was set at 310°C and 200°C, respectively. Quantitative analysis was accomplished in selected ion monitoring (SIM) mode with a scan time of 0.2 sec, using the following fragment ions m/z = 84, 162 for nicotine, m/z = 98, 176 for cotinine and m/z = 86 for procaine. The spiked curves were linear between the concentrations 0.5–640 ng/mL with coefficients of linearity greater than 0.99. The LOQ was determined at 0.5 ng/mL for both nicotine and cotinine. The mean recovery was estimated at 105.5% for cotinine. A detailed elaboration of the analytical approach that was used to assess the cotinine concentrations can be found elsewhere.(20)
Statistical analysis
The descriptive data is presented as mean ± standard deviation for continuous variables and in percentages (n) for categorical. Student t-tests, ANOVA, and chi-squared tests (χ2) were used during the comparisons while all reported analyses are based on two-sided tests, whereas statistical significance was noted as p < 0.05. Due to the skewedness noted in urinary cotinine and nicotine levels, their levels were log transformed during the statistical analysis, and their means (M) and 95% confidence intervals (95% CI) were presented in the results. So as to facilitate the statistical analysis, the time of day in which the air monitoring took place was converted from a continous into a dichotomical variable (day shifts <8 pm vs. night shifts >8 pm) and so were the PM 2.5 levels (dichotomously divided by the mean of 120 μg/m3 into lower and higher exposure categories). Those venues in which the monitoring was performed at around 8 pm were allocated to one group or the other depending on whether the majority of the time was spent before 8 pm or after 8 pm, respectively. Moreover, smoker density was calculated as the number of cigarettes per 100 m3. Correlations between aerosol measurements and urinary cotinine levels were performed and the Spearman's r values were noted. During the investigation into the factors that mediate air quality (air particles <2.5 μm) and urinary cotinine levels two separate linear regression models were applied, taking into account possible influential factors. The statistical package SPSS 16.0 was used to perform the analysis.
Results
Indoor air quality
The mean level of indoor PM 2.5 exposure was calculated at 113.5 ± 72.3 mg/m3, indicating a range of exposure between 20 μg/m3 and 293 μg/m3 (Table 1). A difference in PM 2.5 levels by day of week was noted, and measurements that were performed on either a Friday or Saturday revealed higher levels than those performed during other days of the week (98.5 μg/m3 vs. 137.2 μg/m3, p = 0.067). The time of measurement was not found to significantly influence PM 2.5 levels when divided into a dichotomous variable (before 8 pm and after 8 pm), with mean levels of 109.4 μg/m3 vs. 117.8 μg/m3, respectively (p = 0.686).
Average number of cigarettes per 100 m3 of venue air volume.
Factors that influence cotinine and PM2.5 measurements
An initial exploratory analysis on the nicotine and cotinine levels was performed on the 50 nonsmokers, employees of the cafés and bars that were monitored. Almost all participants had urinary cotinine levels below 100 ng/mL except for one participant who was found to have a concentration of 729.7 ng/mL, which was subsequently excluded from the analysis due to his biomarker verified smoking status (final sample = 49 venues and employees). Fifty-one percent (n = 25) of these participants were male, and 49% (n = 24) female, with a mean age of 35.8 and 34.3 years, respectively. The different factors (such as sampling time, day, and employee characteristics) that influenced cotinine and nicotine levels are depicted in Table 2. Among employees in semiopen cafés, gender was not a mediator of mean cotinine levels (male: 16.7 95% CI: 11.6–24.0 ng/mL vs. female 15.1 95% CI: 10.9–21.0 ng/mL, p = 0.667) nor mean nicotine levels (male 21.1 95% CI: 12.2–36.4 ng/mL vs. 12.7 95% CI: 8.6–18.8 ng/mL among female, employees, p = 0.131).The day of the week and the time of the day in which the sampling/air monitoring was performed were also not found in the univariate analysis to effect the cotinine levels of the participants. Indeed, the only factor that was significantly associated in the univariate analysis to urinary cotinine levels was the level of air quality in the venue, an indicator of SHS exposure with those employees that were employed in venues in which higher levels of indoor particulate matter were noted, (below 120 μg/m3 vs. above 120 μg/m3) were found to have higher cotinine and nicotine urine concentrations (37.7 vs. 9.2; p < 0.001 for cotinine and 28.2 vs. 12.1; p = 0.016 for nicotine). In addition to the above, a linear regression analysis was performed, so as to identify the factors that influence the level of exposure to PM 2.5 and urinary cotinine levels. Specifically, the sampling day, sampling time, the volume, and the average number of patrons were taken into account as seen in Table 3, with the smoker density (cigarettes per 100 m3 of venue volume) found to be the only factor that significantly affected indoor PM 2.5 levels (Beta = 26.6, 95% CI; 7.6 to 45.7; p = 0.007). The day of the week (Beta = 20.9, 95% CI; −21.1–63.0; p = 0.321) and the time of the measurement (night vs. day) were not found to drastically effect the level of exposure (Beta = 1.0, 95% CI; −44.6–46.6; p = 0.965). When investigating into the factors that mediated the employees' urinary cotinine levels, they were found to be significantly dependant on smoker density only (Beta = 5.0; 95% CI: 0.4–9.6, p = 0.034).
Student's t-test.
ANOVA.
CI, confidence interval.
Regression analysis with the smoker density (cigs per 100 m3), time (after 8 pm vs. before 8 pm) and day of measurement (weekend vs. weekday) taken into account.
CI, confidence interval.
Correlations between biomarkers, air quality measures, and factors
Subsequently we investigated into the correlation between indoor levels of PM 2.5, (the environmental marker of SHS), with urinary cotinine levels (the biological marker of SHS exposure). As seen in Figure 1, indoor PM 2.5 levels were strongly correlated with urinary cotinine levels (Spearman's r = 0.914; p < 0.001) and to a lesser extent to urinary nicotine levels (Spearman's r = 0.428; p = 0.02). Furthermore, a correlation between the average number of people and the smoker density (Spearman's r = 0.382; p = 0.007) and the average number of burning cigarettes (Spearman's r = 0.678; p < 0.001) was also noted.
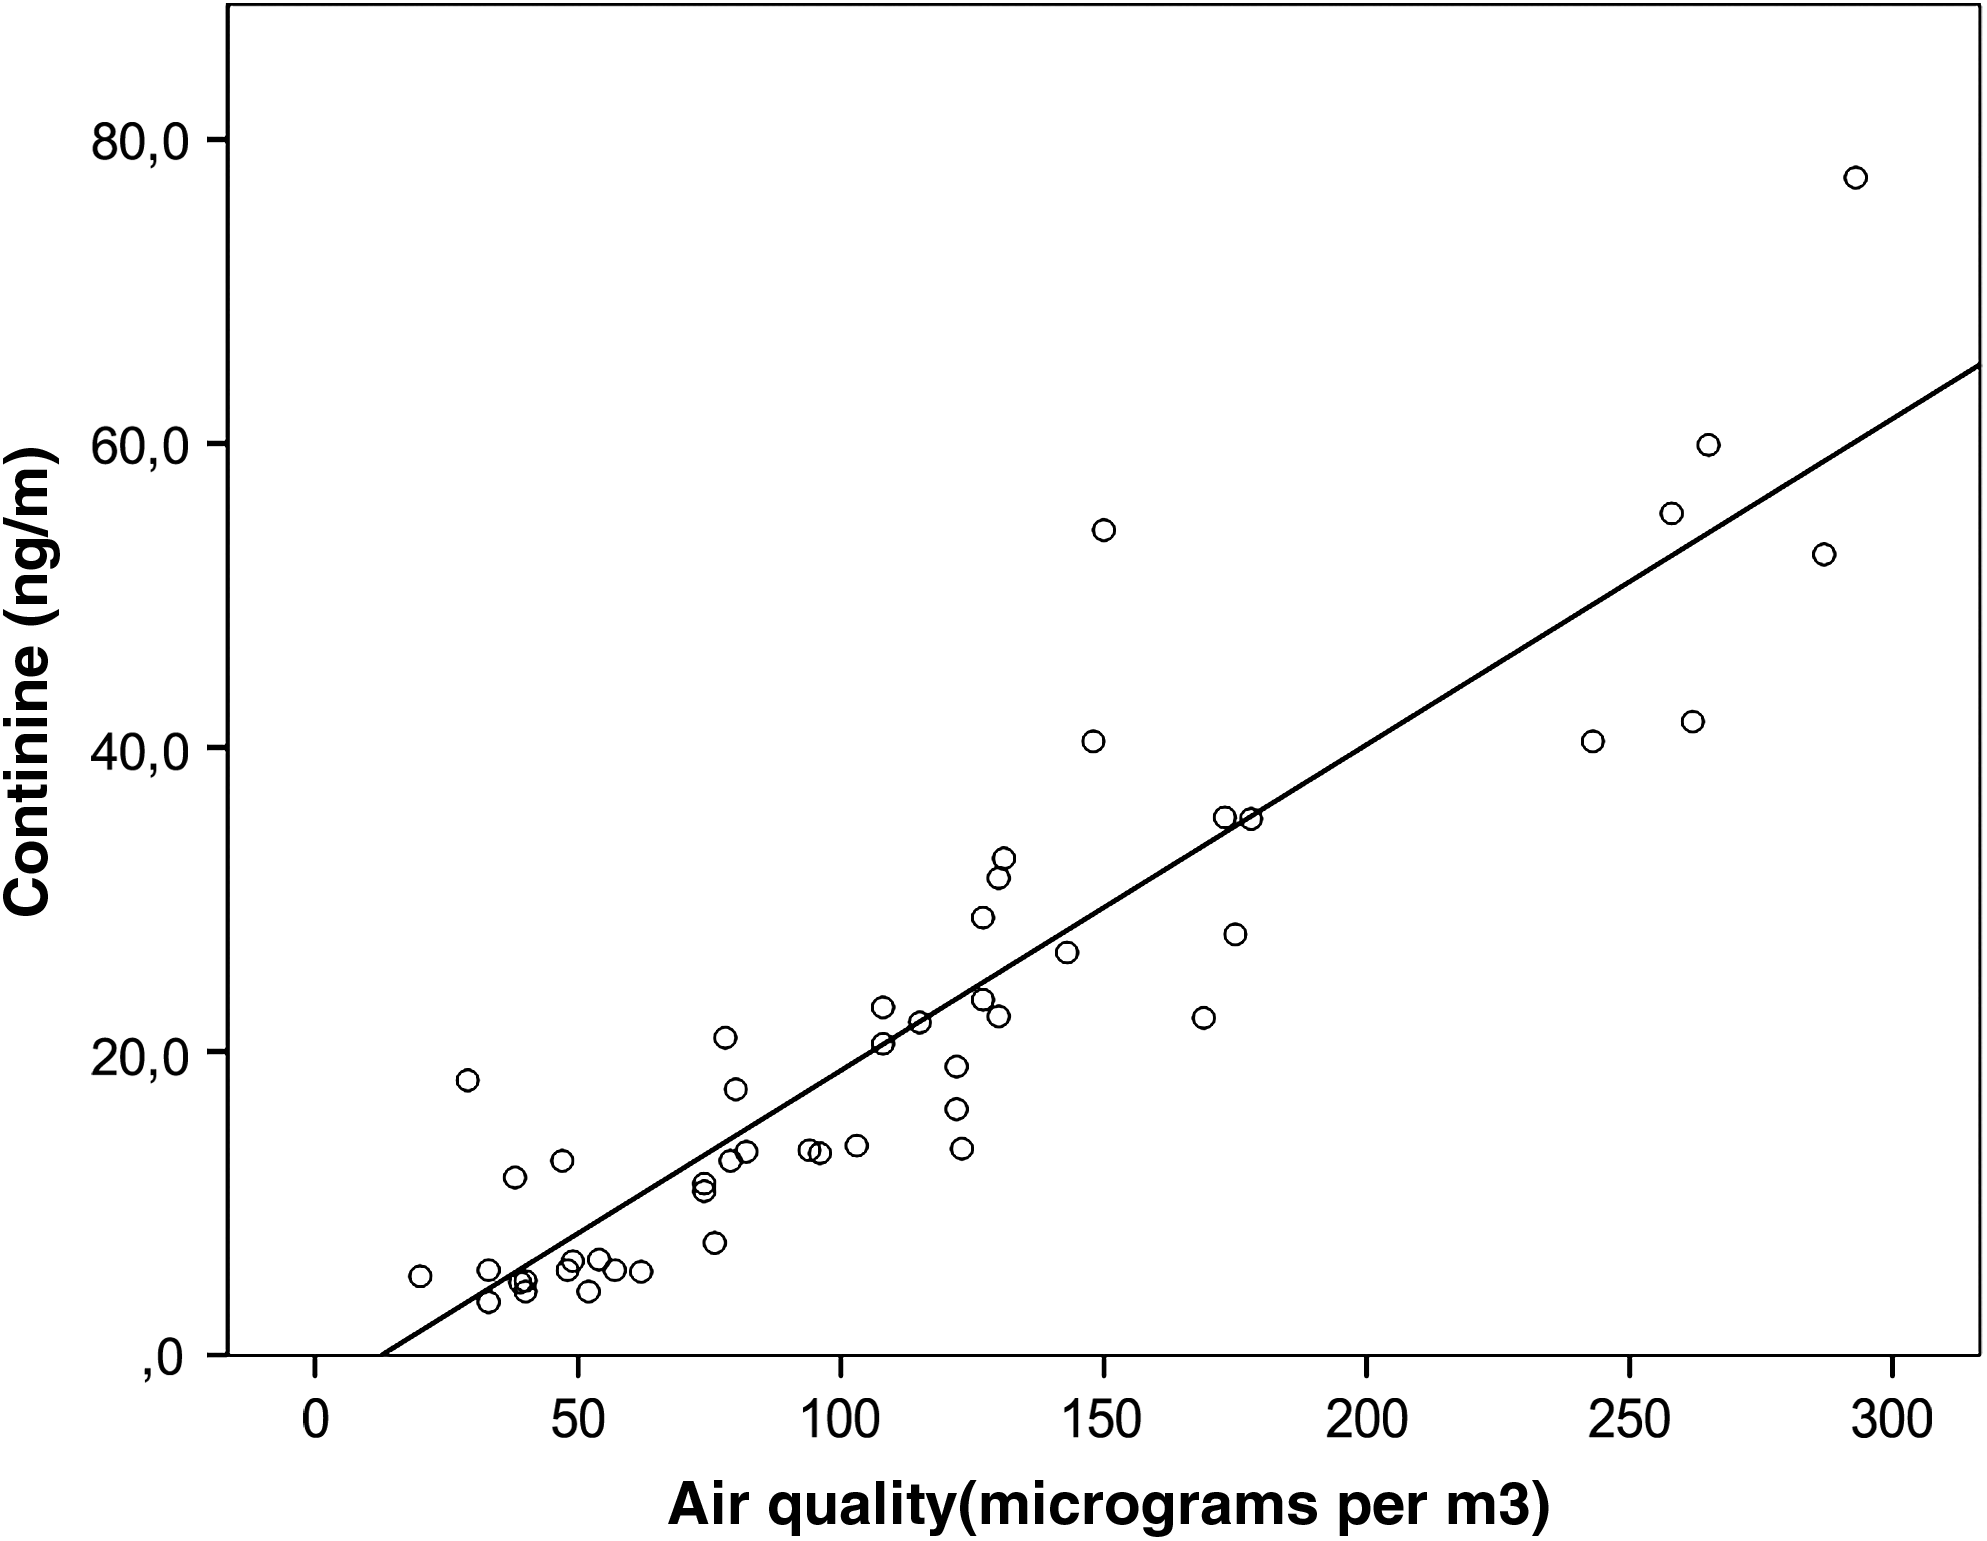
Correlations between indoor air quality levels (PM 2.5) and urinary cotinine levels among semiopen-air café workers in Greece, 2008.
Discussion
Main findings
Our results demonstrate that urinary cotinine/nicotine and environmentally monitored PM 2.5 levels are highly correlated and both can be used as an indicator of occupational exposure to SHS in the workplace. Furthermore, indoor air quality, as also urinary cotinine levels are dependent on a number of other observational and practical measures such as smoker density in the venue. An additional point noticed through these results is that allowing smoking in cafés with all the doors and windows open still leads to elevated biological and environmental indicators of occupational exposure to SHS.
It is of significant interest to note that during the period in which the measurements took place the weather conditions were good, taking advantage of the mild Mediterranean climate, which allowed having all doors and windows open in the venues examined, a fact that notably is responsible for the reduction in the level of PM 2.5 exposure.(21) Comparing our results to those previously found by Vardavas et al.,(11) in a previous air monitoring study in Greece PM 2.5 levels were found to be lower than those measured in 2007, a fact that we attribute to the different season of the year (late spring vs. late winter) as also the different venue type and sampling time of the day. Furthermore, our research indicated that employee urinary cotinine levels and indoor air quality is strongly dependent on the number of cigarettes per 100 m3 of venue volume. Moreover, community-oriented factors have also been indicated to influence levels of SHS exposure with UK venues in socially deprived areas found by Edwards et al.,(22) to have higher measurable levels of SHS exposure.
Taking into consideration the negative ramifications of SHS exposure and the multiple gains out of banning smoking, public health advocates in a number of countries and individual communities has moved to control exposure to SHS by passing smoke-free legislations. Indeed, such legislations not only lead to a reduction in measurable particles but also in biomarker evaluated levels of exposure. According to Valente et al. (2007),(23) the application of a smoking ban in the Italian hospitality industry led to a considerable reduction in the exposure to SHS within hospitality venues (PM 2.5 values from a pre-law level of 119.3 μg/m3 fell to 38.2 μg/m3 after the ban took effect), a fact that was confirmed by a contemporaneous reduction of urinary cotinine of its employees (from 17.8 ng/mL to 5.5 ng/mL). Similarly, in a study of 13 bars and restaurants in Oslo, Ellingsen et al. (2006)(9) observed a substantial reduction of urinary cotinine levels (from 9.5 μg/L to 1.4 μ/g) and levels of airborne contaminants after the ban smoking was applied. Furthermore, the implementation of Scotland's smoke-free legislation has been accompanied with a reduction (39%) of the mean salivary cotinine concentrations in adult nonsmokers exposed to SHS in public and private places (from 0.43 ng/mL at baseline to 0.26 ng/mL after legislation, p < 0.001).(24) Even stronger results have been observed among nonsmoker bar workers after smoking was banned in which the salivary cotinine levels recorded a dramatic 89% reduction, falling from a geometric mean of 2.94 ng/mL prior to introduction of the law to 0.41 ng/mL at 1 year of follow-up into the law, a reduction of 89%.(25) As the ratification of the Framework Convention on Tobacco Control moves into place, a significant number of investigations, similar to the ones noted above will need to be performed so as to monitor FCTC implementation. As research capacity and funding mechanisms may be limited in certain areas, with this work we aimed into investigating the comparability of biomarker versus environmental measurements and provide insight into the factors that should be taken into account during such an analysis.
Strengths and limitations
The first part of this study, which was cross-sectional in design and based on a nonrandom selection of cafés within the Athens area, may not be generalizable to the rest of Greece. Despite this fact, they do provide an insight into the PM 2.5 levels one can expect from cafés in which smoking is permitted during the spring and summer months when windows and doors are open and provide evidence of the factors that can influence the level of exposure. Although the air monitoring protocol has been applied to a number of other countries, the second, more experimental part of our study, specifically the correlation between urinary cotinine levels, PM 2.5 levels, and their influencing factors among nonsmoking employees, indicate the usefulness of both as methods of evaluating occupational SHS exposure. Due to practical and logistic reasons, only one urine sample from each of the 50 venues was obtained, but we do not envisage that this would have been the cause of any bias as all café workers within each venue would be exposed to similar levels of SHS. Although we had not taken other sources of SHS exposure into account, the urinary samples were taken toward the end of the shift of the 50 employees, and therefore their cotinine levels are likely to be attributable to SHS exposure during the current working shift. Moreover, the function of air ventilation systems were not taken into account in data collection and analysis as all venues had open doors or windows. This fact should be taken into account in future research so as to investigate into the role of air exchange on indoor SHS exposure.
The volume of the venue and the number of smoking patrons are significant determinants of nonsmoking employees' exposure to SHS, and should be taken into account when determining exposure levels. Moreover, as more and more countries move toward a smoke-free society, it is of interest to researchers to know that both air monitoring and human biomarker analysis are very well correlated and can both be used to document exposure within the hospitality industry.
Footnotes
Acknowledgments
This project was partially supported by the HEART project (Hellenic Action for Research against Tobacco) by the Behrakis Foundation through the “Behrakis Project for making smoking history in Greece.” C.I.V. is also currently supported by a Flight Attendant Medical Research Institute (FAMRI) grant for research into second-hand smoke.
Author Disclosure Statement
No conflicts of interest exist.