




Abstract
Abstract
Background:
Two-dimensional gamma scintigraphy is an important technique used to evaluate the lung deposition from inhaled therapeutic aerosols. Images are divided into regions of interest and deposition indices are derived to quantify aerosol distribution within the intrapulmonary airways. In this article, we compared the different approaches that have been historically used between different laboratories for geometrically defining lung regions of interest. We evaluated the effect of these different approaches on the derived indices classically used to assess inhaled aerosol deposition in the lungs. Our primary intention was to assess the ability of different regional lung templates to discriminate between central and peripheral airway deposition patterns generated by inhaling aerosols of different particle sizes.
Methods:
We investigated six methods most commonly reported in the scientific literature to define lung regions of interest and assessed how different each of the derived regional lung indices were between the methods to quantify regional lung deposition. We used monodisperse albuterol aerosols of differing particle size (1.5, 3, and 6 μm) in five mild asthmatic subjects [forced expiratory volume in 1 sec (FEV1) 90% predicted] to test the different approaches of each laboratory.
Results:
We observed the areas of geometry used to delineate central (C) and peripheral (P) lung regions of interest varied markedly between different laboratories. There was greater similarity between methods in values of penetration index (PI), defined as P/C aerosol counts normalized by P/C krypton ventilation counts, compared to nonnormalized C/P or P/C aerosol count-ratios. Normalizing the aerosol deposition P/C count-ratios by the ventilation P/C count-ratios, reduced the variability of the data. There was dependence of the regional lung deposition indices on the size of the P region of interest in that, as P increased, C/P count-ratios decreased and P/C count-ratios increased, whereas PI was less affected by variations in the P area. We found particle size, itself, strongly influenced the indices of regional aerosol deposition such that C/P count-ratios increased with increasing particle size for each method and conversely, P/C count-ratios and PI decreased.
Conclusions:
Different approaches used to determine pulmonary regions of interest and quantify aerosol deposition produce different results. Our research highlights a genuine need for a consensus to standardize the methodology to facilitate data comparison between laboratories on aerosol deposition.
Introduction
Scintigraphic lung images are divided into regions of interest to quantify inhaled aerosol deposition within the intrapulmonary airways. Classically, the analysis of the regional deposition of aerosol refers to central versus peripheral lung deposition (sometimes referred to as serial, conducting vs. alveolar airways), although other analyses can be performed such as apical-upper versus basal-lower lung regions (parallel) and histogram methods.(5,6) One of the early methods to define regions of interest used a three-compartment lung division.(7) Since then, many methods of defining lung regions have been developed between different researchers, where each laboratory has used their own preferred historical templates.(3,5,8) Although all these methods may be valid approaches, their differences make it difficult to compare lung deposition data between centres. There are no standard methods for defining pulmonary regions of interest and quantifying aerosol deposition data. A recent industry, regulatory, and academic collaborative workshop has highlighted the need for an international consensus on standardizing radionuclide imaging techniques and analysis methods, including gamma scintigraphy, within the framework of demonstrating bioequivalence of locally acting orally inhaled drug products.(9)
In our article, we investigated how different methods of defining the geometry of lung regions of interest from different laboratories affected the subsequent calculation of the indices used to determine the regional lung deposition of inhaled aerosol within the intrapulmonary airways. We examined how different each of the derived regional lung indices were between the different approaches for assessing and quantifying central and peripheral areas of lung deposition in asthmatic subjects.
A comparative approach has previously been undertaken to define the most appropriate geometry of regions of interest on lung deposition scans from asthmatic subjects inhaling polydisperse aerosols and concurred a need for a consensus between investigators.(10) Our present study is unique in that we used monodisperse aerosols of differing particle size (which have been shown to have intrapulmonary anatomical deposition specificity),(11,12) to test the different methodologies between laboratories for determining, quantifying, and analyzing individual regions of interest. We studied patients with asthma as opposed to healthy volunteer subjects, as the inhaled drug deposition of commercial aerosols and inhaler devices is increasingly being studied in patients with airway disease, which reflects the “real-life” clinic scenario.
Materials and Methods
Five mild asthmatic patients [four males, mean age 41 years (±9.1), mean forced expiratory volume (FEV1) 3.3 L (±0.6), FEV1 90% of predicted (±10.9)] gave informed consent to participate in a new study approved by the Ethics Committee (Table 1). Patients inhaled 99mTc-labeled monodisperse [geometric standard deviation (GSD) <1.22] albuterol aerosols of size 1.5-, 3-, and 6-μm mass median aerodynamic diameter each on 3 separate days in a manner as previously described.(4) Aerosol lung deposition images were acquired using a GE Infinia™ gamma camera (GE Healthcare, Piscataway, NJ, USA) (Fig. 1). The start of image acquisition was less than a minute after aerosol delivery. With our double-headed camera, simultaneous anterior and posterior images of the lungs were obtained and for the purposes of analysis, the posterior scans were used particularly as they decrease the obscuration of the lung by the heart shadow, which tends to occur in anterior scans.
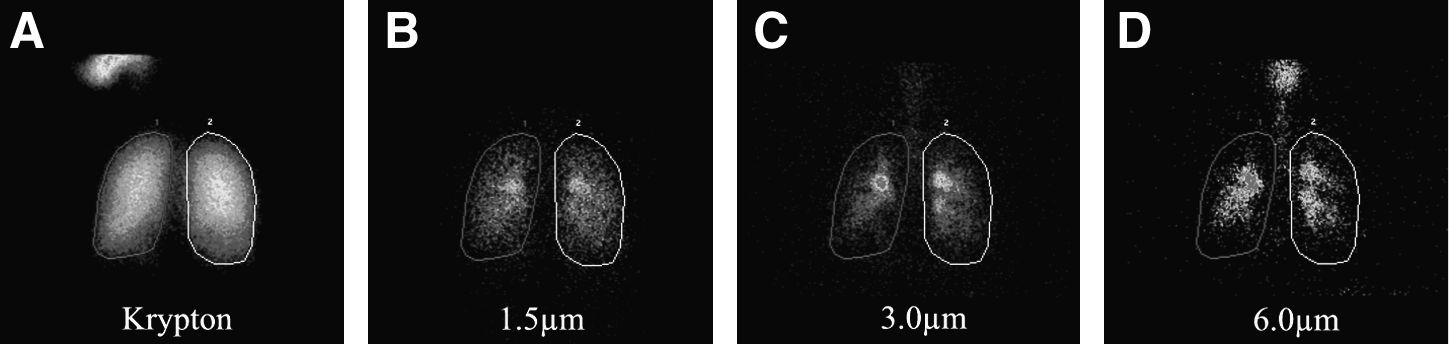
(
Total lung area was determined from the outer boundary of the patient's posterior krypton (81mKr) ventilation scan image, which was undertaken on a separate day to the albuterol aerosol scans. The outer boundary of the ventilation scan was determined where the radioactive counts decreased to background levels. Each aerosol image was aligned with the outline of the lungs generated by the 81mKr ventilation scan using the midline of the mediastinum for left–right alignment and the base of the two lung images for up–down alignment, with the aid of image processing software (Hermes Medical Solutions, Stockholm, Sweden).
We applied six methods for defining regions of interest to our patient aerosol deposition data of each albuterol particle size (Fig. 2).(5,13–17) The methods were defined from 1 to 6 corresponding to an increasing size of the P region area. Method 1,(13) divided the lung into three regions representing 20, 30, and 50% of the ventilation image. Method 2,(14) based a 5 × 8 rectangle matrix around the lung border with central (C), intermediate (I), and peripheral (P) regions. Method 3,(15) separated the lungs into an inner one-third C and outer two-thirds P region. Method 4,(16) generated the C region by reducing the height and width of the lung outline of the ventilation scan by factor of 1.8, where the C region area was 30.9% of the total lung area. Method 5,(5) determined the C region as 25% of the area of a whole-lung rectangle and the remaining area was the P region. Method 6,(17) configured six rectangles per lung with C and P regions, where the two lower left lung regions (regions D, Fig. 2) were discarded to eliminate overlapping stomach activity to derive the left lung counts, whereas the two lower right rectangles were included to derive the right lung counts. Most of the methods treated the left and the right lung the same when determining the size and shape of the P and C region of interest. To treat each method the same, we used data from both right and left lungs to derive total lung area and aerosol deposition counts.
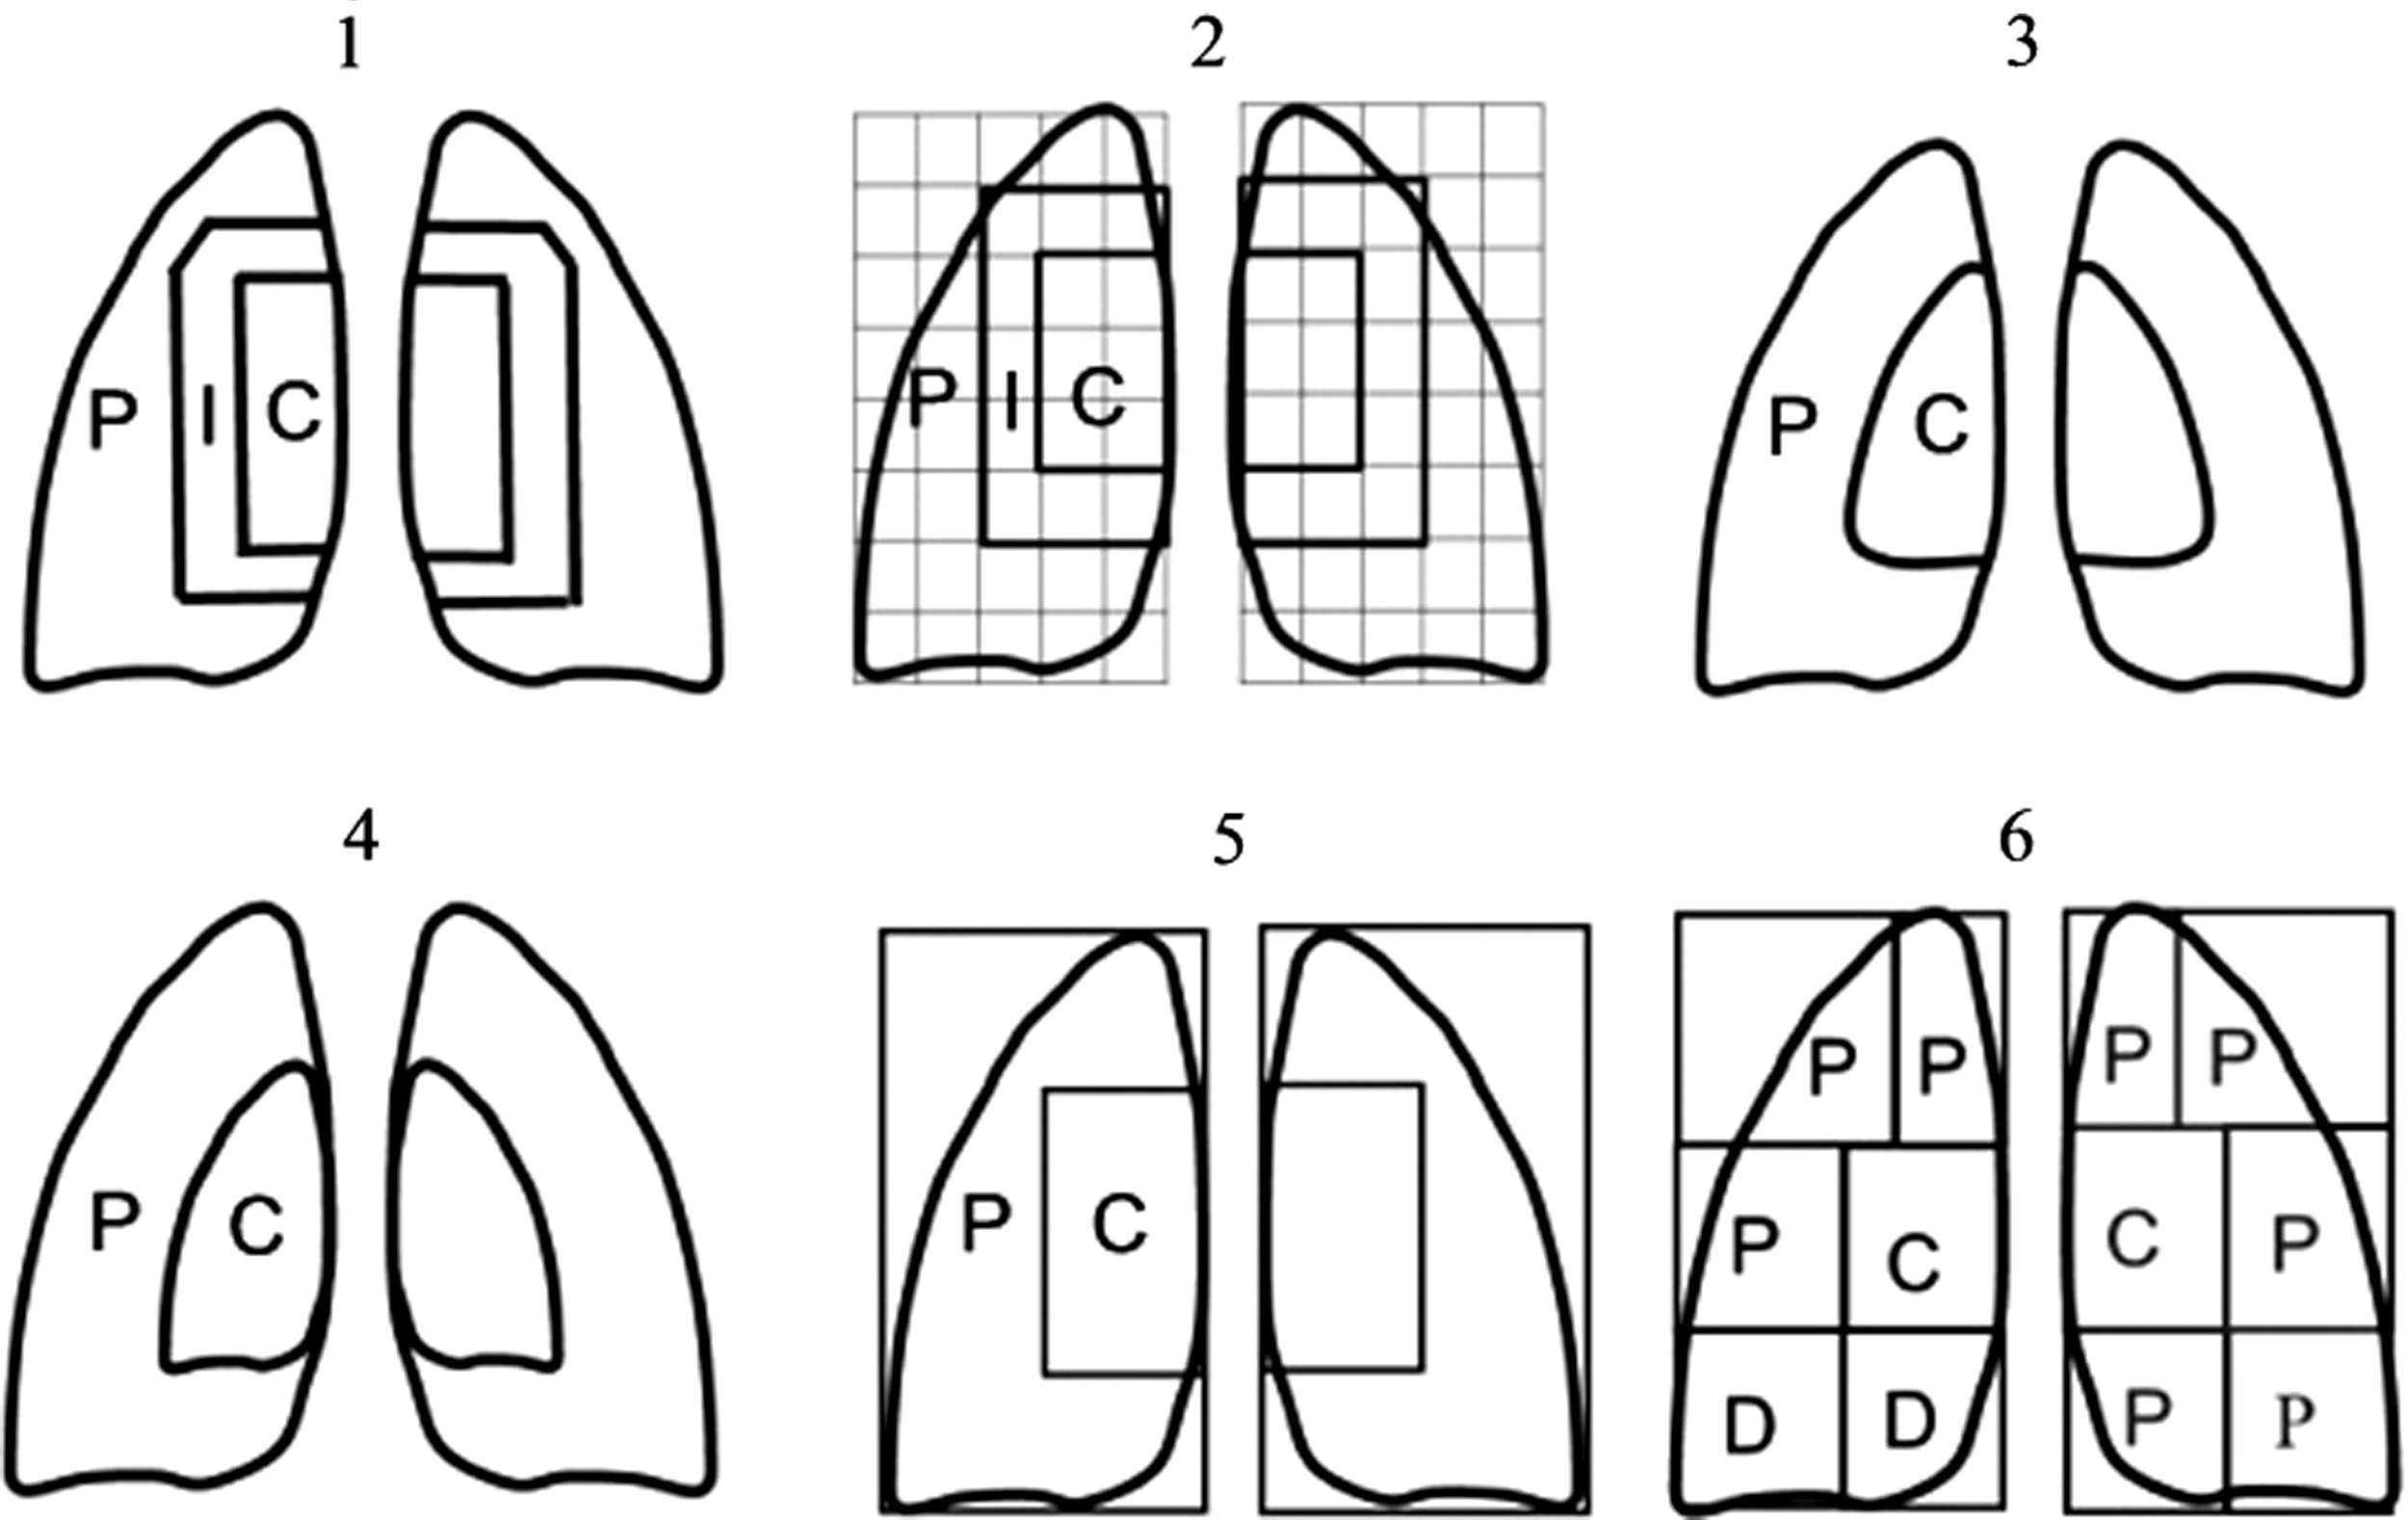
Image counts were determined for each lung region of interest [central (C), peripheral (P), and in some cases intermediate (I)] and, corrected for radioactive decay and background radioactivity. Overlapping activity in the stomach/oesophagus was corrected by drawing separate regions of interest around the areas overlapping the lungs and subtracting these counts from the lung region counts. We used this approach where it was clear that activity in the lung region was due to stomach overlap derived from the stomach counts. In most cases it is clear if the activity is located in the stomach due to its shape and position and the fact that the overlapping portion is a continuation of the nonoverlapping section of the stomach.
For the purposes of our study, the penetration of inhaled albuterol aerosol into the lungs, penetration index (PI), was defined as the ratio of P/C counts for aerosol deposition divided (“normalized”) by P/C counts for the 81mKr ventilation scan, as first described by Agnew and colleagues.(18) Other derivations of regional lung deposition have been reported, which include C/P count-ratio divided by C/P ventilation counts.(5,15,16) The literature also defines how deposition data can be corrected for lung volume (normalized) using 133Xe equilibrium scans and transmission scans.(19,20) Deposition data can also be presented as nonnormalized indices.(3) We used 81mKr as this was available to us rather than 133Xe. We derived the regional lung deposition indices of PI and nonnormalized parameters of central/peripheral (C/P) aerosol count-ratio and peripheral/central (P/C) aerosol count-ratio, which were compared (mean values) between laboratory methods using one-way analysis of variance and the Kruskal-Wallis test.
Results
The area of the central (C), intermediate (I), and peripheral (P) regions of interest are shown as a percentage of the total lung area (Table 2) and the percentage of total lung image counts in the three regions are shown (Table 3) for individual asthmatic subjects of each monodisperse aerosol particle size for each method, in ascending order of P area from method 1 to 6.(5,13–17) The area of both left (L) and right (R) lungs, based on the 81mKr outline, were similar (L 49.2%, R 50.8%). Similarly, there were slightly less aerosol deposition counts in the L lung compared to the R lung for each particle size (1.5 μm L 47.8%, R 52.2%); (3 μm L 47.7%, R 52.3%) (6 μm L 48.5%, R 51.5%).
The areas of the central (C) and peripheral (P) lung regions varied markedly between the different methods, ranging between (C) 19.7–32.5% and (P) 50.2–79.7% of the total lung area (Table 2). Consequently, image counts attributed to each (C) and (P) region of the deposition scans also differed (Table 3). Not all methods reported an intermediate (I) region and in those that did,(13,14) the I region counts were not included in the calculation of the regional deposition indices.
There was clear dependence of the regional lung deposition indices on the size of the P region of interest in that; as P increased, C/P count-ratios decreased and P/C count-ratios increased. However, PI showed much less dependence (Fig. 3). There was greater similarity between methods in values of penetration index (PI), defined as P/C aerosol counts normalized by P/C krypton ventilation counts, compared to nonnormalized C/P or P/C aerosol count-ratios (Fig. 4). Normalizing the aerosol deposition P/C count-ratios by the ventilation P/C count-ratios (that is, to give PI), reduced the variability (standard deviation) of the data (Table 4).
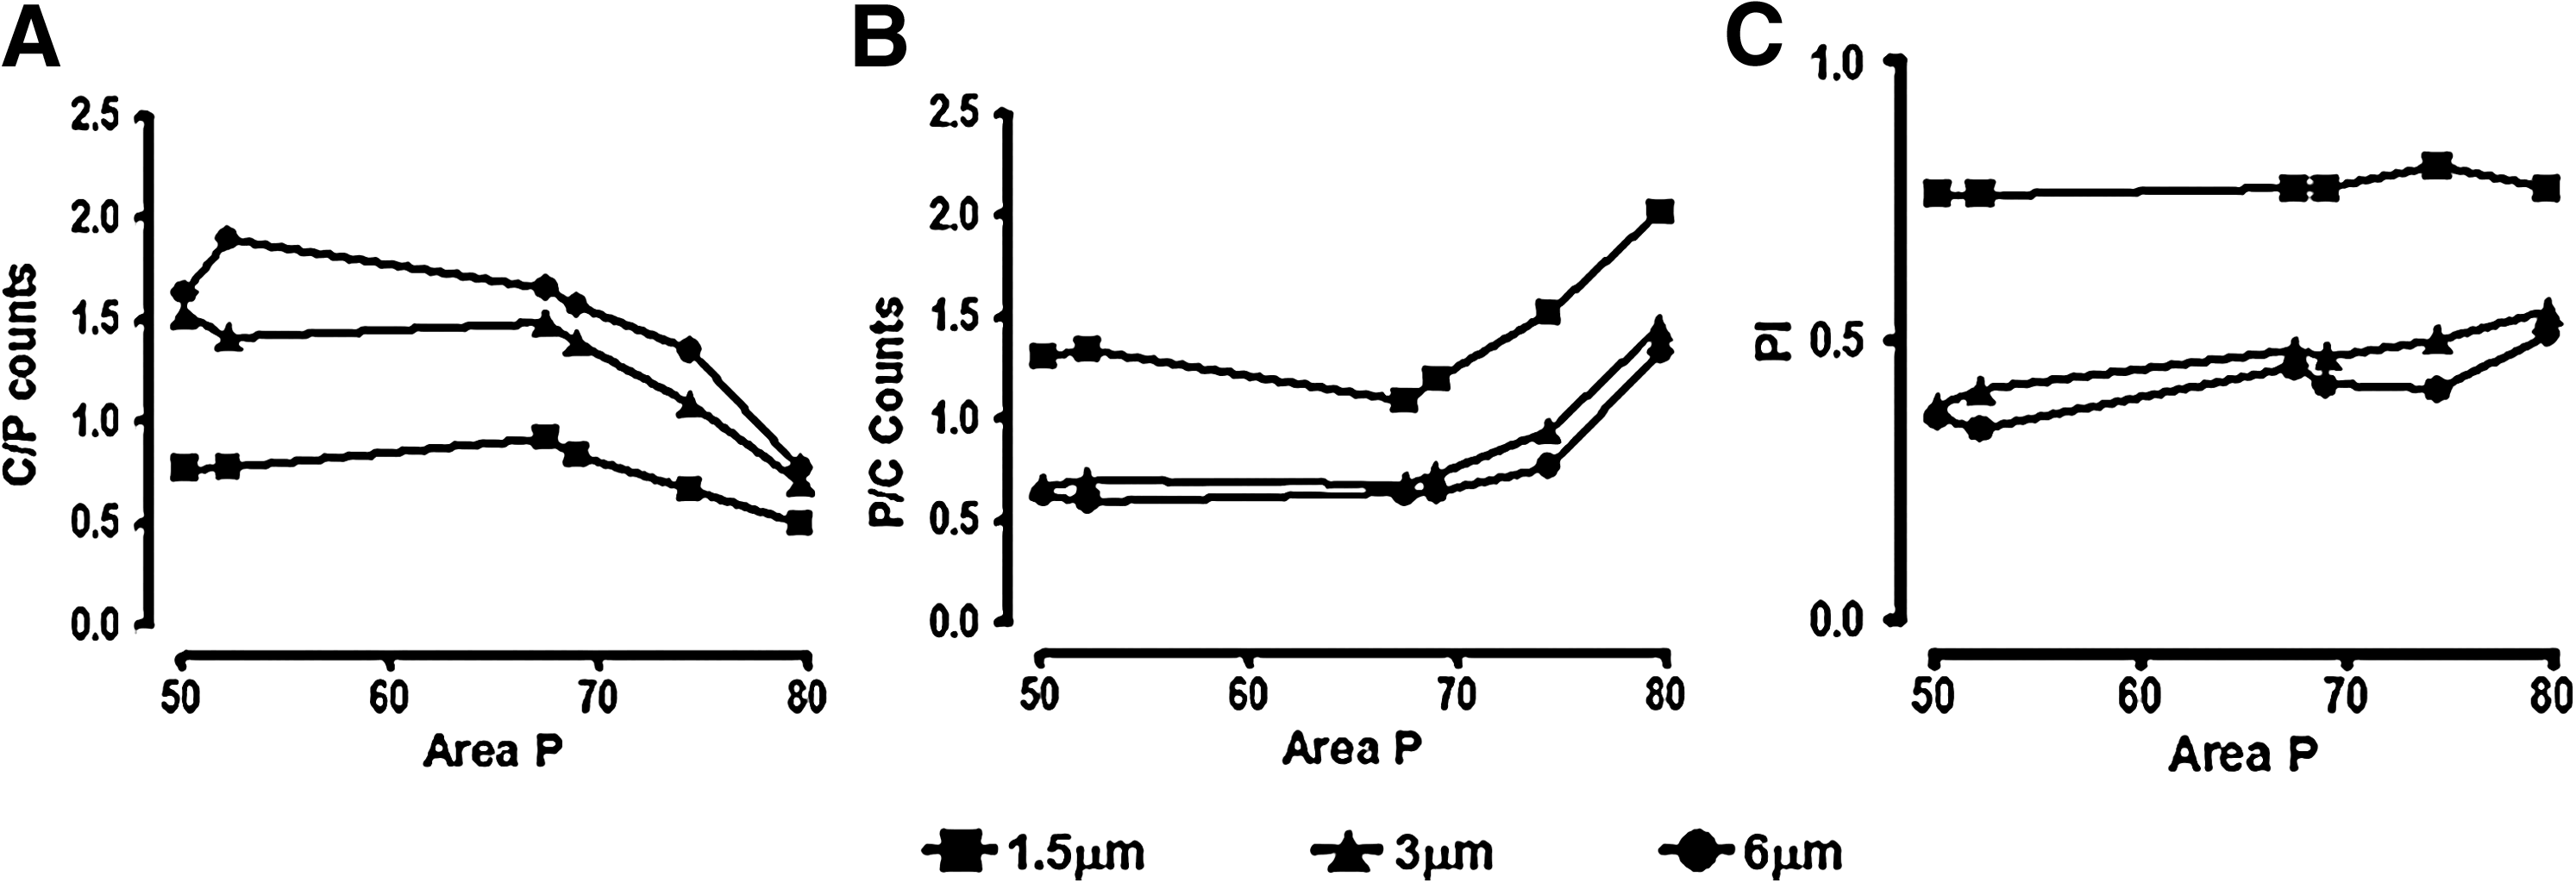
Relationship of regional deposition indices with peripheral (P) area for monodisperse albuterol particle sizes 1.5-μm (square), 3-μm (diamond), and 6-μm (circle) mass median aerodynamic diameter. (
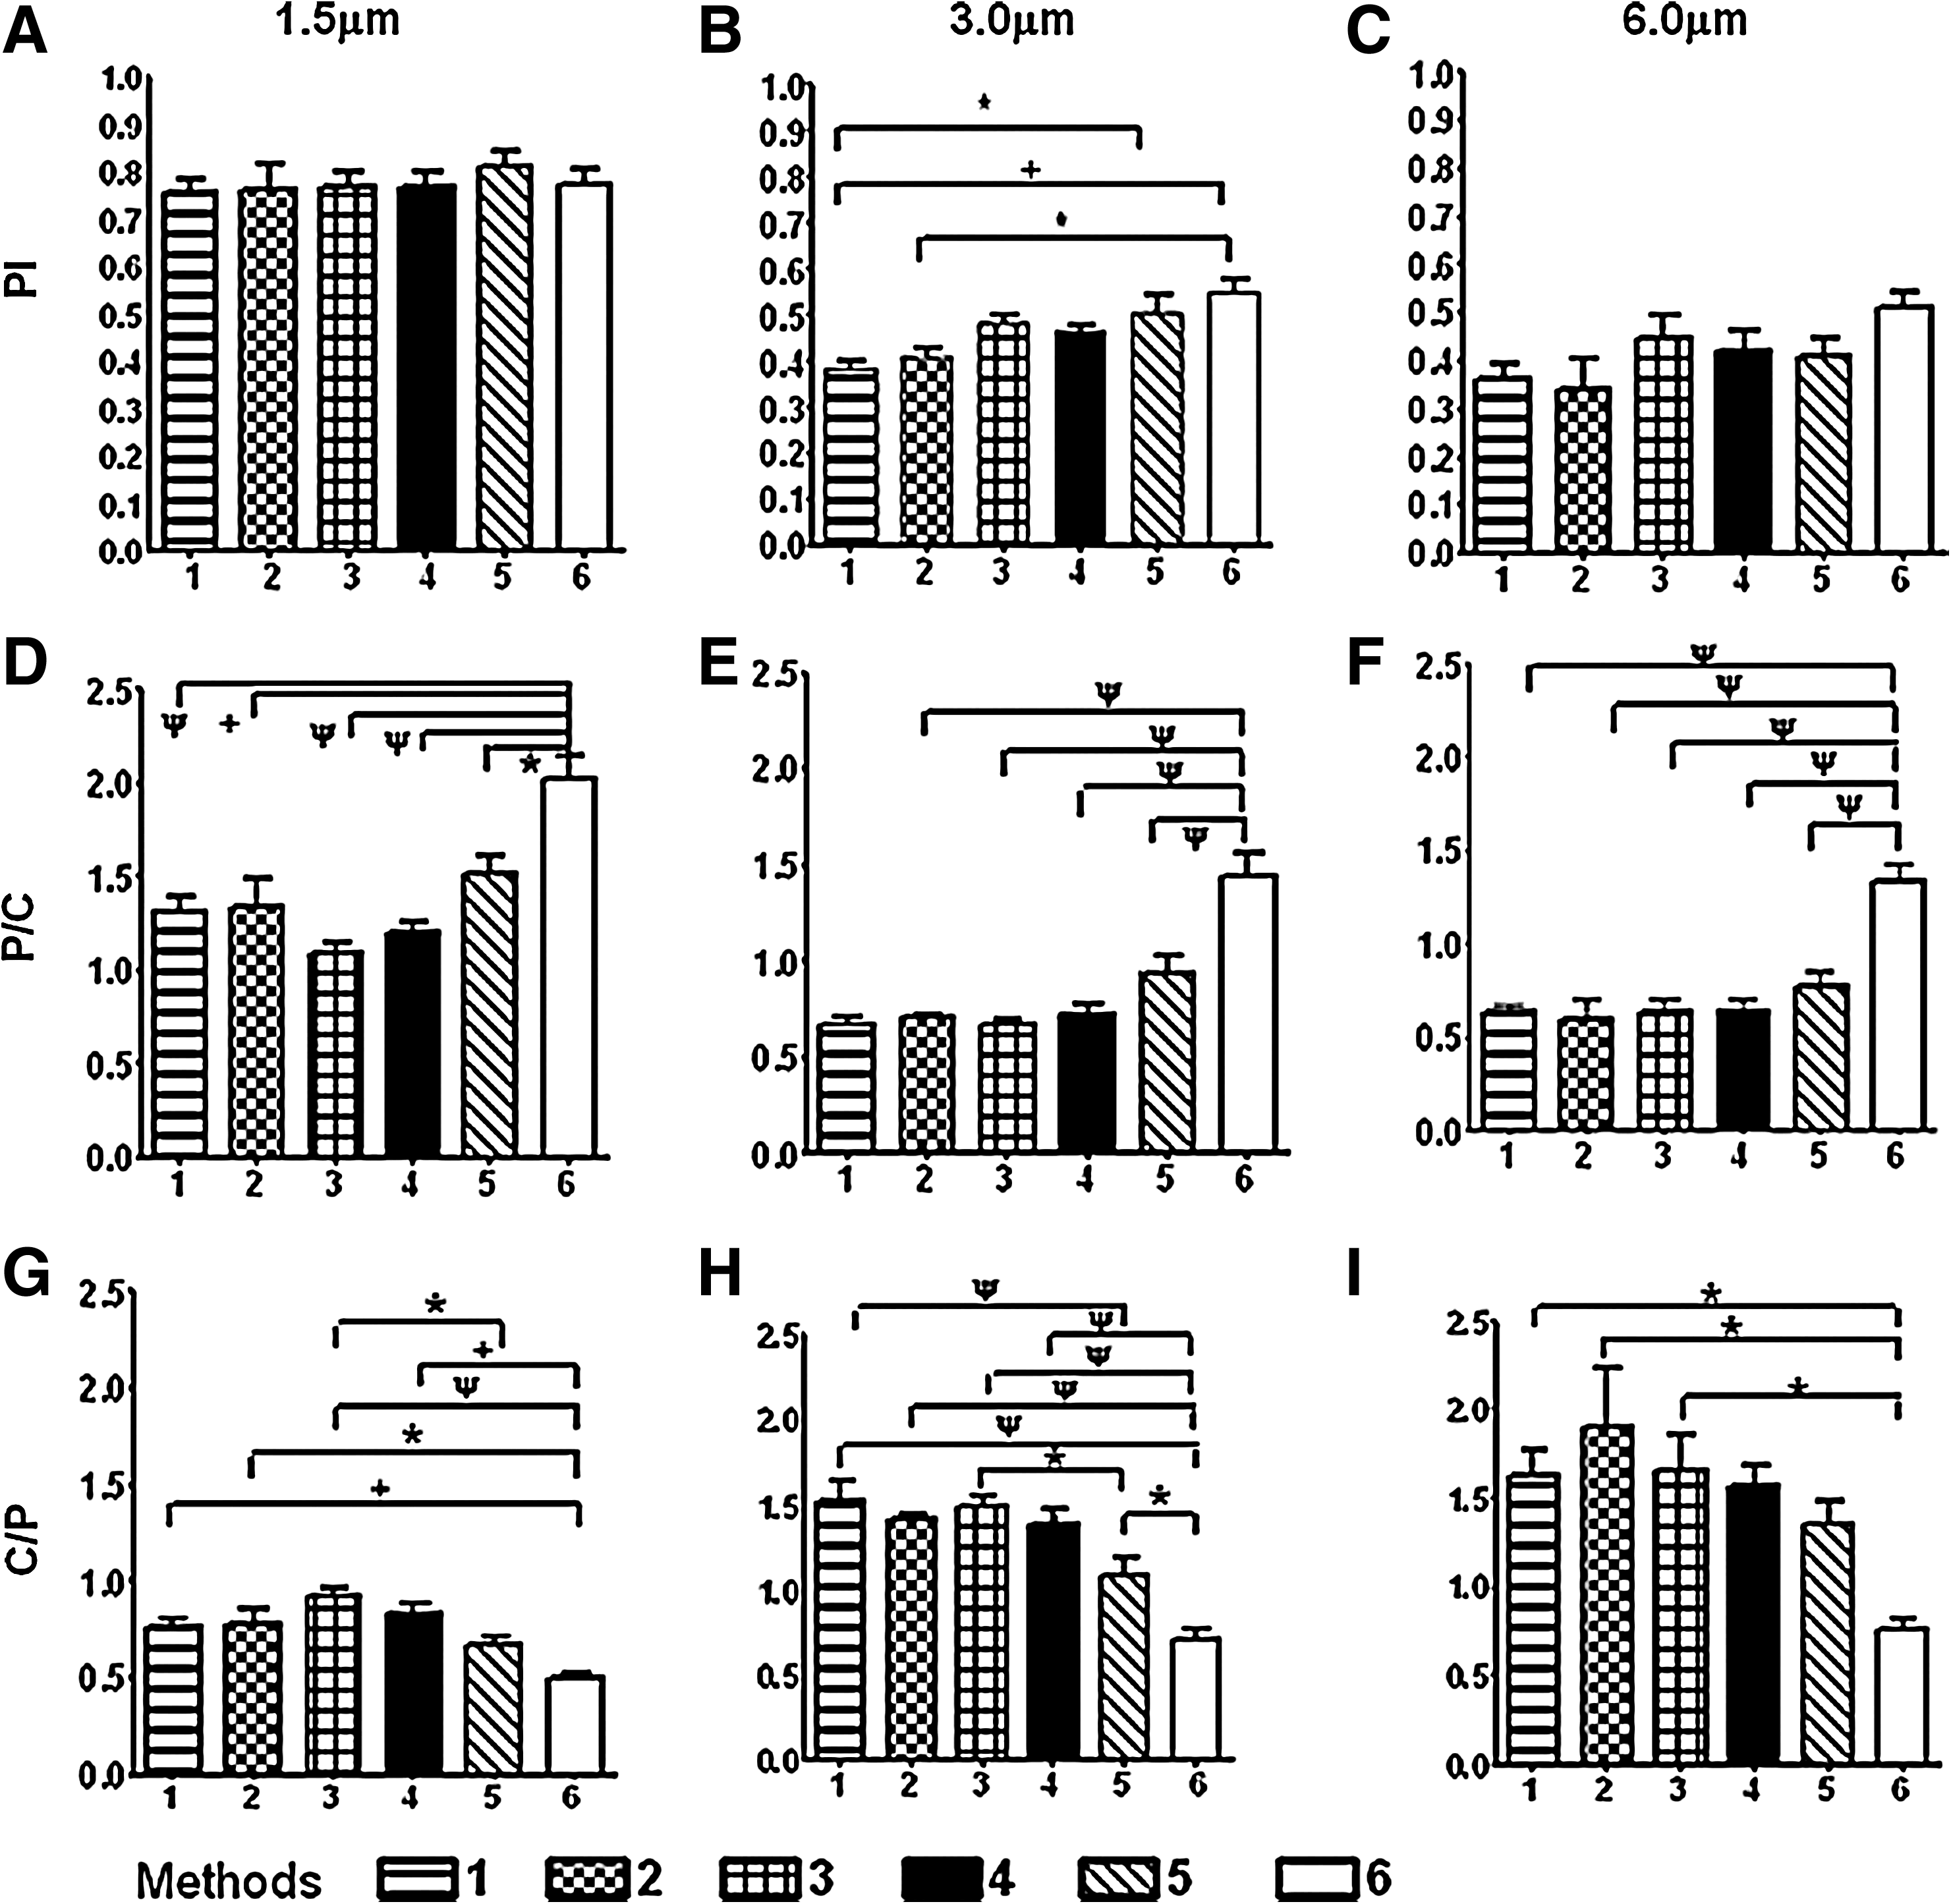
Comparison of regional lung indices for monodisperse albuterol particle sizes 1.5-, 3-, and 6-μm mass median aerodynamic diameter. Panels (
Within the individual 1.5-μm and 6-μm particle size groups, there were no significant differences in normalized PI values between the six methods and for the 3-μm aerosols; only three comparisons were significantly different (p < 0.05) (Fig. 4). Significant differences for PI were observed for the 3-μm particles mainly between Methods 1 and 2,(13,14) with the smallest P areas, versus Methods 5 and 6,(5,17) with the largest P areas; hence, despite normalizing by the ventilation scan, there was still enough difference in PI for there to be a statistical effect. In contrast, there were many more significant differences in the nonnormalized C/P and P/C count-ratios between methods for all three particle sizes, and these were largely in comparison to one method, Method 6, with the largest P area (Fig. 4).(17)
Between different particle sizes, the smaller 1.5-μm aerosols had greater P region of interest counts than the larger 3- and 6-μm aerosols for each of the laboratory methods, whereas 6-μm aerosols had higher C region of interest counts (Table 2). The C/P count-ratio increased, although, conversely, P/C count-ratios and PI values decreased with increasing particle size for each method (Table 4).
Discussion
We investigated six methods most commonly reported in the scientific literature to evaluate scintigraphic imaging of aerosol deposition in human lungs.(5,13–17) Other methods have been used that involve subtle variations in the geometric template.(21,22) Unique to our study we employed monodisperse aerosols, as opposed to polydisperse distributions, which are more sensitive to assess regional anatomical deposition patterns.(12,23) By utilizing different monodisperse particle sizes, we obtained a range of characteristic lung deposition patterns to test the different methods of quantifying regional airways drug deposition (Fig. 1). We observed there were marked differences between the methods we used to delineate the shape and size (and hence aerosol deposition counts) of the individual lung regions of interest. Consequently, this affected the derived regional lung deposition indices.
Of the regional lung deposition indices investigated, we observed the nonnormalized parameters (C/P and P/C count-ratios) were more variable across the six methods and were more affected by the size of the individual C and P regions, compared to penetration index (PI), defined as P/C aerosol counts normalized by P/C krypton ventilation counts.(18) Put another way, PI was much more consistent and hence forgiving of the differences between the studied methods than the C/P or P/C count-ratios.
It might be intuitively expected that penetration index (PI), the normalized parameter, would indeed be less variable, as PI was corrected for both the planar and volume size of the individual regions, although the nonnormalized indices were not. However, we may infer that normalization could render PI less sensitive to the differences in individual C and P counts, and therefore, PI may obscure the underlying variability in aerosol deposition distribution in the lungs that should be brought out. On the contrary, this property could be a strength of PI. The normalized and nonnormalized regional lung deposition indices are complimentary as they are all derived from the same data set, but each index has a different emphasis. We therefore advocate that both normalized and nonnormalized indices should be reported in the scientific literature by investigators to fully interpret, assess, and facilitate comparisons on regional aerosol deposition and penetration in the lungs between studies from different laboratories.
We observed in our analysis some of the methods attributed a greater deposition area to the P region. This may lead to a smaller C/P count-ratio, a larger P/C count-ratio, and a larger PI. Certainly our data showed smaller C/P and larger P/C count-ratios with increasing P region area; however, the normalized PI was less affected by this (Fig. 3). Indeed, most of the statistically significant differences in the comparison between methods for nonnormalized C/P and P/C count-ratios were observed with the method that had the largest P region of interest (Fig. 4). Most of the deposition data reported in the literature have used regions of interest templates with large P regions, which would have exaggerated the amount of drug reported as reaching the lung periphery and hence lower amounts deposited in the C areas. This could be a possible explanation for poor in vitro/in vivo correlations for deposition data.
We also found particle size, itself, strongly influenced the indices of regional aerosol deposition. C/P count-ratios increased with increasing particle size for each method and conversely, P/C count-ratios and PI decreased (Fig. 4). We also observed the 6- and 3-μm particles gave similar values in the lung deposition indices (Fig. 3). Our results are consistent with previous data, where larger 6- and 3-μm monodisperse particles show more central airways deposition compared to 1.5-μm particles that preferentially deposit toward the lung periphery.(24) Once again, there was greater agreement between the methods for PI values compared to C/P and P/C count-ratios, within each particle size group (Fig. 4). PI for the smallest particle (1.5 μm) changed the least with the size of the P region, compared to larger particles, and this was probably due to a higher proportion of the aerosol already deposited in the P region, such that an increase in the size of the P area had a minimal effect (Fig. 3). In contrast, the deposition of the larger particles (3 and 6 μm) were more evenly shared between the C and P regions. We acknowledge that attenuation differences between C and P regions may possibly be an explanation and influence this effect of the variable size of the P region on PI as previously reported.(25)
Another important difference we observed between laboratories was that different centers used different methodologies for ventilation scanning and lung boundary definition in their approach to analyzing regional deposition. We used a krypton (Kr81) ventilation scan to define the lung boundaries while some laboratories used xenon (Xe133) equilibrium scans,(17) and others in the literature have used cobalt (Co57) or technetium (Tc99) transmission scans.(20) Laboratories also varied in their cutoff definition of the lung boundary, which reflects different approaches to reducing image noise or background counts.(5,16) Our findings may therefore be predisposed toward one method of regional analysis. However, in this article, we undertook to compare the regional lung templates used by different investigators, rather than replicate each individual methodology procedure in full, as to do so would be impractical requiring access to the same imaging equipment (gamma cameras, collimators), software analysis, and similar patients. Indeed, it would not have been ethically feasible to undertake all three techniques of krypton, xenon, and transmission scanning in each patient.
Our subjects were relatively mild unobstructed (FEV1 90% predicted) asthmatic patients. Both krypton and xenon scanning methods rely on the gas being able to reach the lung periphery by ventilation. However, for significantly obstructed lungs this would not be the case, and this is particularly true for krypton as, because of its short half-life (13 sec), it decays before it is able to build up in under ventilated areas and therefore gives an image purely of airway ventilation rather than the lung periphery. For poorly ventilated lungs, a lung transmission scan is the preferred method of choice.(20) In this technique, the patient is sandwiched between the gamma camera and cobalt-57 or technetium-99m flood source and, gamma rays pass from the flood source through the patient to the gamma camera. As the lungs are less dense and have lower attenuation coefficients than the surrounding tissue, they appear as bright areas surrounded by darker tissue areas on the transmission images, which allows an outline of the subject's lungs to be drawn. It would be apparent that standardization of methodologies across laboratories needs also to take into account ventilation scanning: in particular, the degree of patient airway obstruction and also practical access to tracer gas. Krypton gas is less widely obtainable because its parent isotope, rubidium-81, must be generated from a cyclotron. This may not be available and the relative cost of the gas is high, in contrast to transmission scanning.
It is rather surprising that there was nearly equal krypton ventilation distribution between the left and right lung, whereas ventilation distribution is usually a 45% left- and 55% right-lung split. As discussed, in poorly ventilated lungs krypton scanning may not able to wholly assess ventilation distribution and airway equilibration compared to other modalities,(17) as krypton gas may not be able to penetrate to the periphery of the lungs due to its short half-life. Indeed, as has been previously shown by the same authors in 12 mild-moderate asthmatic patients (mean FEV1 76.8% predicted) also using krypton scanning, there was a 45 and 55% split in ventilation between the left and right lung, respectively.(26) We postulate that the current studied group of asthmatic subjects were of milder disease severity (mean FEV1 90% predicted), and hence, may have had less regional ventilation inhomogeneity between lungs, compared to our previous data. There were also fewer patients in the current study compared to the previous data set. These differences in ventilation, however, would not alter the derived regional lung deposition indices.
Errors in positioning the regions of interest can also influence the calculation of the regional lung deposition indices and positioning methods also need standardization as they can add variable noise to the deposition indices. For example, aerosol deposition “hot spots” spanning the border between two regions of interest, may disproportionately affect the regional deposition indices as a result of a slight shift in positioning of the borders. Using a reference marker such as a cobalt spot mark on the sternal notch may allow more accurate alignment of the different lung deposition images taken from the same patient and for comparing across laboratories. Deposition in the stomach and mediastinum may also cause overlap of image-counts with the lung region. Where it is clear by their proximity to the nonoverlapping portion of the stomach that the image counts are indeed stomach counts, they should be accounted for by drawing appropriate regions and subtracting these image counts from the lung counts. In their method, Brown and colleagues(17) consistently exclude the lower two “D” regions of the left lung (Fig. 2). Alternatively, many investigators only use the right lung for deposition analysis, entirely avoiding the stomach region.
Most of the examined methods studied utilized a two-compartment division of the lungs, whereas some incorporated an additional intermediate region into a three-compartment model (Fig. 2). This arbitrary division of lung deposition images invites the question: what do individual regions of interest represent in terms of the underlying anatomical airway structures?
Researchers often attribute large proximal conducting airways to the “inner”/central regions of interest and the distal small airways and alveoli to the “outer”/peripheral regions of interest.(1,2) However, 2D planar imaging of the three-dimensional lung will lead to an overlay of anatomical structures in the C region in that small peripheral airways will be superimposed on large conducting airways. This is an important consideration, especially for assessing the lung deposition images from standard commercial polydisperse aerosols that have wide particle size distributions (GSD >1.22). Polydisperse aerosols will be more extensively dispersed within the intrapulmonary airways, in contrast to monodisperse aerosols (GSD <1.22) with a similar MMAD.(23) The narrower size distribution of monodisperse aerosols allows more selective regional airway targeting and deposition within the intrapulmonary tree. We therefore propose our planar images, in concert with previous established experimental data,(11,12) gives us greater confidence to better delineate the nature of the airway profile (distal (1.5 μm) versus proximal (6 μm)) contributing to the individual C, I, and P regions of interest in our deposition images.
Techniques also exist that distinguish between tracheobronchial and alveolar airways deposition by calculating the 24-h retention of radioaerosol, as routinely performed in lung mucociliary clearance studies.(27) This may further identify and delineate the small airways and alveolar zones within the peripheral (P) region, but the technique is only applicable to inert nontherapeutic aerosols. Other approaches to refine the definition and quantification of regions of interest to reflect underlying anatomical lung structures more accurately have incorporated anatomically realistic 3D computer-simulated models of lung airways derived from computed tomography (CT) and/or magnetic resonance imaging (MRI) of human subjects to improve the quantification of pulmonary aerosol deposition from 2D scintigraphic images.(28–31) Martonen and colleagues,(28,29) derived their airway dimensions from human morphometric data with lung boundaries formulated from gamma scintigraphy protocols. They applied their model in the interpretation of planar gamma camera images by overlaying C, I, and P regions of interest on the model to calculate the proportion of alveolated airways in each individual region. Hoffman's group,(30) based their airway geometry on 3D CT images from human subjects and developed mathematical algorithms that produced subject-specific airway trees with branching asymmetry, which were anatomically consistent with the human airways geometry. They applied airflow modeling to make subject-specific evaluations of aerosol deposition in the intrathoracic airways.(31) Approaches from both groups derive values for the diameters of individual airways, the number of airways, and angle of bifurcation, and could be applied to the interpretation of radiolabeled aerosol particle deposition per airway generation versus particle size.
It is clear from this discussion that accurately defining the lung regions of interest will also have implications for assessing and determining the clinical importance of the regional airways targeting and deposition of therapeutic aerosols within the intrapulmonary tree. Indeed, very few studies have been conducted with this hypothesis a priori.(24) Accurately assessing physiological clinical endpoints of large conducting airway versus small acinar airway responses also present an obstacle. However, newer techniques such as multibreath nitrogen-washout (MBNW), fractional exhaled nitric oxide (FeNO), and forced oscillation technique (FOT) may allow differential regional lung assessment (small vs. large airways) as evidenced by recent studies using inhaled drug formulations with specific ability to penetrate into the distal lung.(32)
Conclusions
We have shown that the various approaches used by different laboratories to delineate and define lung regions of interest can produce varying results and interpretations in quantifying aerosol deposition and distribution in the lungs. These differences in methodology between laboratories illustrate that care needs to be taken in interpreting the results.
The most important difference between the methods was the size and shape of the P region, which led to significant differences in the regional deposition indices and this affected nonnormalized indices much more than the normalized penetration index (PI). We observed normalizing the lung volume/area using a ventilation scan had an important effect on the data by showing that all the methods produced very similar values of penetration index. This was particularly noticeable with smaller (1.5 μm) particles, which are deposited more peripherally and therefore less affected by changes in area and positioning of C and P regions. We conclude and advocate that investigators should always quote normalized values, in addition to nonnormalized indices, in order to fully interpret, assess, and facilitate comparisons on regional aerosol deposition and penetration in the lungs between studies from different laboratories.
Our data contribute to the current consortia-led initiative that highlights the need for a standardized approach to facilitate data comparison between laboratories and, in interpreting how individual regions of interest relate to underlying lung geometrical structures.(8)
Footnotes
Acknowledgments
This research was supported by the NIHR Respiratory Disease Biomedical Research Unit at the Royal Brompton and Harefield NHS Foundation Trust and Imperial College London.
Author Disclosure Statement
No conflicts of interest exist for any of the authors.