
Abstract
Abstract
Background:
Hydrogen peroxide (H2O2) is detectable in exhaled breath condensate (EBC) and has been proposed to be a surrogate marker of oxidative stress in the airways. In this study we tested whether the breathing pattern during EBC collection influences the concentration of exhaled H2O2.
Methods:
EBC was collected during (1) tidal breathing and (2) breathing with increased tidal volume for 10 min from 16 healthy volunteers. On-line H2O2 measurement was performed by the EcoCheck™ biosensor system. Repeated measurements were also conducted to assess intrasubject reproducibility.
Results:
Minute ventilation, tidal volume, expiratory flow rate were all increased significantly when subjects were asked to perform breathing with increased tidal volume. In parallel, EBC volume increased (1413 ± 59 vs. 1959 ± 71 μL, p < 0.001), whereas exhaled H2O2 levels decreased significantly (1400 ± 170 vs. 840 ± 130 nmol/L, p < 0.001). H2O2 levels did not correlate with any individual breathing parameters (p > 0.05). Assessment of intersubject variability of H2O2 measurements during the two types of breathing revealed a coefficient of variation of 49 and 54%, respectively. The EBC H2O2 measurement was highly reproducible (888 ± 176 vs. 874 ± 156 nmol/L) as tested during normal breathing.
Conclusions:
These data demonstrate that the concentration of H2O2 in EBC depends on the ventilatory pattern during sample collection that has to be taken into consideration in all EBC H2O2 assays.
Introduction
Exhaled breath condensate (EBC) collection is a simple and completely noninvasive method of sampling the lower respiratory tract.(2) EBC samples are collected by cooling and collecting the exhaled breath during tidal breathing. In 10 min long sampling approximately 1–2 mL of EBC can be collected, which contains a large number of constituents varying form simple ions to cytokines. Although there is a huge expectation toward exhaled biomarkers for diagnosis and disease monitoring, there are still some unresolved methodological questions limiting the clinical applicability of the method.(2)
H2O2 can be detected under physiological conditions in children(3) and healthy adult volunteers.(4) Moreover, exhaled H2O2 has potential as a marker of oxidative stress in the lungs and also in monitoring airway inflammation. Increased concentration of H2O2 is implicated in a variety of airway diseases, including asthma,(5,6) chronic obstructive pulmonary disease (COPD),(7,8) bronchiectasis,(9) interstitial lung diseases,(10) and cystic fibrosis.(11,12)
In those studies a wide range of H2O2 level had been reported both in healthy and disease state. Apart from the different methods used for H2O2 detection, methodological factors are likely to account for the diverse findings. We hypothesized that differences in breathing patterns may contribute to the high variability of H2O2 level in EBC. Previously it has been shown that the concentration of H2O2 in the exhaled air depends on expiratory flow rate.(13) In that study, however, flow dependency was observed only with flow rates much higher than those observed during tidal breathing required for EBC sampling, and a resistor against exhalation was used, which is not recommended for normal EBC sampling.
Therefore, the aim of our study was to test whether change in breathing pattern in a range that may happen during sampling influences the concentration of EBC H2O2 in healthy subjects. Because EBC H2O2 values are usually close to the detection limit of different assays and there are some data demonstrating that H2O2 concentration increases during the day,(2,8) we aimed to perform our study during that time of the day when high H2O2 baseline concentrations are found to enable us to detect potential decreases in the level of this molecule. Therefore, we first tested the daytime variability of EBC H2O2 in healthy subjects, before proceeding with the main objectives of the study.
Materials and Methods
Study subjects
Sixteen nonsmoking, healthy volunteers from the NHS Royal Brompton Hospital Asthma Research Laboratory were recruited [eight males, eight females, mean age: 32 ± 5.5 years (range: 26–44)]. Subjects had normal lung function values [forced vital capacity (FVC): 96.9 ± 3.2% and forced expiratory volume in 1 sec (FEV1): 99.4 ± 3.4%) with no history of acute or chronic respiratory diseases or respiratory infection in the previous four weeks. None of them were taking any medication. The protocol was approved by the Ethics Committee of the Royal Brompton and Harefield National Health Service Trust and informed consent was obtained from each subject participating in the study.
Study design
In a preliminary study we assessed EBC H2O2 concentration at three different time points of the day (morning: 8:00–9:00 a.m., noon: 12:00–13:00, and afternoon: 16:00–17:00) to determine optimal sampling time for the main study. All subjects were instructed to refrain from heavy exercise before each collection, but otherwise continued with their normal daily schedule. In the morning, EBC condensate was collected after having breakfast. EBC samples were collected during tidal breathing for 10 min. Based on the data obtained afternoon was chosen for sample collection in the main study.
In the main part of the study, subjects were asked to visit the laboratory in the afternoons of 3 consecutive days. On day 1, the intrasubject reproducibility of EBC H2O2 measurement was tested. Subjects were asked to perform the same EBC collection procedures twice after each other: they were asked to breathe normally (tidal breathing) into a cooling chamber for 10 min to collect EBC and then to perform a second EBC collection in the same manner. Only an approximately 1-min long technical break was kept between the two sampling periods (that was required to change the sampling tubes). On day 2 again two sampling periods were performed: first EBC collection with normal tidal breathing was performed and it was followed by the second collection period when subjects were asked to switch to deep and large inhalations and long exhalations with an individually comfortable frequency (breathing with increased tidal volume). On day 3 the same two EBC collection periods were repeated in reverse order: first, EBC was collected, while subjects breathed with increased tidal volume, and this was followed by another sampling period with normal tidal breathing. Importantly, breathing with increased tidal volume used in our study is different from maximal voluntary ventilation as it is designed to avoid hypocapnic dizziness or collapse by keeping slow and long expiratory periods. Each EBC collection period lasted for 10 min. Between sampling periods only a short technically required break was kept that lasted for approximately 1 min. Subjects wore nose clips during sampling and were advised to swallow their saliva during sampling whenever it was needed.
Collection of EBC samples
EBC was collected using a commercially available condenser (EcoScreen, Jaeger, Hoechberg, Germany), as previously described.(14) Breathing parameters including minute ventilation (Vm), tidal volume (Vt), frequency, expiratory time, and flow rate were recorded during each collection period using a Tidal Breathing Analyzer (Masterscreen, Hoechberg, Germany).
H2O2 measurement
On-line H2O2 measurement was performed by the EcoCheck™ biosensor system (FILT GmbH, Berlin, Germany) by a validated method as previously described.(15) Briefly, the measurement is based on an electron transfer process catalyzed by peroxidase that is fixed on the surface of the biosensor. Peroxidase-induced H2O2 reduction results in electron transfer on the biosensor that is measurable as a potential difference. The degree of electron transfer is dependent on the H2O2 concentration in the sample. Before each measurement the biosensor was calibrated with standard samples containing H2O2 in a concentration of 500 nmol/L. H2O2 concentration was measured from fresh samples immediately after collection. Each detection procedure lasted 8 min. After each measurement the biosensor was discarded.
Statistical analysis
Data are expressed as mean ± SEM. As data showed normal distribution, to assess daytime changes in H2O2 concentration repeated measures of analysis of variation (ANOVA) and to compare different breathing patterns paired Student t-test was used. Correlation coefficients were calculated by the Pearson's method. Repeated measurements were analyzed by the Bland-Altman test and the calculation of the coefficient of variation. All calculations were performed using GraphPad Prism 4.0 (GraphPad Software Inc., San Diego, CA, USA). A p-value < 0.05 was considered statistically significant.
Results
Circadian change in EBC H2O2 concentration
In the preliminary study we observed a significant increase in H2O2 level during the day. The difference between morning–lunchtime, morning–afternoon, and lunchtime–afternoon levels were all significant (morning: 554 ± 51, lunchtime: 738 ± 61, and afternoon: 1124 ± 136 nmol/L; p < 0.01 and p < 0.001 vs. morning value and p < 0.01 vs. lunchtime value, respectively).
Reproducibility of EBC H2O2 measurement
The H2O2 concentration of EBC collected during tidal breathing on the two consecutive time points was not significantly different (888 ± 176 vs. 874 ± 156 nmol/L, p > 0.05). There was a strong correlation between readings (r2 = 0.98; p < 0.0001; Fig. 1).

Reproducibility of EBC H2O2 measurement. EBC was collected during normal tidal breathing for 10 min with a 1-min break between sampling.
Effect of breathing type on breathing parameters
The type of breathing had an obvious effect on various breathing parameters (Table 1). Accordingly, Vm, Vt, expiratory time, and flow rate were significantly increased and breathing frequency decreased when subjects were asked to breathe with increased tidal volume.
Vm, minute ventilation; Vt, tidal volume; EBC, exhaled breath condensate.
p < 0.005, bp < 0.001, and cp < 0.05 versus tidal breathing.
Effect of breathing type on EBC volume and H2O2 concentration
EBC volume was significantly increased during breathing with increased tidal volume (Table 1). In parallel, H2O2 concentration in samples obtained during this type of breathing was significantly decreased (Fig. 2). H2O2 level was decreased in all subjects. Assessment of the intersubject variability of H2O2 concentration in samples obtained during normal breathing and breathing with increased tidal volume revealed a coefficient of variation of 49 and 54%, respectively.
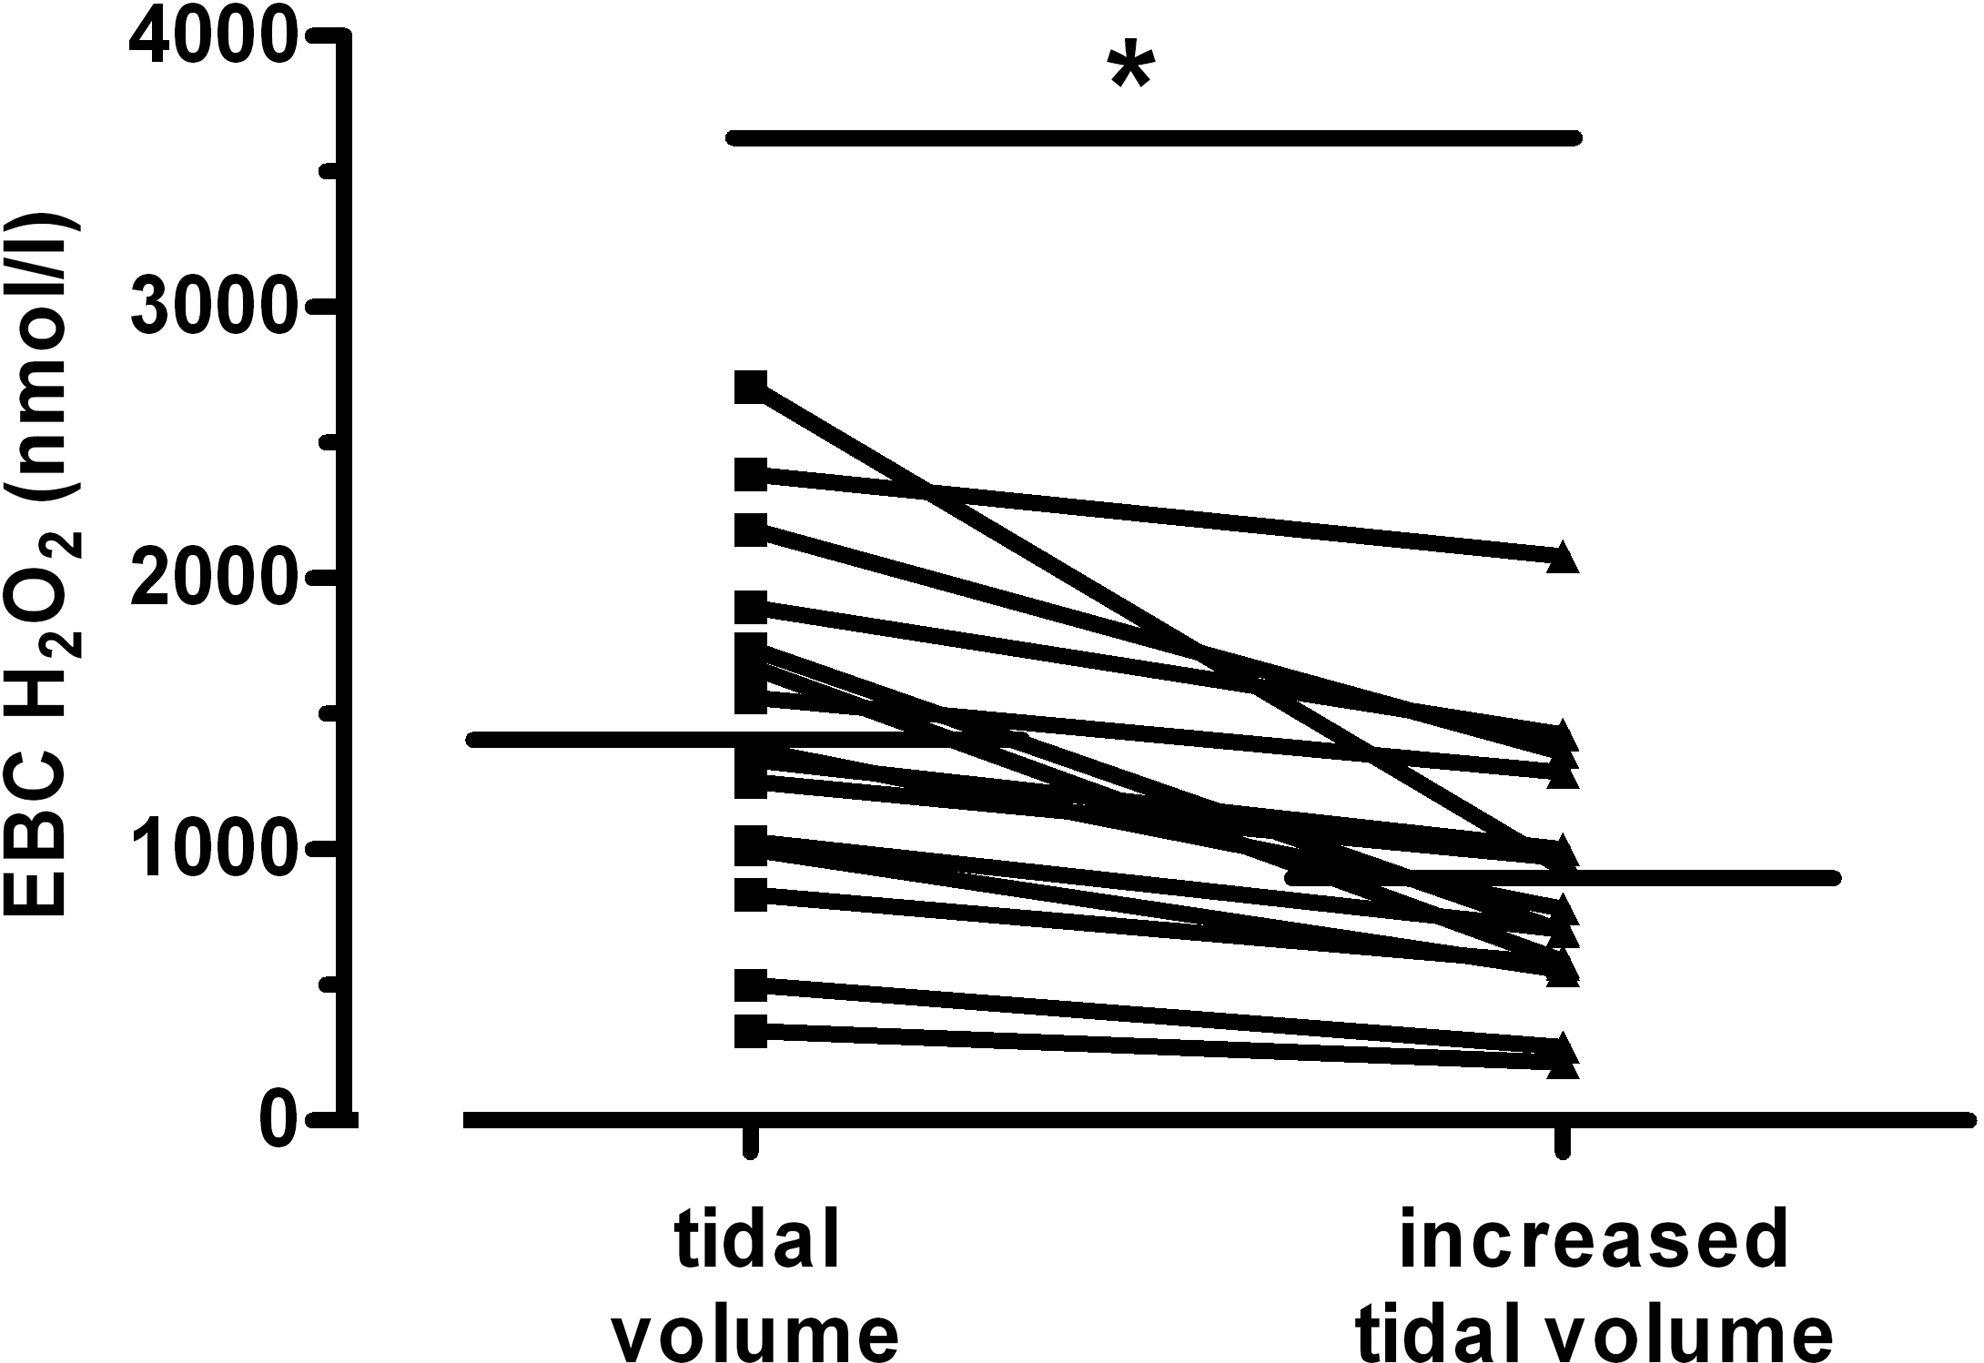
H2O2 concentrations in EBC of study subjects (n = 16) during breathing with normal and increased tidal volume. Horizontal bars indicate mean values. *p < 0.001 versus tidal breathing.
When sampling was repeated in reverse order similar results were obtained. EBC H2O2 concentration was lower in samples obtained during breathing with increased tidal volume compared to that of samples collected with normal tidal breathing (778 ± 145 vs. 1528 ± 151 nmol/L; p < 0.005).
Correlations between breathing parameters, EBC volume, and H2O2 concentration
There was a significant positive correlation between Vm and EBC volume both during normal tidal breathing (r = 0.693, p < 0.005); breathing with increased tidal volume (r = 0.841, p < 0.001). Similarly, expiratory flow rate showed a significant correlation with EBC volume in both types of EBC sampling (normal breathing: r = 0.632, p < 0.01; breathing with increased tidal volume: r = 0.873, p < 0.001).
In contrast, there were no correlations between H2O2 concentration and Vm or expiratory flow rate either during normal tidal breathing or breathing with increased tidal volume. Similarly, no associations were found between Vt or frequency and EBC volume or H2O2 concentration. EBC volume did not correlate with H2O2 concentration either, irrespective of the breathing pattern (data not shown).
Discussion
In the present study we investigated whether the level of H2O2 in EBC depends on breathing pattern during condensate collection. We found that the concentration of H2O2 in EBC decreased when subjects performed breathing with increased tidal volume compared to that when subjects breathed normally during condensate collection. The effect of ventilatory pattern on H2O2 concentration may explain, at least in part, the high degree of variability in H2O2 levels in EBC found in many recent studies.
EBC is a rich source of pulmonary biomarkers. However, large variability in the concentration of solutes in EBC samples has been reported resulting in a considerable overlap between normal subjects and disease groups. It has been suggested that methodological factors including ventilatory pattern may account for the diverse findings. However, previous studies investigating the relationship between ventilatory pattern and EBC constituents have been inconclusive. Experimental data using a calf model revealed that H2O2 concentration in EBC is not influenced by variables of spontaneous breathing.(16) In humans Schleiss et al.(13) demonstrated that the concentration of the volatile solute H2O2 is dependent on flow rate. Others showed that although Vm and Vt are major determinants of EBC volume,(17,18) but ventilatory pattern has no significant effect on EBC protein and nitrite concentrations,(18) certain leukotriene levels,(19) and pH.(18,20)
We demonstrated that the level of H2O2 in EBC was reduced in samples collected during breathing with increased tidal volume compared to normal tidal breathing. Breathing with increased tidal volume was associated with increased minute volume and expiratory flow rate. It is important to note, however, that neither of these variables showed a significant correlation with EBC H2O2 concentration in our study indicating that these variables per se are not directly linked to H2O2 production and/or release in the airways.
In line with our findings the volume of EBC is generally believed to increase with higher Vm and/or Vt.(18,19) This may simply reflect the increase in volume of air exhaled or be due to greater turbulence generating increased aerosolisation of the airway surface liquid. In favor of this concept expiratory flow rate was closely associated with EBC volume in our study. By contrast, the reason for decreased H2O2 level in samples collected during breathing with increased tidal volume is not clear. It is conceivable that breathing with lower frequency results in a reduction of ROS production in the lung. Alternatively, during the increased expiratory time H2O2 could be degraded in the airways. Finally, although there was no correlation between changes in EBC volume and H2O2 level, increased EBC volume could still partly account for the altered H2O2 concentration in EBC.
We acknowledge that the definition of the breathing with increased tidal volume is somewhat imprecise and a number of minor variations may occur (i.e., deeper inspiration or longer expiration) when subjects perform this ventilatory pattern. However, breathing pattern is not standardized and ventilatory parameters are not recorded during EBC collection either. We propose that the breathing pattern is an important confounding factor in the measurement of H2O2 in EBC and this may explain, at least in part, why reported levels in EBC vary so much in previous studies.
The dilution of airway lining fluid (ALF) in EBC samples has been recognized as a potential confounding factor in EBC biomarker measurements and several means of the determination of dilution factor have been proposed.(2,21) It is important to note that this approach cannot be used for volatile compounds in EBC, for which other aspects need to be considered.(22)
Similarly, we cannot exclude the possibility that the position of the Tidal Breathing Analyzer could also impact on H2O2 readings. However, as the setup was not modified throughout the study, its effect, if any, influenced all readings equally.
Our results also show a great daytime variability of H2O2 level in normal subjects demonstrating an increase during the day. Similar findings were demonstrated by others.(8) Food intake, changes in normal baseline production of H2O2 or probable physical activity all may be responsible for the actual H2O2 level in EBC. Several types of food, drink, and beverages contain H2O2 themselves or elevate the oxidants level in many body fluids as it was previously published.(23) The observation on daytime variability raises the issue whether we should use stricter conditions around EBC collection to keep results more comparable or keep the “normal“ H2O2 range wider in case of usual circumstances when patient cannot be studied at morning hours.
In conclusion, we demonstrated that the breathing pattern influenced the concentration of H2O2 in EBC samples. As the standardization of the breathing pattern during EBC collection may be difficult in clinical situations, the usefulness of exhaled H2O2 as a marker for the assessment of airway inflammation appears to be limited.
Footnotes
Acknowledgments
EcoCheck™ biosensor system was a kindly gift from Jaeger (Hoechberg, Germany) made possible by Günther Becker. Dr. R. Gajdocsi was supported by the Hungarian Respiratory Society. Dr. B. Antus is a recipient of Bolyai Janos Scholarship provided by the Hungarian Academy of Sciences. Authors are thankful to dr. I. Barta for assisting in manuscript preparation. The study was supported by the Hungarian National Scientific Foundation (OTKA T68808, K83338).
Author Disclosure Statement
No conflicts of interest exist.