
Abstract
Abstract
Background:
Experimental deposition was studied using three different mouth–throat models: (1) the standard United States Pharmacopeia induction port (IP), (2) the idealized human mouth and throat replica developed by the University of Alberta (UofA replica), and (3) the conductive rubber mouth–throat cast from a human subject developed by Lovelace Respiratory Research Institute (LRRI cast).
Methods:
Both solid and liquid monodispersed fluorescent particles in the size range of 2–30 μm in diameter were delivered into the devices at flow rates of 15, 30, and 60 L min−1. For solid particles, the study was conducted with and without grease coating inside the devices to investigate the effects of particle bounce.
Conclusions:
Large amounts of rebounded particles were found for the IP and UofA replica without the coating treatment, while particle bounce was only observed at the large particle size for the LRRI cast. The UofA replica and LRRI cast agreed well for solid particles with coating treatments and liquid particles. The deposition results from this study were also compared to data of in vivo deposition studies from the literature. The deposition efficiencies in the UofA replica and LRRI cast were within the range of in vivo data, which showed a large scatter.
Introduction
Many studies used realistic mouth–throat models to conduct studies of particle deposition. Mouth–throat replicas have been used to determine the deposition mechanism in the oropharyngeal region. Particle sizes from ultrafine (<0.1 μm) to course (around 30 μm) were tested in an airway cast developed by Lovelace Respiratory Research Institute (LRRI).(8–15) These studies illustrated the dominant deposition mechanisms for different particle size ranges, and the experimental results are in good agreement with in vivo deposition data.(15) Numerous authors have used this oral airway geometry in the computational fluid dynamics (CFD) simulation to study the flow and particle transport.(16–18) Deposition efficiency obtained from the CFD simulation agreed well with the experimental data. Mouth–throat replicas were also used to determine the drug delivery for the development of inhalation drugs or devices. Lin et al.(19) studied how the size of the mouth pieces affected particle deposition. Ali et al.(20) and Dunn et al.(21) tested metered dose inhalers, dry powder inhalers, and nebulizers for specific medicines with mouth–throat replicas.
Stapleton et al.(22) developed an idealized mouth–throat replica at the University of Alberta. This model is an average geometrical mouth–throat based on data from a computer tomography scan, magnetic resonance imaging scan, and living subjects. This idealized model has been the basis of many studies, including in vivo, in vitro, and theoretical calculations.(3,22–27). These studies provide detailed information of particle deposition in the mouth–throat region. Other investigators including Jayaraju et al.,(28) Longest et al.,(29) Takano et al.,(30) and Xi and Longest(31) conducted studied deposition of particles also with different geometries. The CFD calculation was the basis for most of these studies.
Information on particle deposition in the USP IP is rare. Longest et al.(29) compared CFD calculations with some experimental data on particle deposition efficiency in the USP IP; the theoretical calculation and experimental data agreed well. Verseeg et al.(32) reported a CFD calculation for particle trajectory. However, no deposition data were presented. Shrubb(33) studied drug delivery comparisons with and without coating in the USP IP; only he presented the active mass of the drug deposited in the IP. Zhang et al.(34) presented experimental data of particle deposition in the IP with coating, but they did not test the deposition without coating, which is actually the standard practice with inhaler testing. There are many publications regarding particle characterizations with cascade impactors and USP IP; however, the particle deposition efficiencies in the USP IP were not reported as a function of particle size and flow rate. The present study evaluated particle deposition in the USP IP, the mouth–throat region of the human cast from LRRI (LRRI cast), and the idealized mouth–throat replica developed by the University of Alberta (UofA replica). The main purpose of this study was to compare regional deposition of the three models under the same test conditions. We also investigated deposition patterns for solid and liquid particles to provide more detailed information on the performance of the USP IP under different conditions.
Materials and Methods
United States Pharmacopeia and physical mouth–throat models
The United States Pharmacopeia(7) defined a straight 90° bend as a mouth–throat model or IP for impactors that are used to evaluate inhalation drugs (Fig. 1A). The IP is the current pharmaceutical industry standard apparatus for impaction measurement of the aerosol size distribution. Another mouth–throat model used in the present study, was an “idealized” mouth–throat replica, the UofA replica, developed at the University of Alberta(22) (Fig. 1B). The geometry of the UofA replica was determined by averaged data based on computer tomography scans, magnetic resonance imaging scans, and living subjects. The last mouth–throat model we used is a LRRI rubber cast (Fig. 1C).(14) The oral portion of the cast was molded from a dental impression of the oral cavity from a human volunteer. The mold of the other portion of the replica was from a cadaver. The methods for making the cast have been published.(9) In order to compare particle deposition behavior with and without coating, sometimes, the test models were coated by filling in and drawing off silicone lubricating fluids (550, Dow Corning Co. Midland, MI).
Photographs of three test models: (
Particle generation and size measurement
Monodisperse sodium-fluorescein-tagged oleic acid particles were generated by a vibrating orifice monodisperse aerosol generator (VOAG, Model 3050, TSI Inc., St. Paul MN) as liquid test particles. Particles in the diameter range of 2 to 30 μm were used. A pressurized tank was used in the liquid feeding system to provide a steady, continuous liquid solution to the generator.(35) This modified system can generate particles for several hours. An aerodynamic particle sizer (TSI Inc.) was used to monitor and adjust the aerosol size distribution. Only aerosols with a geometric standard deviation <1.1 were considered as monodispersed. In terms of solid particles, seven different sizes of polystyrene latex (PSL) fluorescent aerosols (Duke Scientific, Palo Alto, CA) were used. Particles with a diameter of >5 μm were generated as dry powders by a small-scale powder disperser (Model 3433, TSI Inc.), and particles with a diameter of <5 μm were generated from a medical nebulizer (Hospitak, Lindenhurst, NY). Figure 2 shows the experimental setup for the test. Monodisperse aerosols were generated and neutralized by a Kr-85 source before entering the chamber. When the nebulizer or small-scale powder disperser was used as an aerosol generator, the vibrating orifice monodisperse aerosol generator was used as an air dilutor to provide enough air to the chamber. Three test throats were placed at the end of the chamber. Each throat was connected with a 47-mm glass fiber filter to collect penetrated particles. The sample flow rates were set at 15, 30, and 60 L/min.
Schematic of experimental setup and locations of three sampling points.
Aerosol uniformity at sampling points
The locations of models were placed at sampling points 1, 2, and 3 (Fig. 2). This was done in order to determine whether test particles were well mixed in the chamber. The uniformity of the particle concentration at the three different sampling points was tested by generating salt particles, which are easily generated from the Hospitak nebulizer. The aerosol number concentration, count median diameter (CMD) and geometric standard deviation (GSD) were measured with the aerodynamic particle sizer.
Sample and statistic analysis
After each test, particles deposited in the surface of the throats were rinsed out by using a solution consisting of 50% isopropyl and 50% distilled water for oleic acid particles, and 100% ethyl acetate for PSL particles. All filters were also placed in the solutions for 24 h. The relative concentrations of fluorescent tracers in the solutions were measured with a fluorometer (Model 450, Sequoia-Turner Corp., Mountain View, CA). One drop (35–40 μL) of 1 N NaOH was applied into each glass tube, which contains around 6 mL of sample to stabilize the fluorescence. The relative concentration of the fluorescent tracer in the solution was calculated by taking account of the sampling flow rate, sampling time, and dilution factor. The deposition efficiency of the each device was obtained by dividing the relative concentration of the fluorescent tracer in the device by relative concentration of the fluorescent tracer in the device and filter. Each data point was an average value of triplicate tests and all error bars in the figure were standard deviations of the triplicates.
Results
Particle concentrations, count median diameters, and geometric standard deviations at three sampling points (see Fig. 2) are listed in Table 1. Results indicated no significant differences for all parameters among these three points.
CMD, count median diameter; GSD, geometric standard deviation.
Liquid particle deposition
Liquid particle deposition in these three models was also conducted. As shown in Figure 3, no particle bounce was found. The LRRI cast and the UofA replica showed very similar results at each flow rate. The USP IP appeared to have lower a deposition efficiency than the other two models.

Deposition of oleic acid particles in three models at three flow rates.
Solid particle deposition
Figure 4 shows the comparison of PSL particle deposition in three models without inside grease coating at different flow rates. Deposition efficiency increased with the increase of the particle size and reached a maximum of around 20 μm, and then decreased with the increase of the particle size. This result indicates that the particle bounce occurred when particles were larger than a critical size. In general, higher flow rates result in higher deposition efficiencies. The LRRI cast showed less bounce than the other two models especially at a high flow rate. As a comparison, the grease coating was provided inside each model during the experiments. The deposition results are shown in Figure 5. The particle bounce still occurred for particles larger than 30 μm in diameter, although it was not significant as the ones without grease coating. The deposition efficiency curves of the LRRI cast and the UofA replica were very similar.
Deposition of PSL particles in three models without inside grease coating at three flow rates.
Deposition of PSL particles in three models with inside grease coating at three flow rates.
Deposition of liquid particles versus solid particles
Because inhalation drug delivery involves liquid and solid formulations, it is important to know the deposition behavior of liquid and solid particles. Figure 6 compares the deposition efficiencies of oleic acid and PSL (devices were coated) particles in those three models with the inhalable particles (diameter <10 μm), in which the deposition efficiencies are very close to each other. This result indicates that both liquid and solid formulations can be evaluated in these devices without considering the effect of bounce as long as the devices are coated.
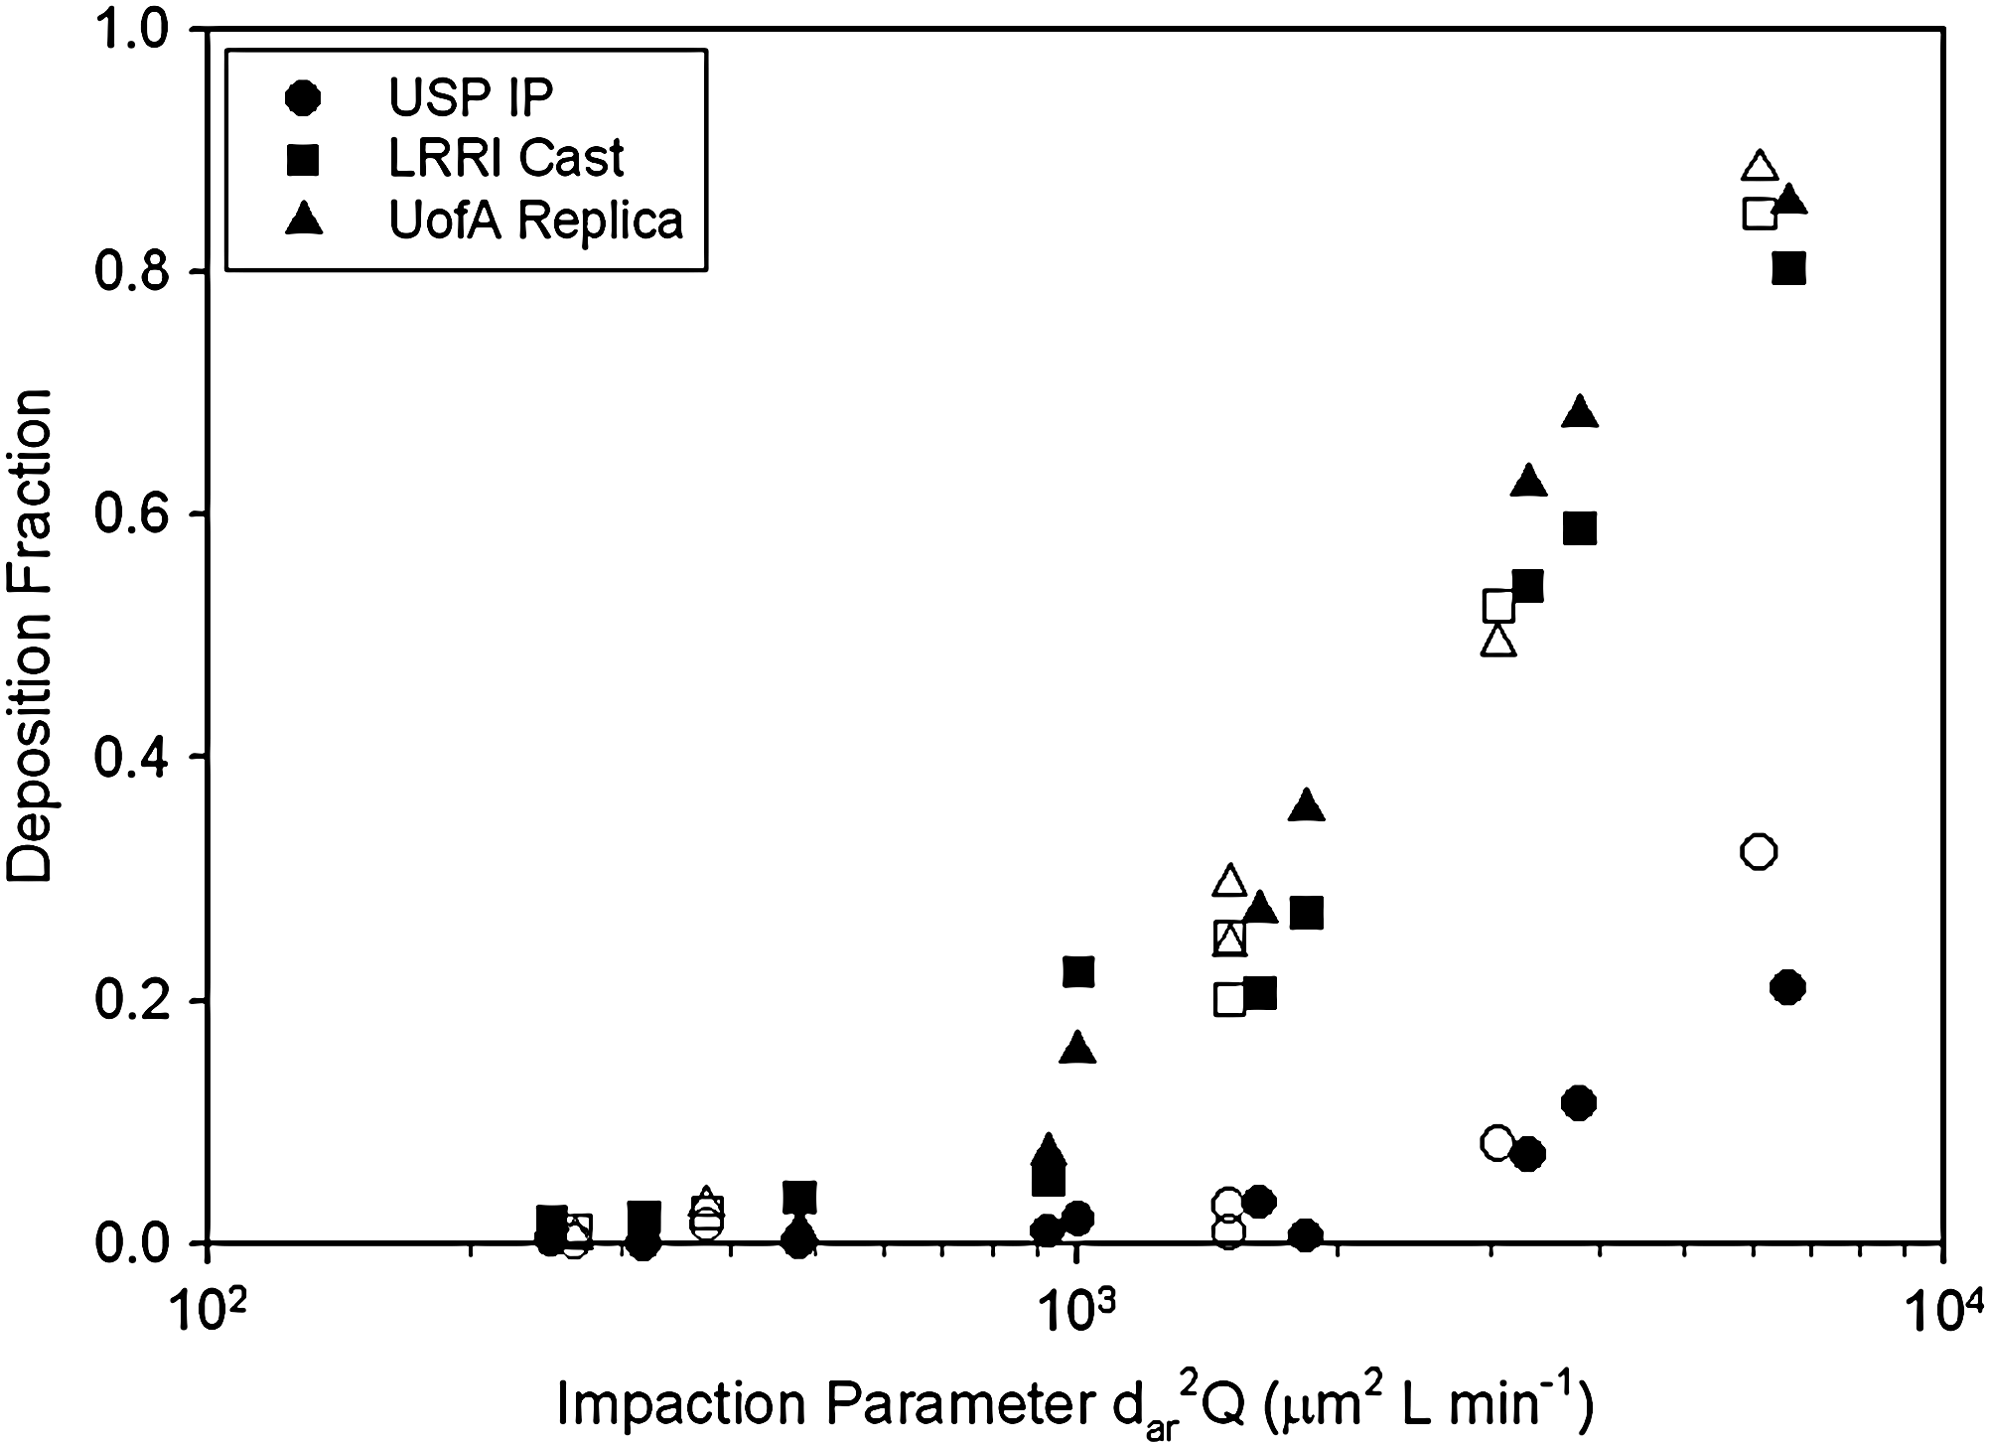
Deposition efficiencies of liquid (oleic acid, filled symbols) and solid (PSL, open symbols) particles as a function of impaction parameter for inhalable particle size (<10 μm in diameter).
Comparison with other studies
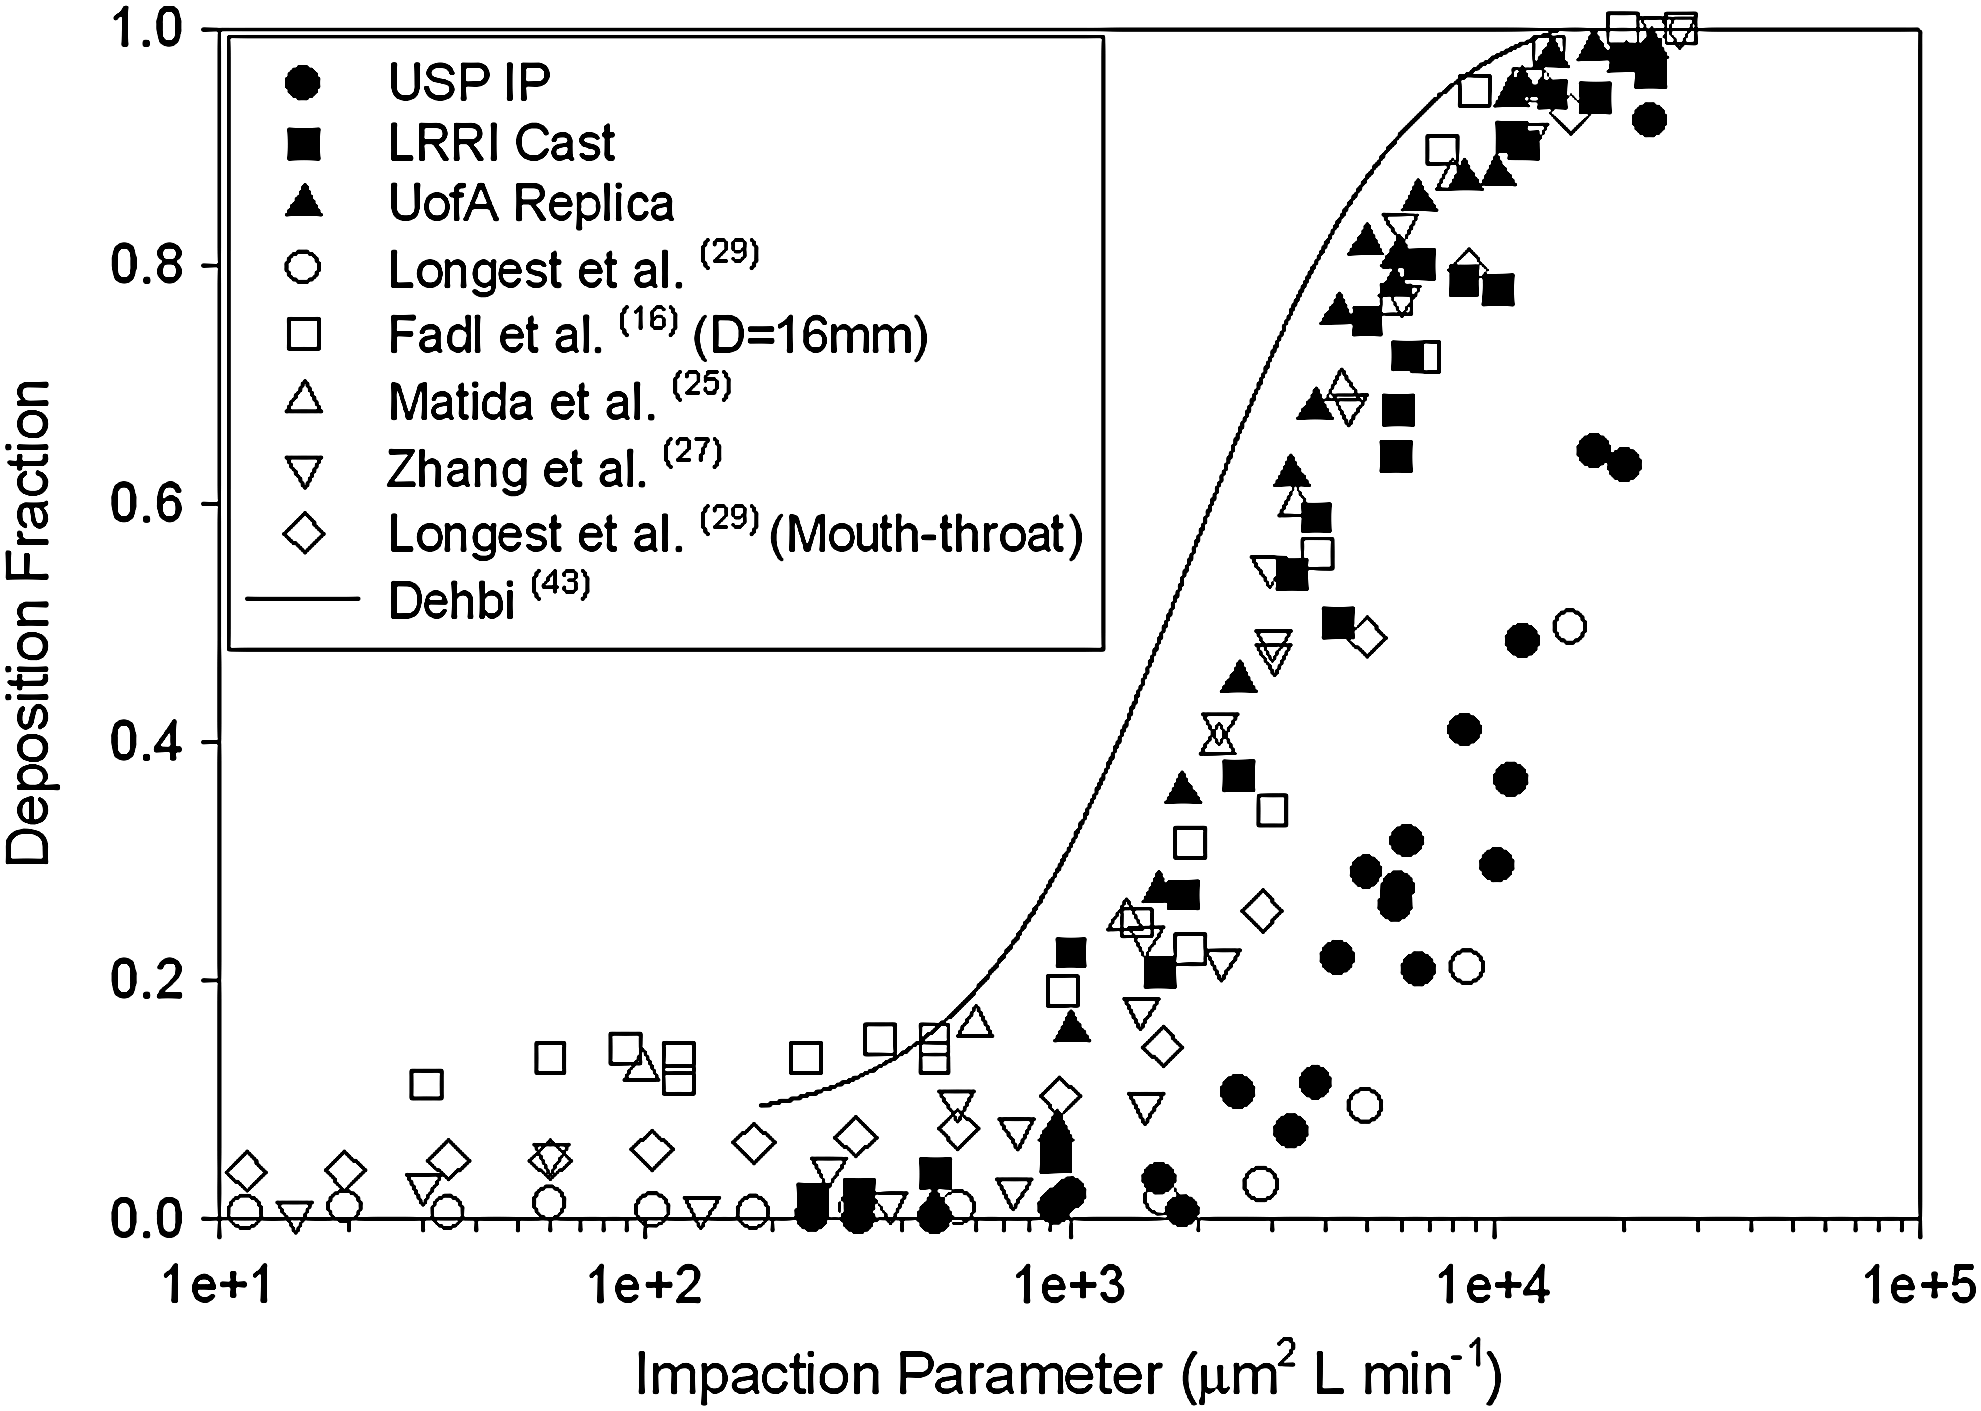
There is much oral deposition data available in the literature including in vivo data, LRRI cast data, UofA replica data, and the semiempirical equation. As each experiment used a different flow rate, it is difficult to compare the results at the same flow rate. Therefore, an impaction parameter (ρd2Q) was introduced for comparison of all results obtained from the literature(14,34,36–42) (Fig. 7). To eliminate the rebounce of the particles, the data in Figure 7 from our current study was only for particles with sizes below 10 μm. This included liquid and solid (with coating) particles. The LRRI cast and UofA replica were within the deposition area.

Comparison of mouth–throat deposition efficiencies from this study (both liquid and solid particles below 10 μm in diameter) with other in vitro and in vivo studies from the literature as a function of impaction parameter.
The scatter in Figure 7 is due to the different oral geometry of subjects and casts. As the traditional independent variable presenting mouth and throat deposition, the impaction parameter dose not account for the influence of the geometry and inlet condition.(24) The LRRI cast data was also plotted as a function of the Stokes number with a Reynolds number correction introduced by Grgic et al.(24) and compared to their empirical equation (1 − 1/(11.5(Stk Re0.37)1.912 + 1) as shown in Figure 8. The calculation of Stokes number and Reynolds number are derived in Equations 4 and 5 of Grgic et al.(24)
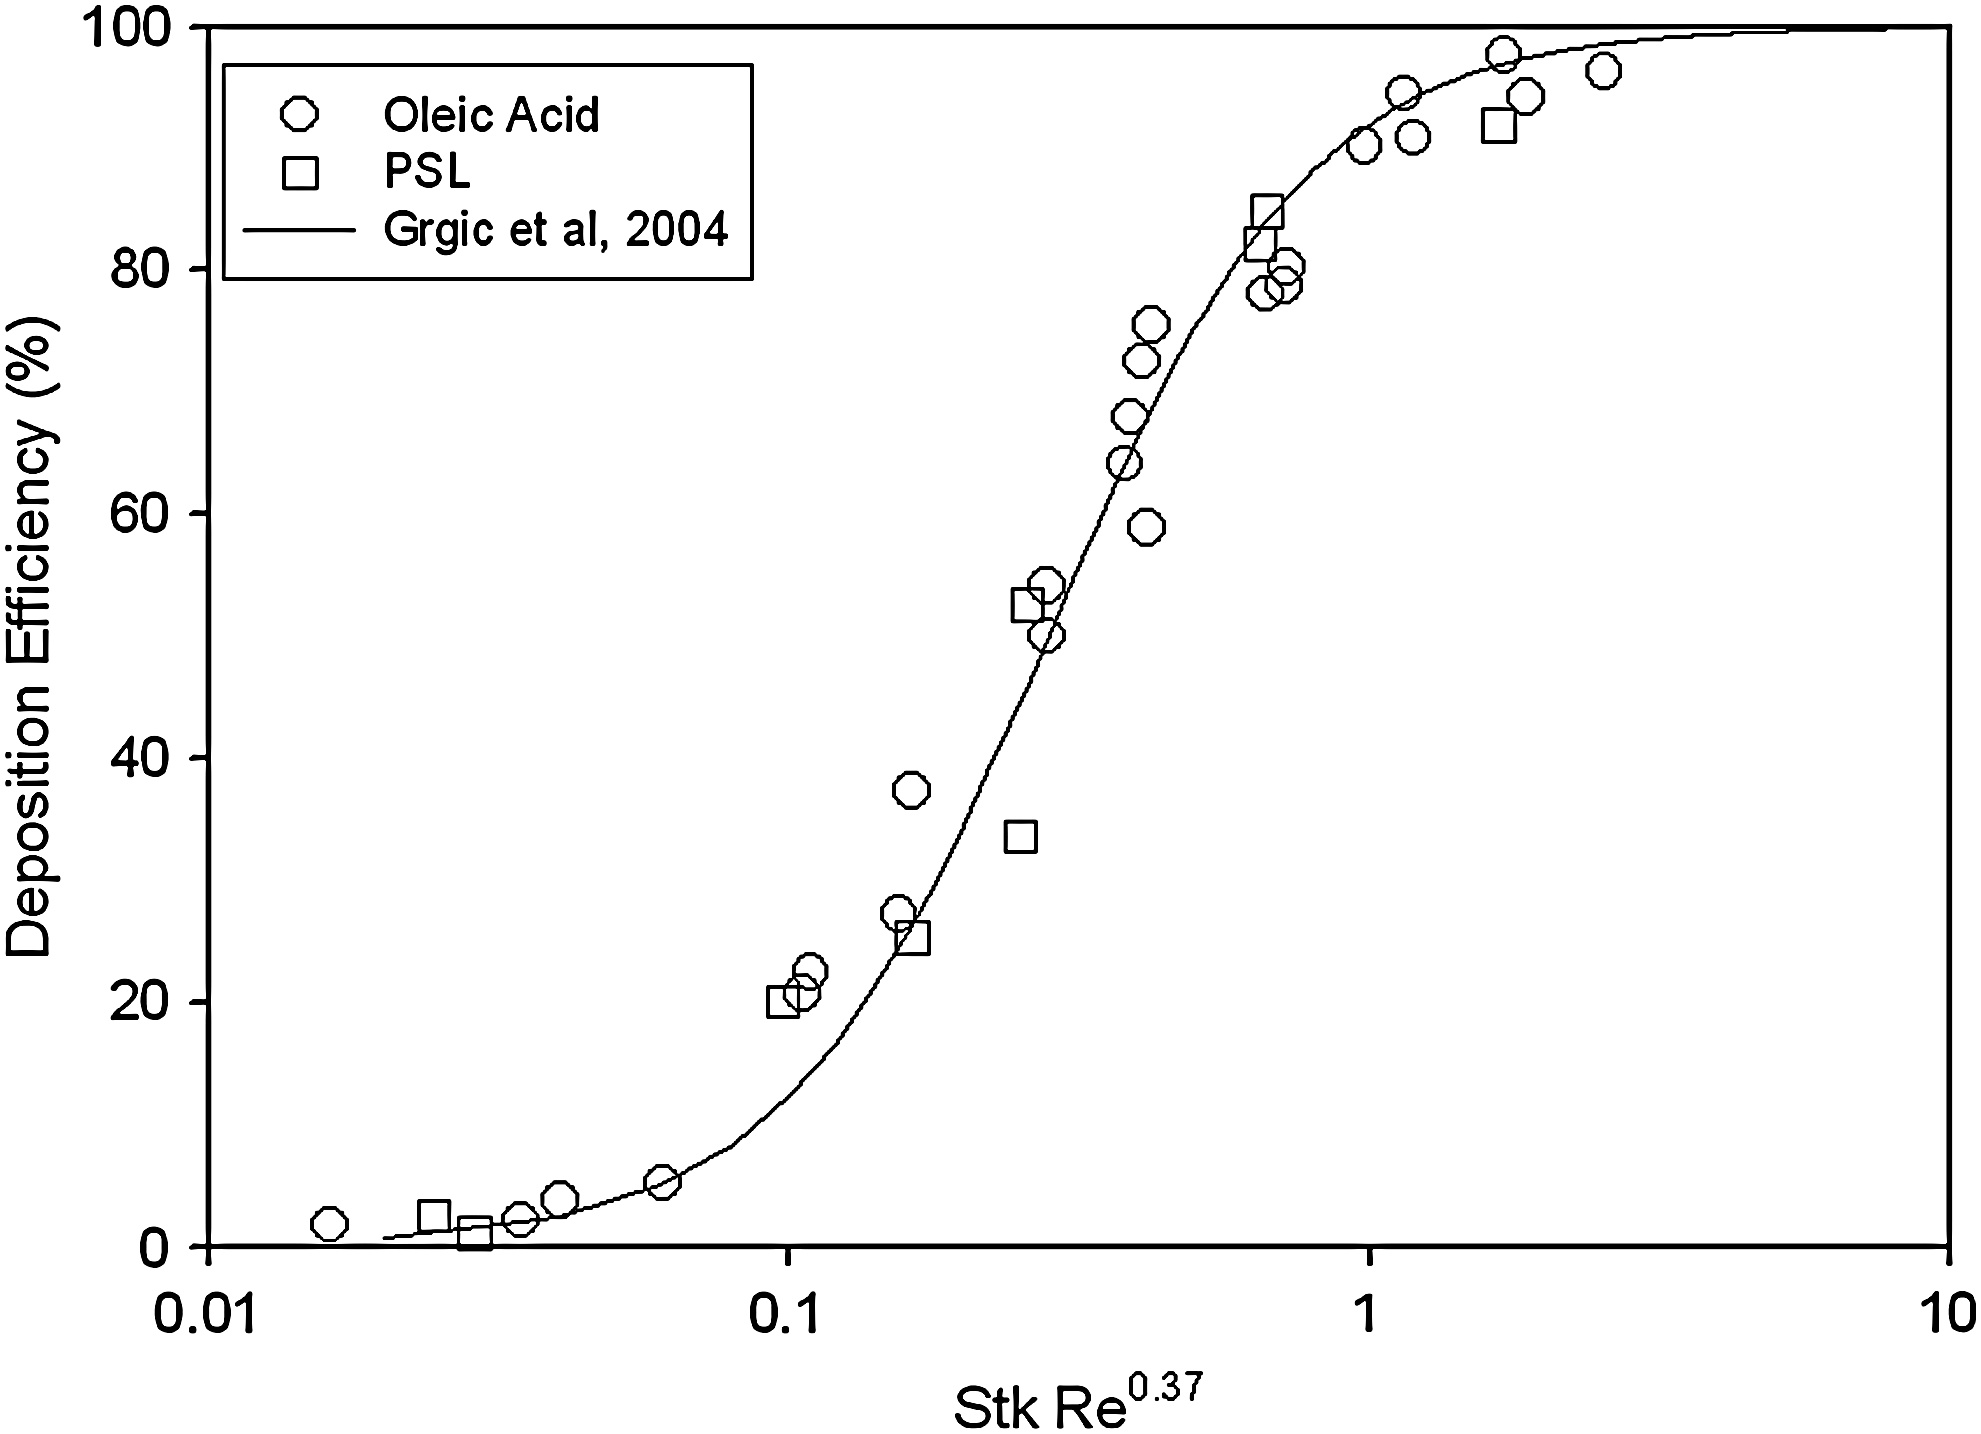
Deposition for the LRRI cast plotted with Stokes number with Reynolds number correction compared to the empirical model developed by Grgic et al.(24)
The experimental data was also compared to published CFD calculations. Some calculations were based on the oral replica used in this study,(16,25,29,43) while others used different geometries.(27,29) Figure 9 shows the results of CFD calculations compared with the current experimental data for all sizes of oleic acid particles as a function of impaction parameter. Good agreement was obtained between experimental data and the CFD calculation for mouth–throat models for most calculations although different numerical methods were used. Only one calculation(43) overestimated the deposition. The USP IP calculation was slightly lower than experimental data.
Computational fluid dynamics numerical simulations from the literature for mouth–throat and USP IP geometries compared to the present study (only liquid particles with all sizes).
Cut point of the United States Pharmacopeia throat
As the induction port of a pharmaceutical impactor, the USP IP has not had a cut-point diameter. However, in some cases, a cut-point diameter of the USP IP is necessary to calculate the inhalation drug distribution. Figure 10 shows the particle deposition data in the USP IP and fitting curves listed below at the flow rates of 30 and 60 L/min:
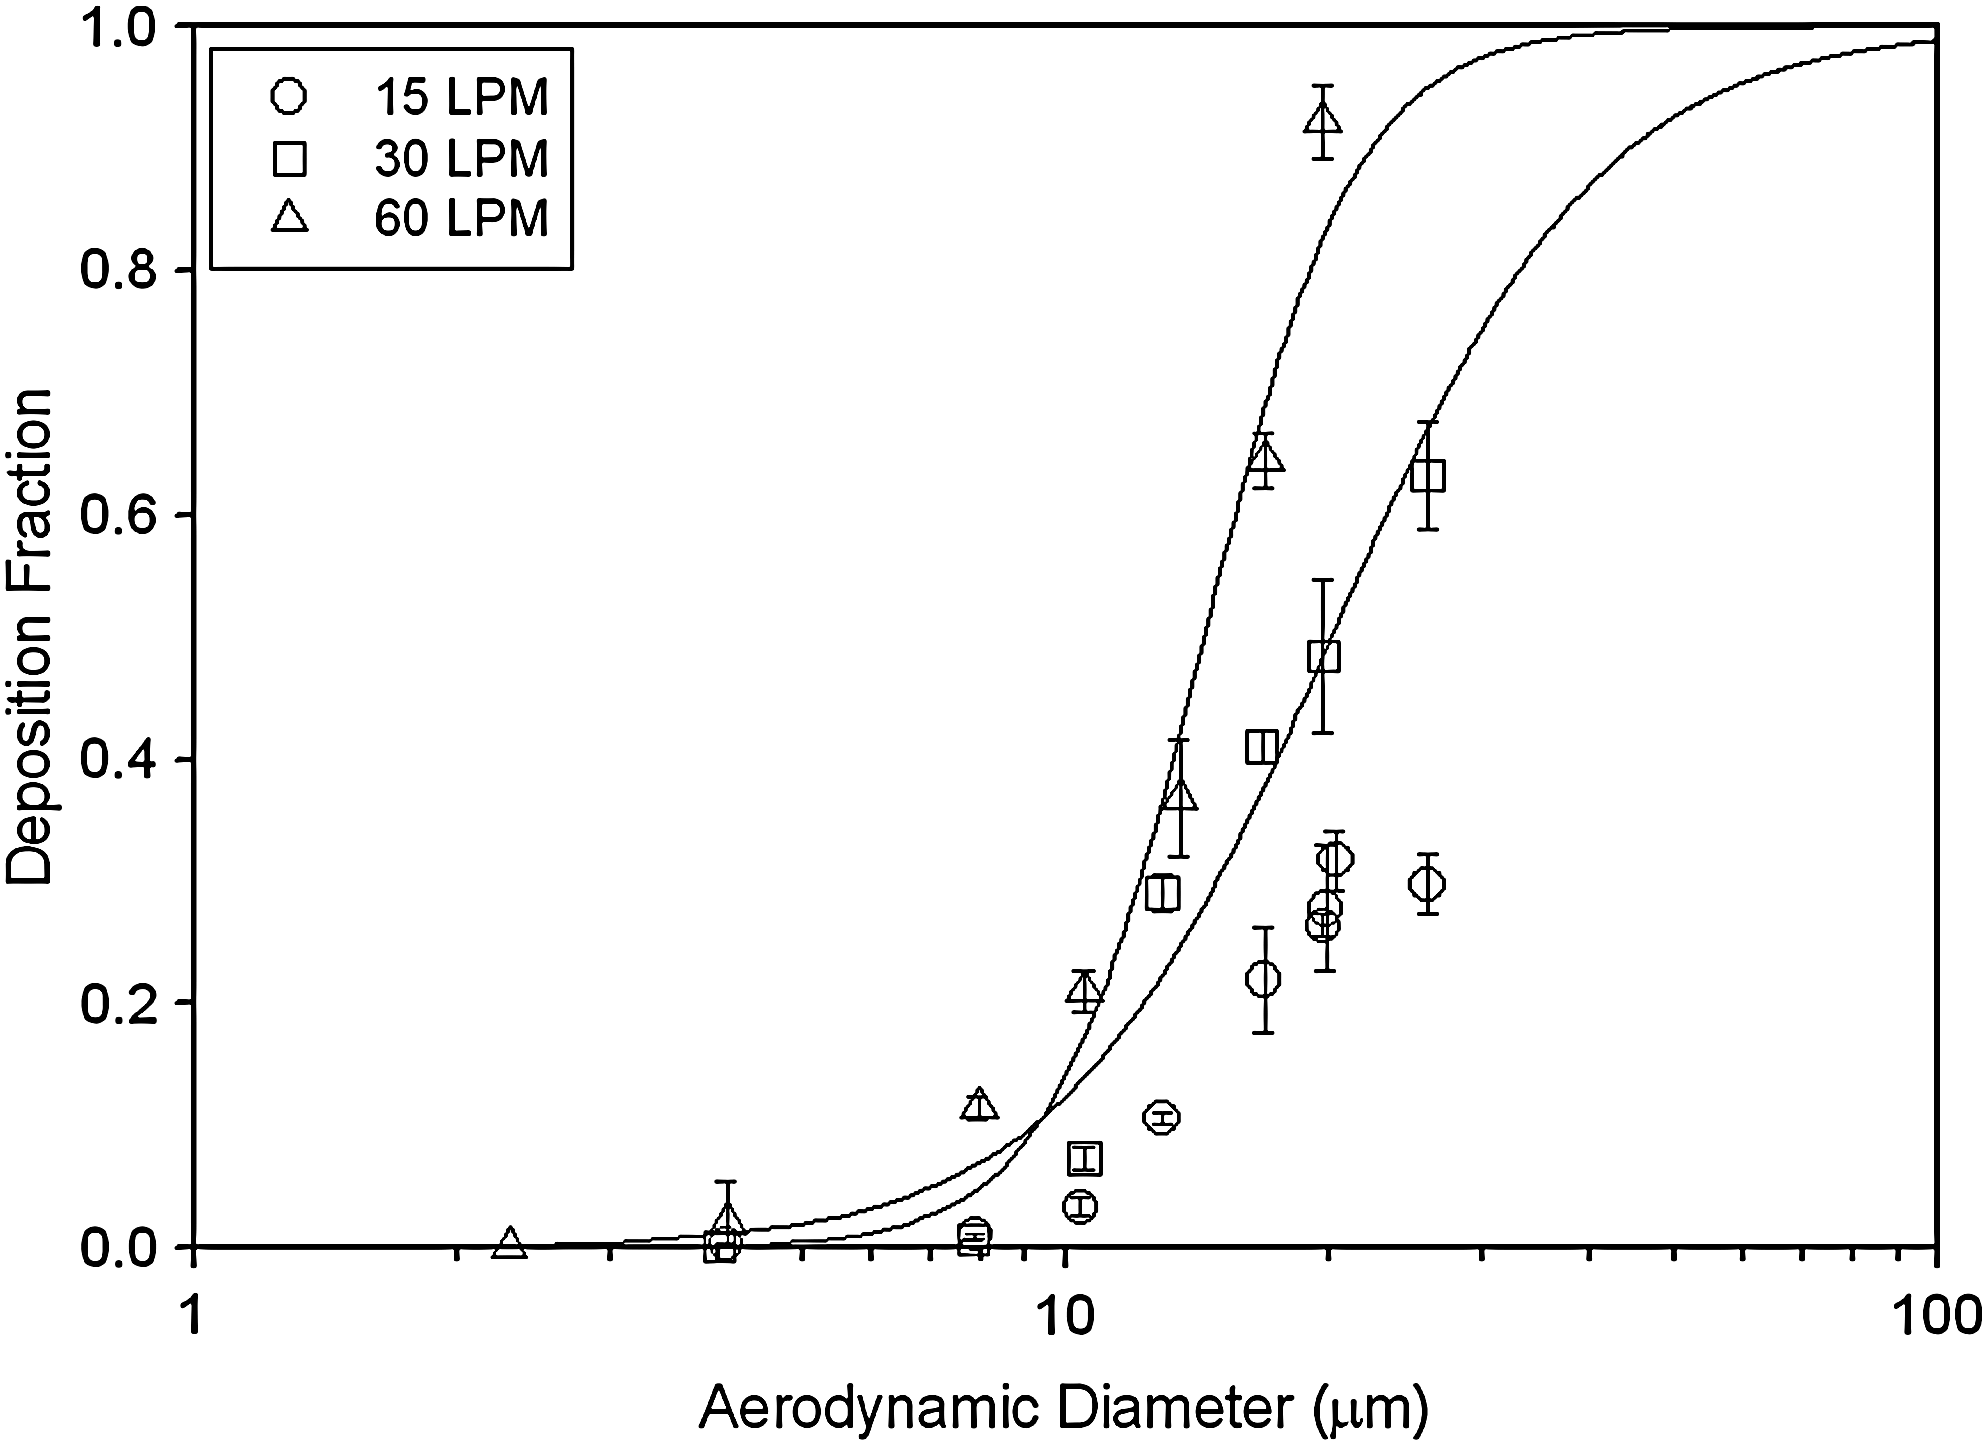
The fitting curves and experimental data of the USP IP deposition for the cut-point diameter calculation.
where da is the particle aerodynamic diameter, a = 2.26 × 10⁻⁴; b = 2.80 for 30 LPM and a = 1.68 × 10⁻⁶; b = 4.98 for 60 LPM. The cut-point diameter for 15 L/min could not be obtained, as the particle deposition efficiency was below 50% at the highest particle size in this study. From the equations of the fitting curves, the cut-point diameters of the USP IP are calculated as 20.2 and 14.4 μm, respectively, at 30 and 60 L/min.
Discussion
Particle bounce occurred at all flow rates for solid particles, even the devices coated with grease. Liquid particles are preferred for calibrating devices used for dispersing large particles. Solid particles <10 μm in diameter should not bounce if the device is coated with grease. For particles <10 μm in diameter, the deposition efficiencies in the LRRI cast were very close for solid and liquid particles with and without coating. Therefore, the LRRI cast is a good model that evaluates the dry powder inhaler especially when the coating materials are considered to affect the assay result.
Flow rate is an important issue for particle deposition in the devices. Basically, low flow rate reflected low deposition efficiency in any case. The deposition of solid particles in a coated device agreed well with that of liquid particles at the flow rates of 30 and 60 L/min. However, at a low flow rate of 15 L/min the difference of deposition differed widely between solid and liquid particles when particles were >10 μm in diameter. This phenomenon only happened at 15 L/min. It is possible that solid particles still bounced in the devices at a high flow rate but deposited on the wall upon contacting it the second time. However, for low flow rates, there was not a second contact made with the wall and the particles passed through the replicas after the first bounce.
This study showed that the particle deposition in the UofA replica agreed with that of the LRRI cast in most cases. To investigate particle deposition behaviors in the oral–throat region, the UofA replica is a good simulator.
The United States Pharmacopeia induction port was considered as a simulation of the human throat in some reports. However, according to this study, the particle deposition behavior in the USP IP did not agree with the other two casts. Similar observations were also reported when comparing deposition in the IP and oral cast for aerosols from several pMDIs.(15) We would only recommend its use as a preseparator for large particles for inhaled drug characterization. In the case of pMDIs, deposition in the IP would be difficult to be included in the overall size distribution because deposition in this case is a result of both size and velocity from the pMDI.
Conclusions
Both latex and oleic acid monodisperse particles were used to investigate the deposition behavior of three mouth–throat models. Experimental results showed good agreement between the LRRI cast and the UofA replica at test flow rates with all size ranges of oleic acid particles and latex particles, if the UofA replica was coated with grease. However, results varied widely for latex particles between these two models without the coating. It is suggested that the UofA replica be coated when the dry powder inhaler is tested. This study only compared total deposition efficiency of the models; no local deposition information was provided.
Deposition results of the UPS IP were not in the mouth–throat deposition range obtained from a human volunteer study. This indicates that the UPS IP is not a good model for the simulation of the mouth–throat region, but can be used as a preseparator with a cascade impactor for pharmaceutical aerosol characterization. The cut-point diameters of the USP IP at 30 and 60 L/min were obtained in this study to help determine the largest particle size setting from the size distribution calculation.
Footnotes
Acknowledgments
The authors thank Dr. Warren Finlay of University of Alberta for providing the idealized oral model; Dr. Worth Longest of Virginia Commonwealth University, Dr. Zhe Zhang of North Carolina State University, Dr. Ahmed Fadl of University of Rhode Island, and Dr. Abdel Dehbi of Paul Scherrer Institute for their assistance in our data comparison; and Paula Bradley and Steve Shinnick of LRRI for reviewing this article. This research is supported by the National Institute for Occupational Safety and Health Contract 254-2010-M-36304 and National Institute of Environmental Health Sciences Grant P01 ES10594.
Author Disclosure Statement
The authors declare that no conflicting financial interest exists.